XAUUSD (Gold) | Technical Outlook | 22nd Jan'2026Gold continues to trade near 4,831, maintaining a strong bullish structure across all major timeframes. Price remains firmly above key moving averages (20/50/100/200), signaling sustained buyer control and trend continuation.
Momentum indicators support the upside, with RSI in bullish territory, MACD positive, and ADX above 35, confirming strong trend strength. Volatility remains elevated, suggesting sharp and directional price moves.
Key Levels to Watch
Support: 4,800–4,790 | 4,770–4,760 | 4,740–4,730
Resistance: 4,838–4,845 | 4,870–4,888
Major Breakout: Above 4,900
Bullish Bias
As long as Gold holds above 4,770–4,780, the trend remains bullish. A break and close above 4,845 could trigger momentum buying toward 4,870 → 4,900+. Pullbacks are expected to remain corrective.
Bearish / Correction
Bearish pressure emerges only below 4,770, with downside levels at 4,740 → 4,700 → 4,660. Trend reversal only if 4,630 breaks on a daily close.
Trading Focus
Buy on dips near 4,800–4,790
Sell only on breakdown below 4,770
Watch US PMI, GDP, Jobless Claims, Fed commentary & DXY for volatility
Conclusion
Gold remains firmly bullish, with the path of least resistance pointing higher unless key supports fail.
Goldpriceaction

Triangle Pattern is forming in 5min ChartGold is consolidating within a triangle pattern, suggesting compression in price action. A downside break from this structure could trigger bearish continuation, especially if confirmed by strong volume and a close below key support levels

Gold Key zones for Downtrend I think 🤔 gold is retreat from my entry key zones due to its correction I expecting one more push towards downside then we plan next setup let's see how it works like 📉📈

XAUUSD (Gold) 15TF Technical Outlook - 22/12/2025 XAU/USD (Gold) maintains a strong bullish structure, with price trading near 4415–4420 and holding firmly above all major moving averages, confirming trend continuation. The primary BUY zone lies at 4410–4408, which is the key pivot, EMA cluster, and decision level for intraday and positional bulls. As long as price sustains above this buy zone, upside momentum remains intact, opening targets toward 4425, 4440, and the extended resistance area of 4460–4480.
On the bearish side, short-term selling pressure or profit booking may emerge near 4425–4440, but this remains corrective in nature. The key BEAR trigger level is below 4400, and stronger bearish confirmation appears only if gold breaks and sustains below 4385–4380, where the bullish structure weakens. A decisive breakdown below these levels could drag price toward 4360–4350, while a complete trend reversal is expected only below 4300. Overall, the market favors buy-on-dips above 4408, with bears gaining control strictly below 4380.

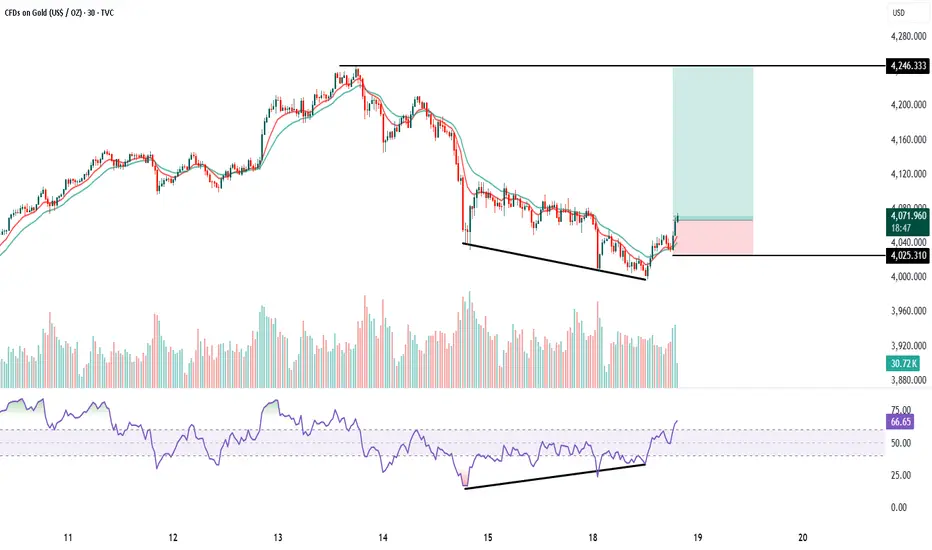
GOLD 30 Min chart analysis1. Trend : Price was in a downtrend with continuous lower highs and lower lows. Now the chart is showing a falling wedge pattern, which is a bullish reversal pattern. Breakout candle is visible with strength, indicating trend reversal from bearish to bullish on the 30-minute timeframe.
2. Volumes: Volumes remained average during the fall.
At the breakout zone, you can see volume expansion, which confirms buyers are stepping in.
This supports a valid bullish breakout.
3. Momentum (Price Action + EMAs): Price is crossing above the 10 EMA and 20 EMA, and both EMAs are starting to turn upward. This shows momentum shift from sellers to buyers. Momentum candles at breakout confirm the start of an upward move.
4. RSI Divergence: Price made lower lows, but RSI made higher lows.
This is a classic bullish divergence, indicating selling pressure is weakening. RSI has now moved above 60, confirming momentum is picking up strongly.
Buy above 4075 after the breakout candle closes above falling wedge.
This ensures confirmation and avoids a false breakout.
Keep SL just below wedge support: SL = 4025
Target : The major horizontal resistance shown on the chart is:
Target = 4246 This is also the measured move of the wedge, matching the resistance zone.
Risk–Reward: RR is approximately 1:3 to 1:3.5, which is ideal for breakout trades. This is a high-probability trend-reversal breakout setup with a clear target and safe stop loss.
GOLD SHOWING A GOOD UP MOVE WITH 1:10 RISK REWARD GOLD SHOWING A GOOD UP MOVE WITH 1:10 RISK REWARD
DUE TO THESE REASON
A. its following a rectangle pattern that stocked the market
which preventing the market to move any one direction now it trying to break the strong resistant lable
B. after the break of this rectangle it will boost the market potential for break
C. also its resisting from a strong neckline the neckline also got weeker ald the price is ready to break in the outer region
all of these reason are indicating the same thing its ready for breakout BREAKOUT trading are follws good risk reward
please dont use more than one percentage of your capitalfollow risk reward and tradeing rules
that will help you to to become a bettertrader
thank you

Trading strategy for GOLD after 6.8% fall: 21/10/25Increase in profit booking volume, easing of the US-China trade war, strengthening of the USD, contributing to the decline of XAUUSD.
Technical levels and trading strategies are the main topics of this video analysis.

Gold Bullish Reversal from Demand Zone Targeting 4320 ResistanceGold has displayed a strong bullish rejection from the 4,220–4,240 demand zone, signaling that buyers are stepping back in after a brief corrective phase. The price has respected the previously broken ascending trendline, now acting as dynamic support, indicating that market sentiment remains positive.
Key Observations:
Trend Structure: The broader trend continues to favor the bulls, with higher highs and higher lows still valid.
Demand Zone: Buyers defended the 4,220–4,240 area with stxrong volume, confirming institutional interest.
Price Action: Recent bullish engulfing candles suggest renewed buying momentum.
Next Resistance: The 4,310–4,330 region stands as a key resistance zone where partial profit-taking could occur.
Volume: Noticeable increase in bullish volume near support adds confirmation to the move.
Trading Outlook:
If price sustains above 4,240, the bias remains bullish toward 4,320–4,340.
A daily close below 4,220 would invalidate this setup and shift focus back to the 4,100 zone.
Summary
Gold is currently positioned for a potential continuation of its primary uptrend, with early signs of buyer strength re-emerging at major support. Momentum remains in favor of the bulls as long as the 4,220 base holds firm.

GOLD SHOWING A GOOD UP MOVE WITH 1:10 RISK REWARD GOLD SHOWING A GOOD UP MOVE WITH 1:10 RISK REWARD
DUE TO THESE REASON
A. its following a rectangle pattern that stocked the market
which preventing the market to move any one direction now it trying to break the strong resistant lable
B. after the break of this rectangle it will boost the market potential for break
C. also its resisting from a strong neckline the neckline also got weeker ald the price is ready to break in the outer region
all of these reason are indicating the same thing its ready for breakout BREAKOUT trading are follws good risk reward
please dont use more than one percentage of your capitalfollow risk reward and tradeing rules
that will help you to to become a bettertrader
thank you

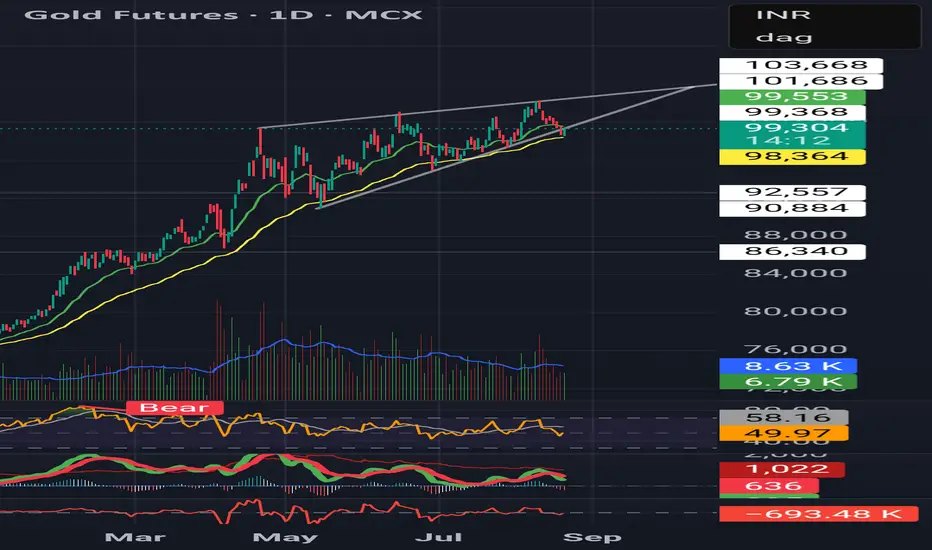
Strategic Long-Term Perspective on GoldGold Market Analysis – Report View
Gold has delivered a strong bullish cycle after weeks of accumulation. The past phase showed a contracting range where liquidity was built up and multiple structural shifts occurred, signaling preparation for expansion. Once price broke out of that range in late August, momentum accelerated, leading to a clean and sustained rally into September.
The recent move highlights how market flow continues to favor the upside, with each correction acting as a re-accumulation zone rather than a trend reversal. Institutional order flow remains visible, supporting higher valuations as price respects bullish market structure.
Currently, gold is stabilizing after the sharp leg upward. This pause suggests a phase of healthy consolidation, likely absorbing liquidity before attempting the next impulsive wave higher. Overall sentiment remains constructive, with bullish continuation the dominant narrative unless a major structural shift occurs.

GOLD SHOWING A GOOD UP MOVE WITH 1:10 RISK REWARD GOLD SHOWING A GOOD UP MOVE WITH 1:10 RISK REWARD
DUE TO THESE REASON
A. its following a rectangle pattern that stocked the market
which preventing the market to move any one direction now it trying to break the strong resistant lable
B. after the break of this rectangle it will boost the market potential for break
C. also its resisting from a strong neckline the neckline also got weeker ald the price is ready to break in the outer region
all of these reason are indicating the same thing its ready for breakout BREAKOUT trading are follws good risk reward
please dont use more than one percentage of your capitalfollow risk reward and tradeing rules
that will help you to to become a bettertrader
thank you

XAUUSD SHOWING A GOOD DOWN MOVE WITH 1:10 RISK REWARD CPI UPDATEXAUUSD SHOWING A GOOD DOWN MOVE WITH 1:10 RISK REWARD DUE TO THESE REASON
A. its following a rectangle pattern that stocked the marketwhich preventing the market to move any one direction now it trying to break the strong resistant lable
B. after the break of this rectangle it will boost the market potential for breakC. also its resisting from a strong neckline the neckline also got weeker ald the price is ready to break in the outer region
all of these reason are indicating the same thing its ready for breakout BREAKOUT trading are follws good risk reward
please dont use more than one percentage of your capitalfollow risk reward and tradeing rules that will help you to to become a bettertrader
thank you

Spot Gold, Door Open for $3800, Need Patience.Spot #Gold, Door Open for $3800, Need Patience. (Any Panic Buy on Dips).
Gold’s price broke through an important level at $3,450, which experts call a “symmetrical triangle pattern.” This is a sign that gold might keep going up, continuing a trend that started earlier this year. After a strong two-month rise starting in February, gold took a break but now seems ready to climb again. Some experts think gold could reach $3,600 or even $3,800 soon, which would beat its previous high of $3,500 from April 22.

Rising Wedge in Gold
Bearish divergence visible in RSI & MACD
Volumes thinning out on rallies
Suggests safe-haven demand cooling
⚠️ Watch for breakdown below support — could trigger deeper correction.
XAUUSD | Technical Analysis for 06/08/2025Hi,
A short upside move is expected till 3380. It is taking rejection from 0.75 level of last swing.
Disclaimer: This is only for educational purpose.
Thanks

GIf the ascending triangle is broken, $GOLD will blast upside! Gold Price Alert: Ascending triangle breakout near $3450 if sustained for one day. Potential targets at $3663, $3800, $ 3900 on the cards.

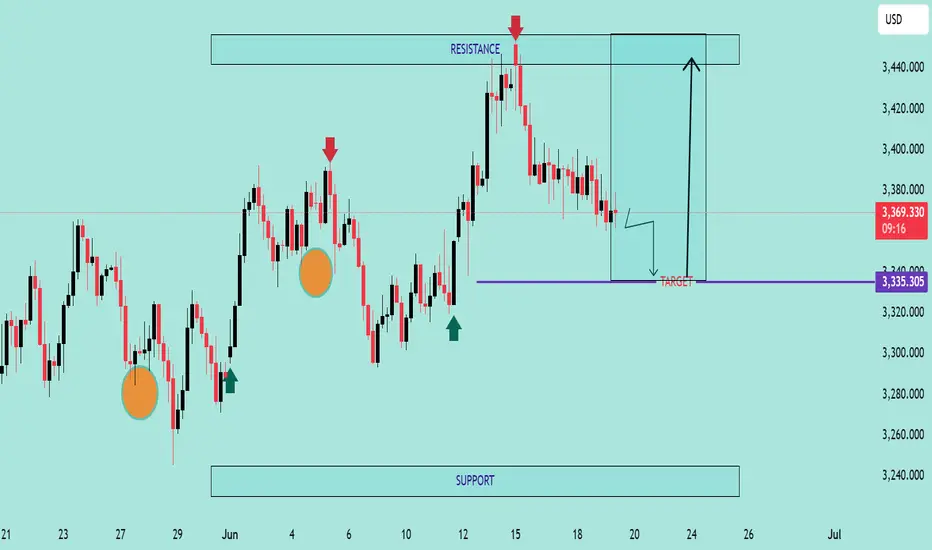
GOLD/USD Support Retest & Breakdown SetupGOLD/USD Support Retest & Breakdown Setup 📉🔍
🔹 Overview:
The chart indicates a potential bearish continuation pattern on GOLD/USD as the price is approaching a key support level at 3,335.305. Previous price action shows multiple rejections from the resistance zone (~3,435), followed by lower highs – a sign of weakening bullish momentum.
📊 Technical Analysis:
🔺 Resistance Zone (~3,435)
Multiple rejections (🔴 red arrows) indicate strong supply pressure.
Price has failed to break above this area thrice, forming a clear ceiling.
🔻 Support Zone (~3,335)
Marked as the target for a short setup.
Price is testing this level again after forming a minor consolidation below lower highs.
A clean break below this purple zone may trigger a continuation to the downside, targeting the broader support range below (~3,240).
🟠 Bearish Structure:
Series of lower highs (highlighted with circles).
Breakdown pattern is developing with declining bullish momentum.
📈 Potential Play:
A confirmed breakdown below 3,335 could lead to a drop toward the next major support.
If support holds, short-term bounce is possible but limited by the dominant resistance.
📌 Conclusion:
GOLD/USD is currently in a bearish setup, with the market eyeing a potential breakdown below a critical support zone. If this level fails to hold, we could see accelerated bearish momentum toward the lower support range.
💡 Caution: Wait for a confirmed close below support before entering any short trades.
GOLD SPOT (XAU/USD) 4H Analysis – Bullish Momentum Breakout🔔 GOLD SPOT (XAU/USD) 4H Analysis – Bullish Momentum Breakout 💥📈
📊 Overview:
Gold has confirmed a strong bullish breakout from the consolidation zone, driven by sustained support and recent upward pressure. After rebounding from the MAIN SUPPORT zone around $3,200, price action has surged and successfully touched the 1st Take Profit (TP1) zone at $3,429.
🔍 Key Levels:
🟩 Main Support: $3,200 zone — held firm and acted as a launchpad for the bullish reversal.
📌 1st TP (Touched): $3,429 — resistance level has been tested and price is currently hovering near it.
🎯 Next Target (TP2): $3,504 — price is expected to approach this zone as bullish momentum continues.
📈 Technical Outlook:
Price structure shows a clear higher low formation followed by a strong impulse breakout.
Current momentum suggests bulls are in control, with volume and volatility increasing on the upward leg.
As long as the price remains above the $3,366 short-term support, the bias remains bullish.
🛑 Risk Note:
Watch for possible rejection near TP2.
A failure to hold above $3,366 may trigger a pullback to retest lower zones.
✅ Conclusion:
The bullish continuation scenario remains valid with potential to hit the $3,504 mark. Traders may look for long opportunities on pullbacks while maintaining tight risk management. 🔐📊

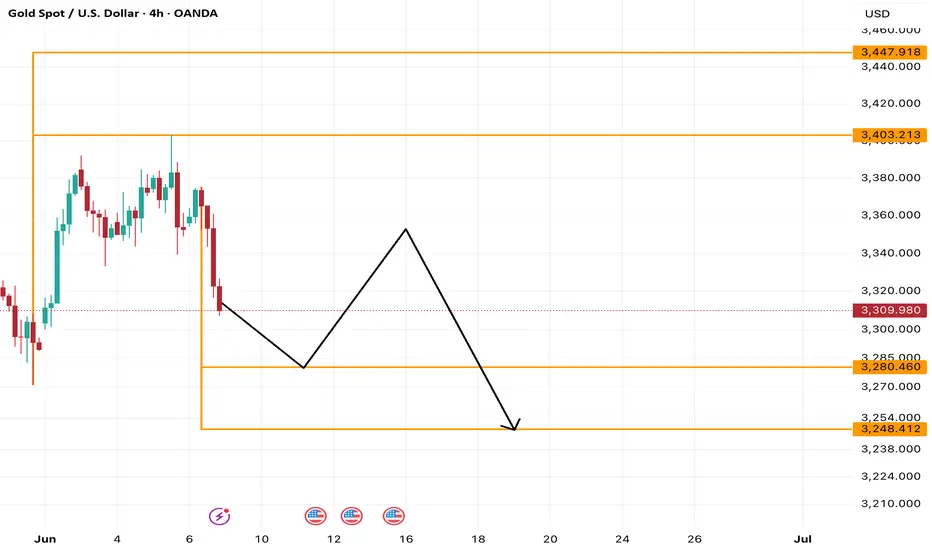
XAUUSD | Weekly Analysis for Week 9 - 13 June 2025Hi,
I am sharing my view on gold movement for coming week. It can go downside upto 3280 and 3248 levels.
Disclaimer: This is only for educational purpose.
Thanks
XAUUSD | Technical Analysis 3rd June 2025Hi,
I am sharing my view on gold further movement.
Disclaimer: This is only for educational purpose.
Thanks

XAUUSD | Intraday Technical Analysis 2nd June 2025Hi,
Gold can go upto 3351 and 3400 on traday basis.
Disclaimer: This is only for educational purpose.
Thanks

XAUUSD Technical Analysis | 29 May 2025Hi,
I am sharing further view on gold for 29 May.
Disclaimer: This is only for education purpose.
Thanks

GOLD SHOWING A GOOD UP MOVE WITH 1:10 RISK REWARD GOLD SHOWING A GOOD UP MOVE WITH 1:10 RISK REWARD
DUE TO THESE REASON
A. its following a rectangle pattern that stocked the market
which preventing the market to move any one direction now it trying to break the strong resistant lable
B. after the break of this rectangle it will boost the market potential for break
C. also its resisting from a strong neckline the neckline also got weeker ald the price is ready to break in the outer region
all of these reason are indicating the same thing its ready for breakout BREAKOUT trading are follws good risk reward
please dont use more than one percentage of your capitalfollow risk reward and tradeing rules
that will help you to to become a bettertrader
thank you
