Gold (XAUUSD) – Bears Eye the 4000 Wall! Short Setup AheadGold is currently trading within a tight range of 3990 – 3960, and price action is now approaching the crucial resistance zone at 3990 – 4000.
📈 This area has acted as a strong supply zone in recent sessions — and could once again attract sellers.
💡 Trading Plan:
🔸 Sell Zone: 4000 – 4003
🎯 Targets: 3990, 3980 and 3970
🛑 Invalidation: View remains valid below 4012 — a sustained break above this level would negate the short setup and could open the door for further upside momentum.
📊 Bias: Bearish near resistance until confirmed breakout above 4012
💬 Watch for rejection signals or bearish candles in this zone before entering.
⚠️ Disclaimer
This is for educational purposes only — not financial advice. Always manage your risk and use proper position sizing.
Your feedback drives our content and keeps everyone trading smarter. Let’s make those pips together! 🚀
Happy Trading,
– The InvestPro Team
Goldsellsignal

Gold (XAUUSD) – Bears Eye the 4045 Wall! Short Setup AheadGold is currently trading within a tight range of 3980 – 4045, and price action is now approaching the crucial resistance zone at 4035 – 4045.
📈 This area has acted as a strong supply zone in recent sessions — and could once again attract sellers.
💡 Trading Plan:
🔸 Sell Zone: 4035 – 4045
🎯 Targets: 4021 and 4012
🛑 Invalidation: View remains valid below 4051.5 — a sustained break above this level would negate the short setup and could open the door for further upside momentum.
📊 Bias: Bearish near resistance until confirmed breakout above 4051.5
💬 Watch for rejection signals or bearish candles in this zone before entering.
⚠️ Disclaimer
This is for educational purposes only — not financial advice. Always manage your risk and use proper position sizing.
Your feedback drives our content and keeps everyone trading smarter. Let’s make those pips together! 🚀
Happy Trading,
– The InvestPro Team

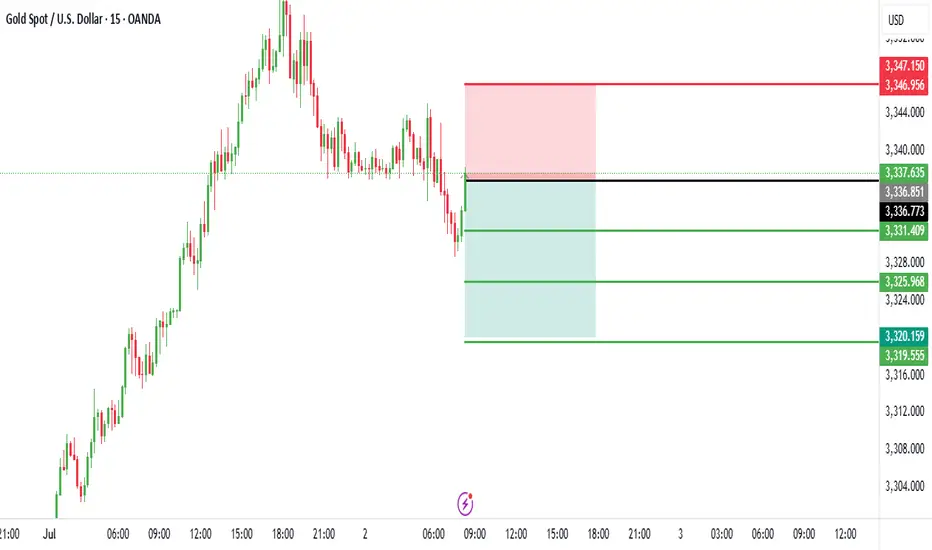
Trading Analysis for Gold Spot / U.S. Dollar (15-Minute Chart)Based on the provided 15-minute chart for Gold Spot / U.S. Dollar (XAU/USD) and the specified data, here’s a suggested trading setup for a sell position:
Current Price and Trend: The current price is not explicitly provided, but the entry price is set at 3,336.00. The chart suggests a potential resistance zone near this level, with a recent uptrend showing signs of exhaustion.
Sell Entry: Enter a sell position at 3,336.00, aligning with the specified entry price where the price may face rejection due to resistance.
Stop Loss: Place a stop loss at 3,346.00, above the recent high, to protect against an upward breakout. This level is 10.00 points above the entry, defining the risk.
Take Profit Levels:
Take Profit 1: 3,331.00, a conservative target 5.00 points below the entry.
Take Profit 2: 3,326.00, a mid-range target 10.00 points below the entry.
Take Profit 3: 3,321.00, a deeper target 15.00 points below the entry, aligning with a potential support zone.
Price Action: The chart indicates a peak near the entry level, with a bearish reversal signal suggested by the candlestick pattern and resistance line.
Risk-Reward Ratio: The distance to the stop loss (10.00 points) compared to the take profit levels (5.00 to 15.00 points) offers a mixed risk-reward profile. Take Profit 2 and 3 provide a 1:1 and 1:1.5 ratio, respectively, making this a balanced short-term trade.
Conclusion
Enter a sell at 3,336.00, with a stop loss at 3,346.00 and take profit levels at 3,331.00, 3,326.00, and 3,321.00. Monitor the price action for confirmation of a downtrend, and be cautious of a potential upward move if the price breaks above the stop loss level.
Trading Analysis for Gold Spot / U.S. Dollar (15-Minute Chart)Based on the provided 15-minute chart for Gold Spot / U.S. Dollar (XAU/USD), published by NaviPips on TradingView.com on June 25, 2025, at 12:28 UTC, here’s a suggested trading setup for a sell position:
Current Price and Trend: The current price is 3,331.315, with a slight decline of -1.390 (-0.04%). The chart shows a recent downtrend with a potential resistance zone near the current price.
Sell Entry Options:
1st Entry: Enter a sell position at 3,355.490, aligning with the upper resistance level marked, where the price may face rejection.
2nd Entry: Enter a sell position at 3,344.221, a secondary resistance level if the price retraces slightly.
Stop Loss: Place a stop loss at 3,357.831, above the recent high, to protect against an upward breakout. This level is approximately 2.341 points above the 1st entry and 13.610 points above the 2nd entry, defining the risk.
Take Profit Levels:
Take Profit 1: 3,325.242, a conservative target about 30.248 points below the 1st entry and 18.979 points below the 2nd entry.
Take Profit 2: 3,316.079, a mid-range target approximately 39.411 points below the 1st entry and 28.142 points below the 2nd entry.
Take Profit 3: 3,304.625, a deeper target about 50.865 points below the 1st entry and 39.596 points below the 2nd entry.
Take Profit 4: 3,286.474, the furthest target, approximately 69.016 points below the 1st entry and 57.747 points below the 2nd entry.
Price Action: The chart indicates a downtrend with a recent bounce that may be exhausting near the 1st and 2nd entry levels. The 1:2 risk-reward ratio zone suggests a potential reversal point.
Risk-Reward Ratio: .
For the 1st entry (3,355.490), the stop loss to Take Profit 4 distance (69.016 points) offers a 1:2 risk-reward ratio with Take Profit 2 (39.411 points).
For the 2nd entry (3,344.221), the stop loss to Take Profit 4 distance (57.747 points) also aligns with a favorable risk-reward profile.
Conclusion
Option 1: Sell at 3,355.490 with a stop loss at 3,357.831 and take profit levels at 3,325.242, 3,316.079, 3,304.625, and 3,286.474.
Option 2: Sell at 3,344.221 with a stop loss at 3,357.831 and the same take profit levels. Monitor the price action for confirmation of a reversal at the entry levels, and be cautious of potential bullish momentum if the price breaks above the stop loss.

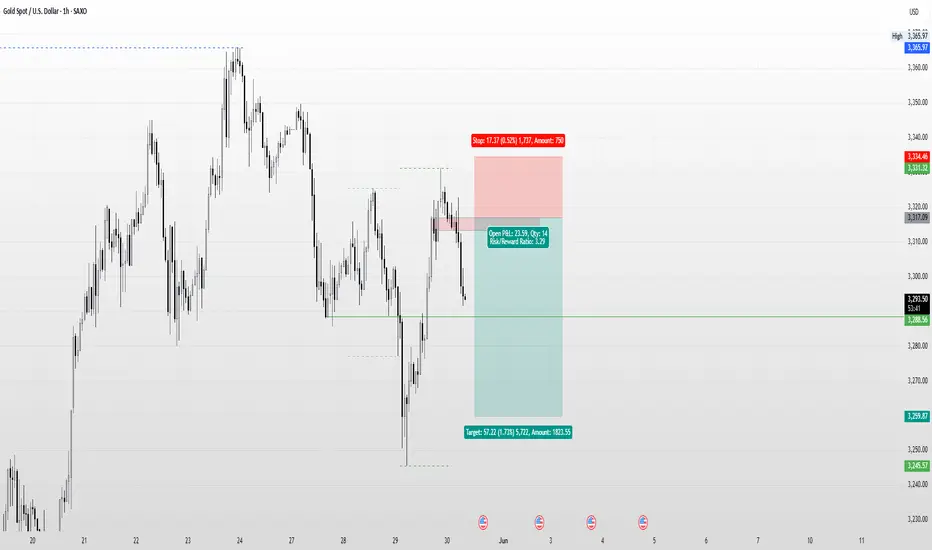
XAUUSD (Gold) Analysis – Daily & Intraday OutlookOn the daily timeframe, we are observing a bearish price action structure. If the market continues to move lower, potential downside targets could range between 3288 to 3259.
However, on the 1-hour timeframe, post the Asian session liquidity hunt, the market has started to show signs of selling pressure. If the market retraces during the London session, it could present a high-probability sell opportunity on the lower timeframes, potentially offering a favorable risk-to-reward ratio.
That being said, as we all know, trading is a game of probabilities. With every opportunity comes risk, and no trading setup or strategy can guarantee 100% success. This analysis is purely for educational purposes and should not be considered investment advice.
Disclaimer :
Trading in financial markets involves substantial risk and may not be suitable for all investors. The content provided here is for informational and educational purposes only and does not constitute financial, investment, or trading advice. Always do your own research or consult with a licensed financial advisor before making any trading decisions. The author is not liable for any losses incurred from trading or investing based on this analysis.