Gold Maintains Bullish Momentum,Watching for Breakout Above 4150📊 Market Overview:
Gold is currently trading around 4140. Market sentiment remains tilted toward buying due to expectations of an upcoming Fed rate cut, while the USD shows mild weakening during the session.
📉 Technical Analysis:
• Key resistance: 4150 – 4162
• Nearest support: 4125 – 4130
• EMA: Price is above the EMA-09, indicating the bullish trend is still intact.
• Candlestick / Momentum:
– The 4150 zone is forming a strong resistance; H1 candles show upper wicks → short-term profit-taking pressure.
– If H1 closes above 4150 → gold may extend to 4175 – 4190.
– If it fails, price may retest 4130.
📌 Outlook:
Gold may continue rising if it breaks above 4150 with a confirmed candle.
Otherwise, if it cannot break 4150 in the next 2–3 H1 candles, the market could retrace to 4130 before rising again.
________________________________________
💡 Suggested Trading Strategy:
🔺 BUY XAU/USD
Entry: 4128 – 4132
🎯 TP: 40 / 80 / 200 pips
❌ SL: 4125
Goldsetup

Gold Drops to 4050 – Testing a Key Support Zone📊 Market Overview:
Gold continues to fall toward the 4050 region as the US Dollar strengthens and US bond yields edge higher, reducing safe-haven demand. The market is now awaiting clearer signals from the Fed minutes and upcoming US economic data, causing bullish momentum to weaken.
________________________________________
📉 Technical Analysis:
Key Resistance: 4072 – 4085
Stronger Resistance: 4095 – 4105
Nearest Support: 4055
Stronger Support: 4045 – 4040
EMA09: Price is trading below the EMA09 on the H1 chart → short-term bearish signal.
Candlestick / Momentum:
H1 candles continue forming lower highs, showing sellers are in control. Volume is gradually decreasing, indicating the market is waiting for a reaction at the 4050 support zone.
________________________________________
📌 Outlook:
• Gold may continue to decline in the short term if price breaks below 4045.
• Conversely, if gold bounces strongly from 4050 with a clear reversal candle, price could retrace toward 4072–4085, and may extend to 4095 if buying pressure strengthens.
________________________________________
💡 Suggested Trading Strategy:
🔻 SELL XAU/USD at: 4082 – 4085
🎯 TP: 40 / 80 / 200 pips
❌ SL: 4088
🔺 BUY XAU/USD at: 4040 – 4037
🎯 TP: 40 / 80 / 200 pips
❌ SL: 4035

Gold (XAU/USD) Sell Trade Analysis1. Technical Rationale for a Sell (Short) Setup
Rejection from All-Time Highs (ATH): Gold recently printed an all-time high around $4380. The sharp, rapid reversal from this level is a classic sign of profit-taking and potential exhaustion in the immediate uptrend, often forming a possible Double Top on the higher timeframes (e.g., 4-Hour, Daily).
Trendline Break: The recent sell-off broke below a significant ascending trendline/channel on intraday and possibly 4-hour charts, signaling a near-term shift in market structure from bullish to bearish.
Key Resistance Test: The price is currently finding resistance near the previous key support and psychological round numbers that were broken during the recent sharp drop. This zone is a likely area for sellers to re-enter the market.
2. Trade Setup Details
Parameter Recommended Zone (Approx.) Rationale
Entry Zone (Sell Limit/Market) $4200 - $4225 This is a major psychological and former support area. It also aligns with the "Neckline" of the potential Double Top pattern and key structural resistance from which the previous drop initiated.
Stop Loss (SL) $4240 - $4250 Placing the SL safely above the main short-term resistance and the high of the current pullback, which would invalidate the immediate bearish outlook.
Target 1 (TP1) $4100 - $4095 This level represents the low of the initial sharp sell-off (the Double Top's neckline) and a key psychological round number, which is a common immediate target for profit-taking.
Target 2 (TP2) $4020 - $4000 A break below TP1 clears the path to the major psychological support at $4000. This also aligns with the typical "Measured Move" target of the Double Top pattern.
Export to Sheets
3. Key Levels to Watch
Level Type Significance
Immediate Resistance $4225 High of the current bounce/re-test area.
Critical Resistance $4380 All-Time High (ATH) and top of the potential Double Top. A close above this invalidates all bearish structure.
Immediate Support $4100 Key psychological and structural support (Neckline).
Major Support $4000 Major psychological round number, a long-term anchor.
Export to Sheets
4. Risk Management Note
The overarching long-term trend for Gold is still considered bullish due to global economic uncertainty and central bank rate cut expectations. This Sell Trade is a counter-trend or short-term correctional trade.
Only enter with confirmation (e.g., a bearish candlestick rejection on a lower timeframe like 1-Hour or 4-Hour once the price hits the entry zone).
Risk Management is paramount: Do not risk more than 1-2% of your capital on this single trade\
Disclaimer: Trading is highly risky. This analysis is for informational purposes and is not financial advice. Always use a Stop Loss and manage your risk.

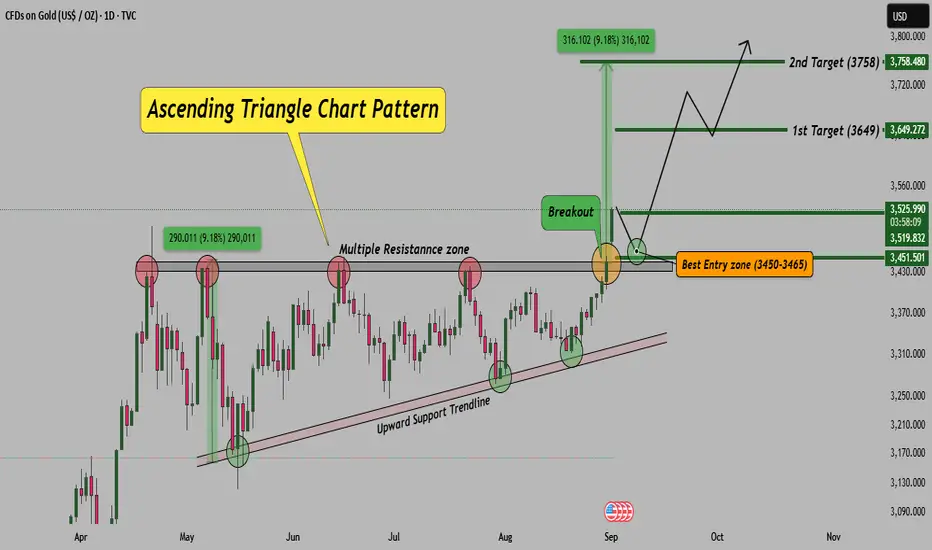
Gold Daily Chart – Ascending Triangle Breakout!Gold has formed a strong ascending triangle pattern on the daily timeframe. The price has successfully broken above the resistance zone, confirming bullish momentum. Such patterns generally indicate continuation of the uptrend, especially when supported by volume and strong price action.
Chart Observation:
As long as price holds above 3,450, the bullish setup remains valid.
A retest of the breakout zone can provide the best risk-to-reward entry opportunity.
Traders should keep an eye on volume confirmation while entering trades.
Note: If levels sustain and setup remains intact, I will share live trade updates in real time. Stay tuned.
Disclaimer: This analysis is for educational purposes only. Please do your own research or consult your financial advisor before taking trades.
XAUUSD 1H – Watching for a Bounce Inside the ChannelGold is still moving nicely inside this big ascending channel. After hitting resistance, price is pulling back toward the lower support area and trendline.
👉 My Plan:
Waiting to see if price holds around $3,310–$3,320 zone.
If we get bullish signs (strong candle, rejection wick), I’ll look for longs back up toward $3,350–$3,370 and maybe higher.
✅ Key Levels:
Support: $3,310 area
Resistance: $3,345 – $3,370
Break below support could invalidate this idea.
Just being patient and letting price action confirm the next move. Let’s see how it plays out!

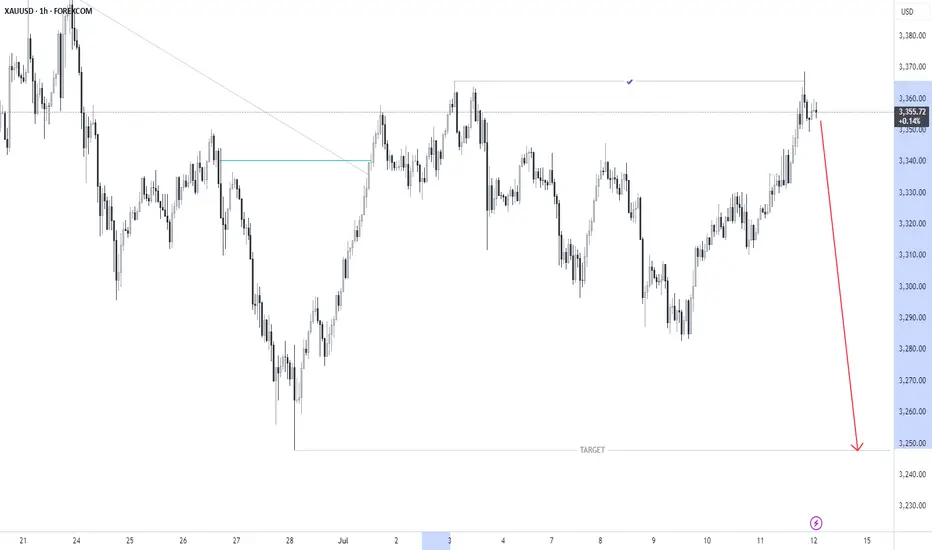
XAUUSD - 1H SHORT (GOLD)FOREXCOM:XAUUSD
Hello traders , here is the full multi time frame analysis for this pair, let me know in the comment section below if you have any questions, the entry will be taken only if all rules of the strategies will be satisfied. wait for more Smart Money to develop before taking any position . I suggest you keep this pair on your watchlist and see if the rules of your strategy are satisfied...
Keep trading
Hustle hard
Markets can be Unpredictable, research before trading.
Disclaimer: This trade idea is based on Smart money concept and is for informational purposes only. Trading involves risks; seek professional advice before making any financial decisions. Informational only!!!
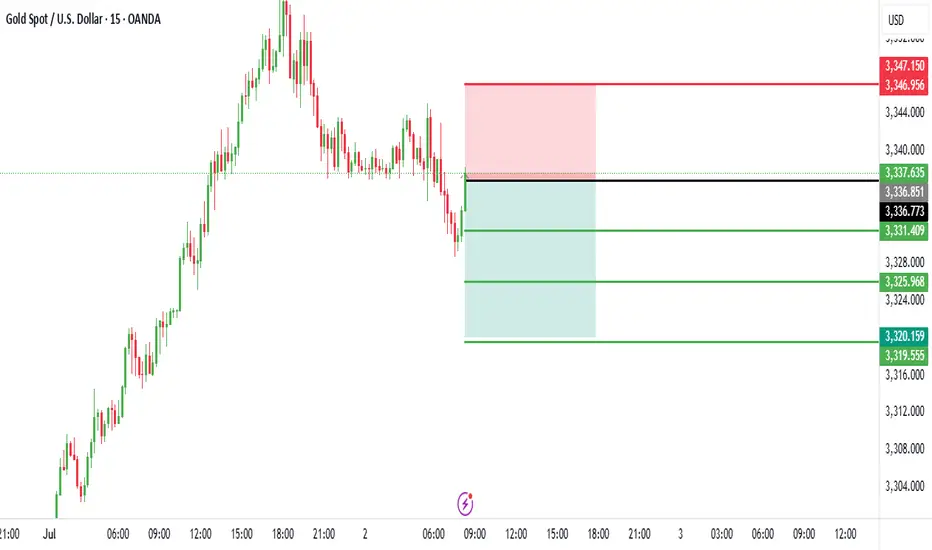
Trading Analysis for Gold Spot / U.S. Dollar (15-Minute Chart)Based on the provided 15-minute chart for Gold Spot / U.S. Dollar (XAU/USD) and the specified data, here’s a suggested trading setup for a sell position:
Current Price and Trend: The current price is not explicitly provided, but the entry price is set at 3,336.00. The chart suggests a potential resistance zone near this level, with a recent uptrend showing signs of exhaustion.
Sell Entry: Enter a sell position at 3,336.00, aligning with the specified entry price where the price may face rejection due to resistance.
Stop Loss: Place a stop loss at 3,346.00, above the recent high, to protect against an upward breakout. This level is 10.00 points above the entry, defining the risk.
Take Profit Levels:
Take Profit 1: 3,331.00, a conservative target 5.00 points below the entry.
Take Profit 2: 3,326.00, a mid-range target 10.00 points below the entry.
Take Profit 3: 3,321.00, a deeper target 15.00 points below the entry, aligning with a potential support zone.
Price Action: The chart indicates a peak near the entry level, with a bearish reversal signal suggested by the candlestick pattern and resistance line.
Risk-Reward Ratio: The distance to the stop loss (10.00 points) compared to the take profit levels (5.00 to 15.00 points) offers a mixed risk-reward profile. Take Profit 2 and 3 provide a 1:1 and 1:1.5 ratio, respectively, making this a balanced short-term trade.
Conclusion
Enter a sell at 3,336.00, with a stop loss at 3,346.00 and take profit levels at 3,331.00, 3,326.00, and 3,321.00. Monitor the price action for confirmation of a downtrend, and be cautious of a potential upward move if the price breaks above the stop loss level.
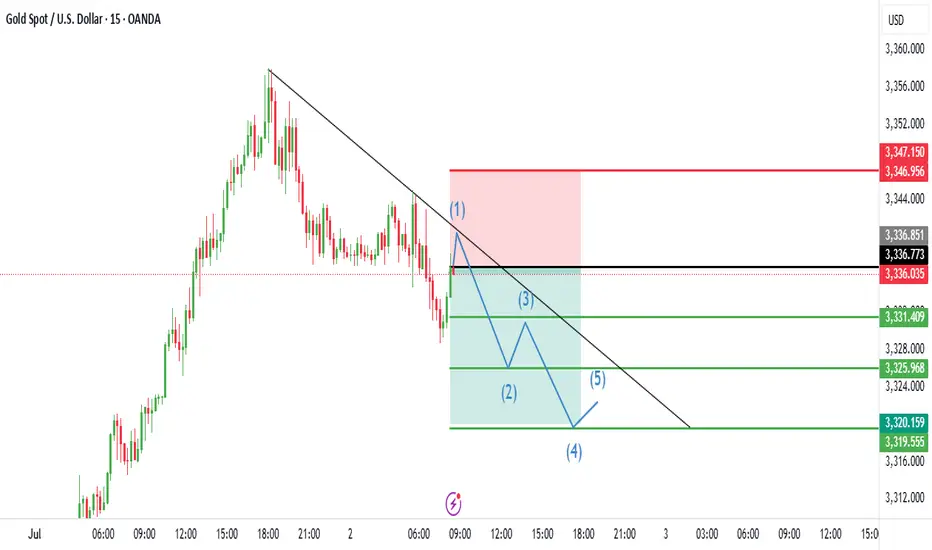
Trading Analysis for Gold Spot / U.S. Dollar (15-Minute Chart)
Based on the provided 15-minute chart for Gold Spot / U.S. Dollar (XAU/USD) and the specified data, here’s a suggested trading setup for a sell position:
Current Price and Trend: The current price is not explicitly provided, but the entry price is set at 3,336.00. The chart suggests a potential resistance zone near this level, with a recent uptrend showing signs of exhaustion.
Sell Entry: Enter a sell position at 3,336.00, aligning with the specified entry price where the price may face rejection due to resistance.
Stop Loss: Place a stop loss at 3,346.00, above the recent high, to protect against an upward breakout. This level is 10.00 points above the entry, defining the risk.
Take Profit Levels:
Take Profit 1: 3,331.00, a conservative target 5.00 points below the entry.
Take Profit 2: 3,326.00, a mid-range target 10.00 points below the entry.
Take Profit 3: 3,321.00, a deeper target 15.00 points below the entry, aligning with a potential support zone.
Price Action: The chart indicates a peak near the entry level, with a bearish reversal signal suggested by the candlestick pattern and resistance line.
Risk-Reward Ratio: The distance to the stop loss (10.00 points) compared to the take profit levels (5.00 to 15.00 points) offers a mixed risk-reward profile. Take Profit 2 and 3 provide a 1:1 and 1:1.5 ratio, respectively, making this a balanced short-term trade.
Conclusion
Enter a sell at 3,336.00, with a stop loss at 3,346.00 and take profit levels at 3,331.00, 3,326.00, and 3,321.00. Monitor the price action for confirmation of a downtrend, and be cautious of a potential upward move if the price breaks above the stop loss level.
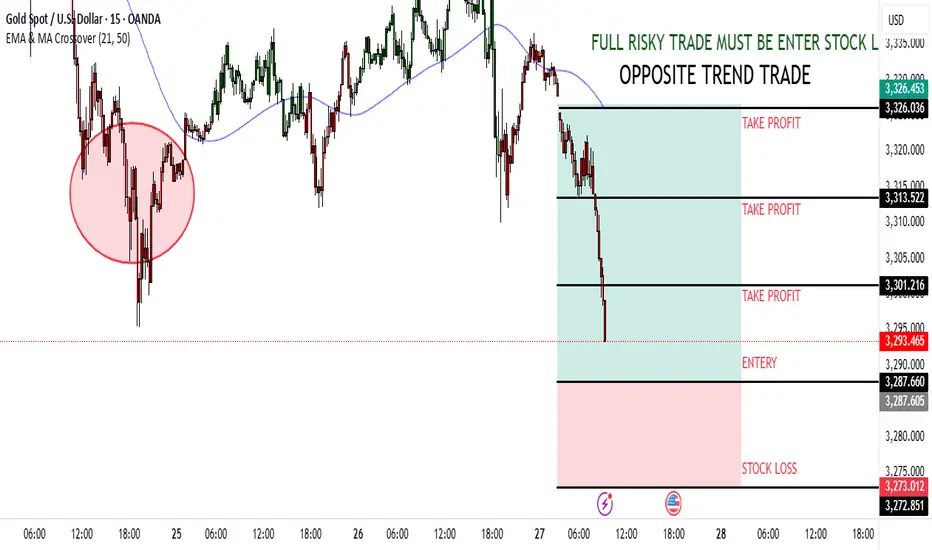
Trading Analysis for Gold Spot / U.S. Dollar (15-Minute Chart)
Based on the provided 15-minute chart for Gold Spot / U.S. Dollar (XAU/USD), published by NaviPips on TradingView.com on June 27, 2025, at 09:20 UTC, here’s a suggested trading setup for a sell position:
1. **Current Price and Trend**: The current price is 3,295.890, with a slight decline of -0.235 (-0.10%). The chart shows a recent uptrend that appears to be exhausting near the current level, with a potential reversal indicated by the EMA crossing and a bearish candle.
2. **Sell Entry**: Enter a sell position at 3,295.890 (current price), as it aligns with the resistance zone where the price has peaked and started to decline, supported by the "FULL RISKY TRADE MUST BE ENTER OPPOSITE TREND TRADE" label.
3. **Stop Loss**: Place a stop loss at 3,275.012, below the recent low, to protect against an upward continuation. This level is approximately 20.878 points below the entry, defining the risk.
4. **Take Profit Levels**:
- **Take Profit 1**: 3,326.453, a conservative target about 30.563 points above the entry, aligning with a minor resistance zone.
- **Take Profit 2**: 3,315.522, a mid-range target approximately 19.632 points above the entry.
- **Take Profit 3**: 3,301.216, a deeper target about 5.326 points above the entry.
- **Take Profit 4**: 3,287.605, the furthest target, approximately 8.285 points below the entry, indicating a potential trend reversal.
5. **Price Action**: The chart shows an uptrend with a recent peak followed by a bearish reversal signal. The EMA crossover and the "opposite trend trade" label suggest a high-risk sell setup against the prevailing uptrend.
6. **Risk-Reward Ratio**: The distance to the stop loss (20.878 points) compared to the take profit levels (5.326 to 30.563 points) presents a mixed risk-reward profile. Take Profit 1 offers a 1:1.5 ratio, while lower targets like Take Profit 4 result in a negative ratio, highlighting the high-risk nature of this trade.
### Conclusion
Enter a sell at 3,295.890, with a stop loss at 3,275.012 and take profit levels at 3,326.453, 3,315.522, 3,301.216, and 3,287.605. This is a high-risk trade due to the "opposite trend" strategy, so confirm the reversal with additional indicators and be prepared for potential continued upward momentum if the stop loss is hit.
WE ARE LOOKING FOR BUYING GOLDWe intend to execute a long position in gold, predicated on yesterday's bullish activity observed during the New York session. A support level has been identified near 3322, and the instrument is anticipated to find support at this level. The entry is justified by the confirmation of support on a Fair Value Gap (FVG). Consequently, a buy position will be initiated with a stop-loss set at 3318 and profit targets established at 3333, 3340, and 3350.

WE ARE GOING TO SHORT GOLD BECAUSE IT's GIVING BEARISH MOVE XAUUSD is currently below the 14, 50, and 200 moving averages on the 5-min chart. So, I'm looking to go short after it breaks 3324 (that's the support level). I'll enter the short trade there, with a stop-loss at 3333.

GOLD’S IN OVERDRIVE - MISSED THE TRAIN? WAIT FOR THE NEXT STOP!Symbol - XAUUSD
CMP - 3330
Gold remains in a strong upward trend, consistently reaching new all-time highs. Entering a rapidly advancing market without sufficient opportunity to assess risk is inadvisable. Therefore, engaging in the current momentum without a confirmed technical setup is not recommended. A potential price correction ahead of upcoming US retail sales data and a speech by Federal Reserve Chair Jerome Powell may provide a more favorable environment to identify trading opportunities.
The rally is being driven by several fundamental factors, including robust economic data from China, increased demand for safe-haven assets amid escalating geopolitical tensions, and trade uncertainties between the US and China. Further upward momentum is being supported by ANZ’s revised forecast, which projects gold prices could reach $3,600 by year-end.
From a technical standpoint, the psychological resistance zone between $3330 and $3350 is of particular interest, where a pullback may be expected. The preferred strategy would be to await a correction toward local or intermediate support levels before considering long positions.
Key Resistance Levels: 3330, 3350
Key Support Level: 3275, 3265, 3244
Given the strength of the prevailing bullish trend, breakout strategies above resistance levels may be effective. However, such an approach requires clear price consolidation, which is not currently present. Alternatively, a more prudent strategy would be to wait for a retracement, a confirmation of support, and then consider initiating long positions.

GOLD FACES MAJOR PULLBACK: WILL IT BOUNCE BACK OR BREAK DOWN?Symbol - XAUUSD
CMP - 3032
Gold is currently undergoing a significant liquidation phase, primarily driven by profit taking following last week's favorable market news. The market sentiment has been further pressured by the robust Non-Farm Payroll (NFP) report released on Friday. The economic risk landscape is showing signs of divergence.
Following a decline in the Asian trading session, gold prices have rebounded, consolidating the earlier drop precipitated by the escalating trade tensions between the United States and China. Comments from Trump rejecting potential trade deals with China have heightened recession concerns, which, in turn, have increased expectations of a potential Federal Reserve rate cut.
In this environment, gold has gained traction as a safe-haven asset, even amid rising dollar strength and climbing bond yields. However, the sustainability of gold's upward momentum remains uncertain due to ongoing profit-taking and the absence of new economic data from the United States.
From a technical perspective, gold is consolidating under pressure near the support levels of 3017-3013, with a descending triangle pattern forming on the local timeframe.
Resistance Levels: 3033, 3057
Support Levels: 3017, 3013, 2981
Given the current market dynamics and the strong pressure exerted on prices, two scenarios appear plausible:
A breakdown below the support range of 3017-3013, should the descending triangle structure on the local timeframe persist. In this case, the next targets for support are 3000 and 2981
Alternatively, the price could consolidate within the range, with potential targets of 3057, 3033, and 3013, reflecting a phase of consolidation following the sharp decline and liquidation.

BUY GOLD 10 JUNE its showing a good upward momentum BUY GOLD 10 JUNE its showing a good upward momentum
with strong double confermation it will go up
first one technically showing a strong trendline faceing
secondly its faceing a stong support
volumes are also down
its a good one for buy
BUY GOLD 10 JUNE its showing a good upward momentum
with strong double confermation it will go up
first one technically showing a strong trendline faceing
secondly its faceing a stong support
volumes are also down
its a good one for buy

GOLD 4RR Best tradeGold 4 R:R trade
1. Strond support (1956-1951)
2. Strong Resistance (1974-1984)
3. USD is becoming weaker because of poor economical events.
4. 200 EMA is below the price on daily basis
5. proper price action we can see on gold
disclaimer: This Analysis is only for (09Jun -17Jun)

GOLD MCXGold has possibly completed its complex correction in wave II and now it looks like wave III is unfolding, today it has given breakout from the down sloping resistance trendline, along with macd positive crossover and uptick in daily time frame, other indicators are also giving positive signs of uptrend at breakout point, as wave III unfolds, gold can possibly rise higher towards 52000 and more, one can go long at these levels or in dips ( if any ) with key levels mentioned on chart.
wave struchture could be like this
key levels are mentioned on chart
macd in weekly
macd in daily
ready to bbc
rsi in daily uptick and ready to cross above 60 levels
dmi adx positive ungali
Disclaimer
I am not sebi registered analyst
My studies are for educational purpose only
Consult your financial advisor before trading or investing

GOLD BULLISH SETUPBuy gold above 47600
Target 1- 47850
Target 2- 48000
Target 3- 48400
Stoploss- 47350 (Closing Basis)

GOLD Previous Rejection Line Taking SupportAs per my last week idea, there was a strong rejection zone formed on the upside. In the last trading sesssion we saw GOLD break the drawn Rejection line with a small breakout above into our accumulation zone.
Currently, GOLD has taken support along the previous rejection line.
