Gold (XAUUSD) ABCD Completion Near 5000 – Major Sell Zone Ahead
Gold has been in a strong long-term bullish trend, driven by macro uncertainty and persistent demand. However, from a structural and harmonic perspective, price is now approaching a critical long-term resistance zone near the 5000 level, where a bearish ABCD pattern is nearing completion.
The current rally appears to be the final leg (CD) of the ABCD structure. Completion around the psychological 5000 round number also aligns with historical extension behavior and potential exhaustion after an extended impulsive move.
Primary Scenario:
Watch for price rejection, reversal patterns, or bearish confirmation near the 5000 region.
A confirmed rejection could open the door for a long-term corrective move, potentially targeting the previous demand / consolidation zone.
Invalidation:
A strong acceptance and sustained close well above 5000 would invalidate the bearish ABCD outlook and suggest continuation higher.
Goldshort

Gold Trapped in Liquidity Range – Expansion PendingGold is currently trading in a post-impulse environment after completing a clear Elliott Wave advance. With the higher-timeframe impulse exhausted, price action has transitioned into a controlled consolidation driven by liquidity, rather than trend continuation.
At this stage, the market is not trending — it is preparing.
Market Structure & Liquidity Context
Price is now boxed between a well-defined Equal High and Equal Low, forming a classic liquidity range. This structure suggests that Smart Money is engineering both sides of liquidity before committing to the next directional move.
The upper range aligns with premium pricing, where buy-side liquidity is resting.
The lower range sits in discount territory, overlapping with higher-timeframe demand.
This environment favors rotation and stop-hunt behavior, not impulsive expansion.
Key Trading Scenarios
🔴 Sell reaction at the highs
If price pushes above the Equal High and taps into the 4688–4690 premium zone , this area is expected to attract sell-side interest. A clear rejection or hesitation here would signal that buy-side liquidity has been taken, opening the door for a rotation back into the range.
🟢 Buy reaction at the lows
If price drops and reaches the 4388–4390 discount zone , this level becomes a key area to watch for support. Strong rejection or stabilization would suggest Smart Money defense, favoring a bounce back toward equilibrium.
Expectation & Bias
This is a rotation market, not a trend market.
Directional continuation should only be expected after a clear break and acceptance outside the range.
Until then:
Patience > prediction
Liquidity > indicators
Reaction > anticipation
Let price show its hand.
💬 Do you expect expansion to come from the highs or the lows first?
Your perspective matters — share your view.

XAUUSD No breakout today, only liquidity and structure🟡 XAUUSD – Intraday Smart Money Plan
📈 Market Context
Gold remains structurally bullish on the higher timeframe (HTF), but intraday price action is currently transitioning into a controlled corrective phase after buy-side liquidity has already been delivered.
With ongoing USD volatility, U.S. yield fluctuations, and Fed rate-cut speculation, Smart Money is not pushing aggressive continuation today. Instead, price is being engineered around premium and discount liquidity zones.
Ahead of U.S. macro events, Gold is behaving typically near extremes:
inducement → liquidity sweep → mean reversion, rather than impulsive trend extension.
🔎 Technical Framework – Smart Money Structure (H1–M15)
Current Phase:
HTF bullish bias remains intact, while intraday structure shows rotation and consolidation following the completion of buy-side liquidity grabs.
Key Idea:
• Look for short opportunities from premium supply
• Or long re-entries from discount demand aligned with the higher-timeframe trend
Structural Notes:
• HTF BOS confirms bullish dominance
• Buy-side liquidity already taken
• Price is rotating, not expanding impulsively
• Internal FVG acting as a downside magnet
• Discount demand aligns with prior order block (OB) support
💧 Liquidity Zones & Trade Ideas
🔴 SELL GOLD 4618 – 4620 | SL 4628
🟢 BUY GOLD 4578 – 4576 | SL 4568
🧠 Institutional Flow Expectation
Liquidity sweep → MSS / CHoCH → BOS → displacement → OB/FVG retest → expansion
🎯 Execution Rules
🔴 SELL GOLD 4618 – 4620 | SL 4628
Entry Conditions:
✔ Price taps premium supply
✔ Buy-side liquidity taken above recent highs
✔ Bearish MSS / CHoCH on M5–M15
✔ Clear downside BOS
✔ Entry via bearish FVG or supply OB
Targets:
• 4595 — internal reaction
• 4578 — liquidity pool
• Trail aggressively (distribution setup)
🟢 BUY GOLD 4578 – 4576 | SL 4568
Entry Conditions:
✔ Liquidity sweep into discount demand
✔ Confluence with OB + FVG
✔ Bullish MSS / CHoCH on M5–M15
✔ Strong upside BOS with displacement
✔ Entry via refined bullish order block
Targets:
• 4618 – 4620 — first reaction
• 4670 — internal liquidity
• 4700+ — continuation if expansion resumes
⚠️ Risk Notes
• Premium zones are liquidity traps
• Expect fake breaks during news volatility
• No entry without MSS + BOS confirmation
• Reduce position size near extremes
📍 Summary
Gold remains bullish by structure, but today is about execution, not prediction:
• 4618 – 4620 may offer a Smart Money distribution short
• 4578 – 4576 is the key discount zone for long reloads

Gold isn’t trending today — it’s rotating to engineer liquidity.🟡 XAUUSD – Intraday Smart Money Trading Plan
📈 Market Context
Gold remains structurally bullish on the higher timeframes, following a strong expansion into previous highs. However, today’s price action is not impulsive. Momentum has slowed, and the market is transitioning into a rotation and rebalancing phase.
With USD volatility, shifting Treasury yields, and ongoing rate-cut speculation, Smart Money is no longer chasing price. Instead, liquidity is being manufactured between premium and discount zones through inducement, stop hunts, and controlled pullbacks.
Today is about execution, not prediction.
🔎 Technical Framework – Smart Money Structure (H1–M15)
Market Phase:
HTF bias: Bullish (BOS confirmed)
Intraday: Corrective rotation after buy-side liquidity delivery
Key Observations:
Buy-side liquidity has already been taken
Price is rotating, not expanding impulsively
Internal FVG acts as a downside magnet
Discount demand aligns with HTF EMA + order blocks
💧 Liquidity Zones & Trade Scenarios
🔴 SELL XAUUSD 4643 | SL 4648
Narrative: Premium Distribution
Price may retrace into a premium zone where Smart Money looks to distribute positions after inducing late buyers.
Entry Conditions:
✔ Price taps the 4643 premium zone
✔ Liquidity sweep above recent highs
✔ Bearish MSS / CHoCH on M5–M15
✔ Clear downside BOS
✔ Entry via bearish FVG or supply OB
Targets:
4610 — internal reaction
4585 — main liquidity pool
Trail aggressively (distribution setup)
🟢 BUY XAUUSD 4580 | SL 4574
Narrative: Discount Accumulation
A deeper pullback into discount may be used to reload long positions before the next expansion phase.
Entry Conditions:
✔ Sell-side liquidity sweep into 4580
✔ Confluence with discount zone + OB + FVG
✔ Bullish MSS / CHoCH on M5–M15
✔ Strong upside BOS with displacement
✔ Entry via refined bullish order block
Targets:
4620 — first reaction
4680 — internal liquidity
4720+ — ATH continuation if expansion resumes
🧠 Expected Institutional Flow
Liquidity sweep → MSS / CHoCH → BOS → Displacement → OB/FVG retest → Expansion
No sweep → no trade
No structure → no entry
⚠️ Risk Management Notes
Highs are liquidity traps, not breakout zones
Expect false breaks during news volatility
No entry without confirmation (MSS + BOS)
Reduce size near premium extremes
📍 Summary
Gold is bullish by structure, but today’s movement is rotational:
4643 may deliver a Smart Money sell
4580 may reload longs for the next push higher
Let liquidity move first.
Let structure confirm second.
Smart Money controls the game. ⚡️

XAUUSD (Gold) | BULL VS BEAR | Technical Level Gold (XAUUSD) | Strategy: Buy on Dip & Breakdown Trade | Timeframe: Intraday
Buy on Dip Strategy (Trend-Following)
* Trade Type: Buy Stop
* Entry: 4,603
* Target 1: 4,616
* Target 2: 4,632
* Stop Loss: 4,588
View:
* This setup aligns with the higher-timeframe bullish trend. Buying above 4,600 indicates continuation strength, targeting recent resistance zones. Ideal if price holds above the intraday pivot.
Breakdown Strategy (Risk-Off Move)
Trade Type: Sell Stop
* Entry: 4,586
* Target 1: 4,574
* Target 2: 4,566
* Stop Loss: 4,601
View:
This trade activates only if key support breaks, signaling short-term bearish momentum and profit booking. Suitable during USD strength or sudden risk-off sentiment.

XAUUSD (Gold) TECHNICAL OUTLOOK | 6th Jan'2026Gold is trading near 4,450, consolidating after a strong bullish rally. Price remains well above key moving averages, keeping the overall trend firmly bullish across intraday to higher timeframes.
Bullish View:
As long as gold holds above 4,445–4,450, upside momentum remains intact. A move above 4,470 can push prices toward 4,490 and 4,505–4,515, with 4,550 as a major resistance zone.
Bearish View:
A break below 4,445 may trigger a short-term pullback toward 4,430 and 4,410–4,395. Unless these levels break decisively, dips are likely corrective.
Intraday Focus:
Prefer buy-on-dips near support, while watching 4,500–4,515 for possible rejection.
Conclusion:
Trend remains strongly bullish. Expect volatility, but bias favors buyers unless key supports fail.

XAU/USD – Major Key Levels (Bullish vs Bearish)🟢 Bullish Key Levels
Major Support / Trend Hold: $4,505 – $4,500
Immediate Resistance: $4,538
Major Breakout Level: $4,550
Upside Targets: $4,580 → $4,612
🔴 Bearish Key Levels
Breakdown Level: $4,500
Support 1: $4,477
Support 2: $4,460
Major Demand Zone: $4,430 – $4,390
Above $4,500 bias remains bullish; below $4,500 short-term bearish pullback possible.

Gold 1H – CPI Ambiguity Sets Liquidity Traps Near 4400🟡 XAUUSD – Intraday Smart Money Plan | by Ryan_TitanTrader (22/12)
📈 Market Context
Gold is trading near the upper boundary of a well-defined bullish channel as markets react to renewed uncertainty surrounding U.S. inflation data and the Fed’s policy outlook.
Recent CPI-related commentary has reignited debate over whether inflation is cooling fast enough to justify near-term easing, keeping USD flows unstable and risk sentiment mixed.
This macro backdrop favors liquidity engineering over clean continuation, with Smart Money likely targeting both premium and discount extremes to induce breakout traders before the next directional expansion.
🔎 Technical Framework – Smart Money Structure (1H)
Current Phase: Bullish structure approaching premium exhaustion
Key Idea: Expect liquidity interaction at 4400–4402 (premium) or 4340–4338 (discount) before meaningful displacement
Structural Notes:
• Higher-timeframe bullish BOS remains valid
• Price is pressing into buy-side liquidity near channel highs
• Clear impulsive leg up created an unmitigated FVG above 4370
• Rising structure shows signs of short-term distribution, not confirmed reversal
• Liquidity rests clearly above 4400 and below 4340
Liquidity Zones & Triggers:
• 🔴 SELL GOLD 4400 – 4402 | SL 4410
• 🟢 BUY GOLD 4340 – 4338 | SL 4330
🧠 Institutional Flow Expectation:
Liquidity sweep → MSS / CHoCH → BOS → displacement → FVG / OB retest → expansion
🎯 Execution Rules (matching your exact zones)
🔴 SELL GOLD 4400 – 4402 | SL 4410
Rules:
✔ Sweep above psychological 4400 buy-side liquidity
✔ Bearish MSS / CHoCH on M5–M15
✔ Clear downside BOS with impulsive displacement
✔ Entry via bearish FVG refill or refined supply OB
Targets:
1. 4370
2. 4350
3. 4340 – extension if USD strengthens on CPI reassessment
🟢 BUY GOLD 4340 – 4338 | SL 4330
Rules:
✔ Liquidity grab into discount and channel support
✔ Bullish MSS / CHoCH confirms demand control
✔ Upside BOS with strong bullish displacement
✔ Entry via bullish FVG fill or demand OB retest
Targets:
1. 4360
2. 4385
3. 4400 – extension if USD weakens amid CPI doubt
⚠️ Risk Notes
• CPI-driven uncertainty increases fake breakouts
• No entry without MSS + BOS confirmation
• Expect volatility during U.S. session
• Reduce risk around unexpected Fed or inflation headlines
📍 Summary
Gold is trading at a decisive premium within a bullish structure, but CPI ambiguity keeps conviction fragile. Smart Money is likely to engineer liquidity at the extremes before committing:
• A sweep above 4400 may fade toward 4350–4340, or
• A liquidity grab near 4340 could reload bullish flow toward 4385–4400+
Let structure confirm — Smart Money reacts, retail anticipates. ⚡️
📌 Follow @Ryan_TitanTrader for daily Smart Money gold breakdowns.

Gold 1H – Will 4232 Liquidity Trigger Reversal or 4188 Hold Flow🟡 XAUUSD – Intraday Smart Money Plan | by Ryan_TitanTrader (10/12)
📈 Market Context
Gold trades inside a politically-driven liquidity landscape after former U.S. President Donald Trump signaled that rate-cut willingness will be his litmus test for selecting a new Fed Chair.
This comment injects uncertainty into interest-rate expectations, making markets sensitive to any shifts in forward guidance.
Higher-for-longer fears remain intact intraday, keeping gold capped below premium zones while liquidity builds on both edges.
On H1, price is compressing around mid-range with clean liquidity resting at 4232 above and 4188–4190 below—ideal sweep conditions before institutions commit to direction.
🔎 Technical Framework – Smart Money Structure (1H)
Current Phase: Sideways compression after BOS + CHoCH sequence
Key Idea: Expect a sweep above 4230–4232 or below 4190–4188 before true displacement
Liquidity Zones & Triggers:
• 🔴 SELL GOLD 4230 – 4232 | SL 4240
• 🟢 BUY GOLD 4190 – 4188 | SL 4180
Institutional Flow Expectation:
sweep → MSS/CHoCH → BOS → displacement → FVG/OB retest → expansion
🎯 Execution Rules (matching your exact zones)
🔴 SELL GOLD 4230 – 4232 | SL 4240
Rules:
✔ Price sweeps the liquidity cluster above 4230
✔ Bearish MSS/CHoCH on M5–M15
✔ Downside BOS + clean bearish displacement
✔ Entry via FVG refill or refined OB retest
Targets:
1. 4212
2. 4200
3. 4190
🟢 BUY GOLD 4190 – 4188 | SL 4180
Rules:
✔ Liquidity grab under 4190–4188
✔ Bullish MSS/CHoCH confirms demand takeover
✔ Upside BOS + impulsive displacement from discount
✔ Entry via bullish FVG fill or demand OB retest
Targets:
1. 4205
2. 4220
3. 4230–4232
⚠️ Risk Notes
• Trump’s remarks may spark abrupt shifts in expectations → avoid entries without BOS + displacement
• Don’t chase candles inside the compression channel
• SL placement must respect structural invalidation
• Reduce exposure if volatility spikes during Fed-related headlines
📍 Summary
Today’s play revolves around two liquidity-driven scenarios:
• A 4232 sweep triggers bearish structure, delivering into 4200 → 4190
or
• A 4188 liquidity grab forms bullish MSS, expanding toward 4220 → 4232
Let structure confirm—SMC is reaction, not prediction. ⚡️
📌 Follow @Ryan_TitanTrader for more Smart Money breakdowns.

XAUUSD Short | 15m |Gold revisited the upper band of the intraday structure and showed clear signs of weakening momentum. Price failed to sustain above the model’s trailing zone, indicating a shift from short-term accumulation to distribution.
The short entry was executed as price broke back below the cloud, supported by a clean loss of intrabalance strength.
Stop is placed above the most recent structural failure.
Primary target sits near the liquidity cluster around 4175.

Gold 1H – Will 4210 Reject Again or 4166 Ignite the Rally?🟡 XAUUSD – Intraday Smart Money Plan | by Ryan_TitanTrader (09/12)
📈 Market Context
Gold continues to soften under $4,200 as rising US Treasury yields pressure bullion, with markets positioning ahead of the upcoming Federal Reserve rate decision.
According to FXStreet, yields climbing intraday are capping gold’s upside, and sellers remain active below 4200 while participants wait for clarity on the Fed’s forward guidance.
This environment builds a liquidity-sensitive landscape, where institutions may engineer sweeps on both sides before committing to direction.
On H1, price oscillates cleanly between premium supply (4208–4210) and discount demand (4168–4166).
A valid push requires MSS → BOS → displacement from either extreme.
🔎 Technical Framework – Smart Money Structure (1H)
Current Phase: Sideways compression after consecutive CHoCH shifts
Key Idea: Expect liquidity grabs above 4210 or under 4166 before real movement
Liquidity Zones & Triggers
• 🔴 SELL GOLD 4208 – 4210 | SL 4218
• 🟢 BUY GOLD 4168 – 4166 | SL 4158
Institutional Flow Expectation:
sweep → MSS/CHoCH → BOS → displacement → FVG/OB retest → expansion
🎯 Execution Rules (matching your exact zones)
🔴 SELL GOLD 4208 – 4210 | SL 4218
Rules:
✔ Price taps premium zone (4208–4210)
✔ Bearish MSS/CHoCH confirmed on M5–M15
✔ Strong downside BOS + displacement
✔ Enter on FVG fill or refined supply OB retest
Targets:
1. 4185
2. 4175
3. 4168 – 4166
🟢 BUY GOLD 4168 – 4166 | SL 4158
Rules:
✔ Sweep under 4167 to collect sell-side liquidity
✔ Bullish MSS/CHoCH forms from discount
✔ Clean BOS + impulsive displacement upward
✔ Entry via bullish FVG fill or demand OB retest
Targets:
1. 4184
2. 4200
3. 4210
⚠️ Risk Notes
• Rising yields may generate deceptive spikes—avoid entries without BOS + displacement
• Do not chase price inside the compression range
• Keep SLs at structural invalidation, not arbitrary points
• Reduce exposure ahead of Fed-related volatility this week
📍 Summary
Today’s setup revolves around two institutional scenarios:
• A 4210 liquidity sweep triggers bearish structure → downside delivery toward 4166
or
• A 4166 liquidity grab forms bullish MSS → upside expansion back toward 4210
Let structure confirm.
Patience pays the trader—SMC reacts, never predicts. ⚡️
📌 Follow @Ryan_TitanTrader for daily Smart Money breakdowns.

Gold 1H – Will 4232 Trap Liquidity or 4170 Spark Expansion?🟡 XAUUSD – Intraday Smart Money Plan | by Ryan_TitanTrader (08/12)
📈 Market Context
Gold trades inside politically-driven liquidity as Donald Trump signals that the current method of tariffing through the US Supreme Court is “more direct, less cumbersome, and much faster.”
This introduces fresh uncertainty for USD flows, increasing short-term volatility across commodities.
Expect engineered sweeps on both sides as institutions react to policy-sensitive sentiment shifts.
On H1, price compresses between premium supply (4230–4232) and discount demand (4170–4168).
A confirmed MSS + BOS + displacement is required before any directional leg becomes valid.
🔎 Technical Framework – Smart Money Structure (1H)
Current Phase: Liquidity-rich compression inside a minor bullish channel
Key Idea: Sweeps first, real move later
Liquidity Zones & Triggers
• 🔴 SELL GOLD 4230 – 4232 | SL 4240
• 🟢 BUY GOLD 4172 – 4170 | SL 4162
Bias shifts only via structural break + clean displacement.
Expected Institutional Sequence:
sweep → MSS/CHoCH → BOS → displacement → FVG/OB retest → expansion
🎯 Execution Rules (matching your exact zones)
🔴 SELL GOLD 4230 – 4232 | SL 4240
Rules:
✔ Price taps 4231–4232 → bearish MSS/CHoCH on M5–M15
✔ BOS down + strong displacement candle
✔ Entry on bearish FVG fill / supply OB retest
Targets:
1. 4200
2. 4185
3. 4170
🟢 BUY GOLD 4172 – 4170 | SL 4162
Rules:
✔ Sweep below 4169 → bullish MSS/CHoCH
✔ BOS up + displacement from discount
✔ Entry on FVG fill or refined OB retest
Targets:
1. 4186
2. 4210
3. 4230 – 4232
⚠️ Risk Notes
• Headlines may induce fake sweeps; do not pre-commit without BOS + displacement
• No averaging inside compression
• SLs must sit at structural invalidation
• Reduce risk during tariff-related spikes
📍 Summary
Today’s playbook offers two institutional paths:
• 4231 sweep → bearish MSS → BOS → retest → delivery into 4170
or
• 4169 sweep → bullish MSS → BOS → retest → expansion back toward 4230+
Trade confirmations only.
Let gold show its hand — patience is your edge. ⚡️
📌 Follow @Ryan_TitanTrader for daily Smart Money breakdowns.

U.S. data storm ahead – Gold awaits its next breakout🟡 XAU/USD – Timing Reversal at 4188, FVG Retest Expected
🔍 Market Context
Gold is approaching a key timing zone near 4188–4190, which aligns with previous supply and structural rejection.
After a strong impulsive leg, liquidity resting above recent highs may be targeted before a deeper pullback into the Fair Value Gap (FVG) zone.
The structure remains bullish in the medium term, but short-term corrective moves are expected before continuation toward the 4212 liquidity objective.
📈 Key Trading Zones
🔻 SELL Setup
Entry: 4188 – 4190
Stop Loss: 4192
Target 1: 4090
Target 2: 4020
Expect rejection at timing zone — short-term bearish retracement into FVG.
🟢 BUY Setups
BUY GOLD 4090 – 4088 | SL 4085
→ Scalp long targeting 4140–4160 if price reacts strongly within FVG.
BUY GOLD 4022 – 4020 | SL 4017
→ Ideal deeper retracement buy zone aligning with structural liquidity & prior demand.
🧠 Trading Plan Logic
Wait for price sweep & rejection at 4188–4190 before confirming short.
Monitor FVG zone (~4090) for reaction to flip back long.
The higher-timeframe target sits near 4212, aligning with liquidity above prior highs.
⚙️ Bias
Short-term: Bearish correction from 4190 toward 4090.
Medium-term: Bullish continuation toward 4212 after retracement.

Gold Awaits PPI & GDP – Buy Dips, Sell Rallies🟡 XAU/USD – PPI & GDP Data to Define Range Expansion
🔍 Market Context
Gold remains range-bound between $4000–$4100, consolidating after last week’s liquidity sweep.
This week’s key U.S. data — Core PPI, Retail Sales, GDP, and Core PCE — will likely dictate the next major move.
Slight improvement in inflation and consumption data could strengthen the USD temporarily, but overall bias remains bullish mid-term as the Fed is expected to maintain a dovish stance into Q1.
📊 Technical Outlook (4H Chart)
Main Sell Zone (Super OB): 4170–4200 → potential reversal supply zone.
Fair Value Gap (FVG): 4130–4160 → short-term reaction zone if price retraces.
Sell Zone: 4090–4095 → short opportunity aligned with intraday bearish structure.
Buy Zone 1: 4024–4025 → minor demand, expecting internal liquidity sweep.
Buy Zone 2 (Main OB): 4003–4001 → strong order block with multiple rejections; key liquidity pool.
Structure: H4 BOS (Bullish) intact, suggesting a liquidity sweep before next expansion upward.
🎯 Trade Plan
1️⃣ SELL Setup – Short-term reaction from FVG
Entry: 4090–4095
Stop Loss: 4100
Take Profit 1: 4055
Take Profit 2: 4040
Take Profit 3: 4025
➡️ Reasoning: Price is likely to tap the lower edge of FVG and sweep local liquidity before a downside reaction toward internal range demand.
2️⃣ BUY Setup – First demand zone test
Entry: 4024–4025
Stop Loss: 4022
Take Profit 1: 4065
Take Profit 2: 4080
➡️ Reasoning: Expecting a short-term liquidity grab below the mid-range before bullish continuation.
3️⃣ BUY Setup – Main OB accumulation zone
Entry: 4003–4001
Stop Loss: 3998
Take Profit 1: 4045
Take Profit 2: 4075
Take Profit 3: 4090
➡️ Reasoning: Deep liquidity zone aligning with higher-timeframe OB. If macro data disappoints, this area can trigger the next impulsive leg to retest 4170+.
🧭 Overall Bias
→ Ranging bias before Core PCE
→ Buy dips – Sell rallies within 4000–4100 until a clear breakout post-GDP/PCE data.
→ Watch for false breakouts around FVG and maintain risk control before U.S. session releases.

XAUUSD – Reading the Market’s Secret IntentionsH1 Outlook – 24 November 2025
🌐 MARKET CONTEXT
Gold enters the new week with a controlled, slow-paced volatility environment, as the market continues to balance between inflation expectations, shifting USD flows, and cautious positioning ahead of major U.S. data.
Recently, price has shown repeated rejection from premium zones, forming a mild bearish intraday bias across the H1 structure. The market is still operating inside a liquidity-rich environment where institutions are engineering both upside and downside sweeps before choosing a clear direction.
Recent Drivers
USD holds moderate strength after last week’s hawkish Fed commentary
Market remains in “wait-and-watch” mode ahead of mid-week data
No strong risk-off sentiment → gold lacks solid fundamental support
Session Expectations
London: Early liquidity sweeps above premium levels expected
New York: Higher probability of real trend expansion
Bias: Mild bearish unless deep discount zones trigger CHoCH on H1
Price is currently mid-range → only extreme liquidity areas provide safe, high-probability setups.
📉 TECHNICAL ANALYSIS (SMC + LIQUIDITY)
Market Structure
H1 structure forming: Lower Highs → Lower Lows
Equilibrium zone: 4070–4090
Strong inducement layers above 4146 and 4071
Liquidity Map
Buy-side Liquidity (BSL): Above 4146, 4071
Sell-side Liquidity (SSL): Below 4030 and 3994
Market forming engineered wicks at both ends → ideal for SMC traders
Imbalance Zones
Bearish FVG: 4146–4148 → prime area for premium sells
Minor Imbalance: 4068–4071 → intraday scalp reversal potential
Discount Imbalances: 4032 and 3996 → clean reaction zones for buys
🔑 KEY PRICE ZONES
(Clear explanations linked directly to your entries)
4148–4146 ▶️ Premium Sell Zone – High Manipulation Area
Unmitigated supply zone + major BSL buildup.
Smart money usually induces breakout buyers here before reversing sharply.
4068–4071 ▶️ Secondary Premium Pool – Scalp Rejection
A mini-liquidity pocket above equilibrium.
Perfect for quick stop-hunt sweeps during London session.
4032–4030 ▶️ Discount Reaction Zone – Strong Scalping Demand
A small OB + SSL cluster.
Expect fast, technical bounces with low drawdown.
3996–3994 ▶️ Deep Discount Zone – High-Value Reversal
Highly reactive zone where institutions accumulate long positions.
A strong candidate for structural shifts if tapped.
⚙️ TRADE SETUPS (SMC-Driven Execution)
✔️ SELL SETUP 1 – Premium Rejection
Entry: 4148–4146
Stoploss: 4154
TP1: 4135
TP2: 4120
TP3: 4090
Logic: Sweep of BSL + FVG fill → high confidence bearish rejection.
✔️ SELL SETUP 2 – Intraday Scalp Sell
Entry: 4068–4071
Stoploss: 4077
TP1: 4055
TP2: 4043
TP3: 4032
Logic: Engineered liquidity sweep above mid-range → fast downside move.
✔️ BUY SETUP 1 – Scalping Rebound
Entry: 4032–4030
Stoploss: 4024
TP1: 4048
TP2: 4068
Logic: SSL sweep → immediate bounce expected from discount zone.
✔️ BUY SETUP 2 – Deep Discount Buy
Entry: 3996–3994
Stoploss: 3988
TP1: 4010
TP2: 4035
TP3: 4068
Logic: A strong institutional accumulation area → ideal for reversal setups.
🧠 SESSION PLAN & NOTES
Do not trade inside the mid-range
Stick strictly to liquidity extremes for precision entries
Expect London fake-outs → wait for confirmation
NY session more likely to deliver the real move
Use M5/M15 CHoCH + displacement for entry confirmation
🏁 CONCLUSION
XAUUSD is currently holding a mild bearish structure on H1, with premium zones at 4146 and 4071 offering the best sell opportunities.
Discount areas at 4030 and 3994 remain the highest-probability zones for intraday reversals or continuation buys.
Trade with patience. Let the liquidity traps form—then strike with precision.

Gold Nonfarm: Buy OB 4030, Target Break 4111🔍 Market Context – November 20, 2025
Gold initially dropped nearly 70 pips at the start of the day but quickly rebounded sharply from the 4030–4032 zone, demonstrating strong buying pressure and a refusal to decline further.
The market structure on the H1–H2 timeframe is forming a classic, well-defined Inverse Head & Shoulders pattern—a quintessential bullish reversal pattern—signaling a potential upward expansion if the neckline is successfully broken.
📅 Key News Events Today:
🇺🇸 Non-Farm Payrolls (NFP)
📉 US Unemployment Rate
🏛 FOMC Meeting Minutes
🗣 Speeches by Trump, Barkin, Williams
🧾 Initial Jobless Claims
⚠️ These events could trigger sharp volatility and will determine the confirmation or rejection of the reversal pattern.
📊 Technical Analysis
🛒 BUY SETUP – Primary Priority
✅ Entry: 4030 – 4032
🛡 Stop Loss (SL): 4027
🎯 Take Profit (TP):
TP1: 4039
TP2: 4047
TP3: 4059
💡 Rationale: Price bounced strongly at the OB + SSS zone. This is a crucial technical support area and the base of the Inverse H&S pattern. The objective is to break the neckline to trigger the uptrend.
🔻 SELL SETUP – Short-Term Strategy
📍 Entry: 4093 – 4095
🛡 SL: 4098
🎯 TP:
TP1: 4088
TP2: 4077
TP3: 4060
TP4: 4033
💡 Rationale: This strategy is only applicable if the price forms a false breakout of the BSL zone and reverses. This is an ideal entry point for quick scalping if the market reacts negatively to the news.
🔑 Key Price Zones
Buy Zone (OB + SSS): 4030 – 4032
→ Strong demand zone, the base of the Inverse Head & Shoulders pattern, confirming the reversal signal if held.
Breakout Neckline Zone: 4101 – 4111
→ The neckline of the Inverse H&S pattern. Breaking this zone will open up opportunities for a sharp rise.
Final Resistance Zone: 4133 – 4140
→ The final target if the breakout is successful and the bullish pattern is confirmed.
✅ Strategy Conclusion
🎯 Main Strategy: Priority is to BUY in the OB zone 4030–4032.
🩸 SELL is only for short-term scalping if there is a signal of rejection at the BSL zone.
🕓 Caution: Be careful entering trades near the Nonfarm news release time—wait for price action to confirm the direction.

XAUUSD – Where Smart Money Strikes Today🌐 MARKET CONTEXT
Gold enters today’s session after a period of controlled volatility, with price repeatedly reacting around key liquidity pockets but failing to produce a clean breakout. The M30 structure remains bearish, with price rejecting premium levels and forming consistent lower highs.
Recent Drivers
USD stays firm as markets maintain expectations of a slightly hawkish Federal Reserve
Traders await upcoming mid-week data → low conviction, cautious positioning
Overall sentiment remains neutral — no strong safe-haven pressures
Session Outlook
London Session: Likely to engineer early sweeps into premium supply zones
New York Session: Higher chance of real directional expansion
Bias: Bearish intraday until discount zones trigger a CHoCH (shift of character)
Price is currently inside mid-range, so the safest setups remain at extremes where liquidity is concentrated.
📉 TECHNICAL ANALYSIS (SMC + LIQUIDITY)
Market Structure
M30 Trend: Lower High → Lower Low sequence
Equilibrium zone: 4068–4085
Inducement layers resting above 4147 and 4081
Liquidity Levels
BSL: Above 4147 & 4081
SSL: Below 4033 & deep liquidity at 3993
Market continues printing engineered wicks, trapping impulsive traders
Imbalances
Bearish FVG: 4147–4148 → perfect for premium scalp sells
Minor imbalance: 4081
Discount inefficiencies near 4033 and 3993 → ideal buy setups
🔑 KEY PRICE ZONES (Strong Logic + Clear Explanation)
4148–4147 ▶️ Premium Liquidity Trap – High-Quality Sell Zone
This area holds an unmitigated bearish order block combined with buy-side liquidity.
Smart Money typically uses this zone to trap breakout buyers before reversing sharply.
4079–4081 ▶️ Secondary Premium Sweep Zone – Fast Rejection Expected
A mini liquidity pool just above equilibrium, designed for early-session stop hunts.
Often triggers sharp intraday reversals.
4035–4033 ▶️ Discount Reaction Zone – Clean Scalping Demand
This zone holds micro-demand + SSL resting below.
Expect low-drawdown reactions ideal for quick intraday buys.
3995–3993 ▶️ Deep Discount Liquidity Pool – High-Probability Reversal Base
A rich accumulation of Sell-Side Liquidity combined with HTF discount structure.
Strong reversal potential if price reaches this level.
⚙️ TRADE SETUPS (High-Precision SMC Execution)
✔️ SELL SETUP 1 – Premium Rejection Sell
Entry: 4148–4147
Stoploss: 4126
TP1: 4135
TP2: 4120
TP3: 4085
Logic: BSL sweep + bearish imbalance fill → sharp sell-off expected.
✔️ SELL SETUP 2 – Mid-Range Liquidity Sweep
Entry: 4079–4081
Stoploss: 4087
TP1: 4065
TP2: 4048
TP3: 4033
Logic: Quick liquidity hunt above equilibrium followed by displacement.
✔️ BUY SETUP 1 – Intraday Scalping Rebound
Entry: 4035–4033
Stoploss: 4027
TP1: 4048
TP2: 4070
Logic: SSL sweep → micro CHoCH → ideal for fast bullish reaction.
✔️ BUY SETUP 2 – Deep Discount Reversal
Entry: 3995–3993
Stoploss: 3987
TP1: 4010
TP2: 4040
TP3: 4070
Logic: Major discount zone + liquidity buildup → strong reversal potential.
🧠 NOTES / SESSION PLAN
Avoid mid-range trading — only trade at liquidity extremities
Expect London fake-outs; real movement likely in NY
Always wait for M5/M15 confirmation (CHoCH + BOS)
Avoid buying in premium areas; avoid selling in deep discount zones
Follow strict risk management — volatility may spike unexpectedly
🏁 CONCLUSION
Gold continues to hold a bearish intraday structure, favouring premium sell setups at 4147 and 4081.
Discount zones at 4033 and 3993 offer high-probability buy reactions and possible deeper reversals.
Trade with patience. Execute only at liquidity extremes.
Let Smart Money show its trap — then strike with precision.

XAUUSD – Battle Zones of the Day🌐 MARKET CONTEXT
Gold enters today’s session after a period of compressed volatility, where price tapped both buy-side and sell-side liquidity several times without forming a decisive trend. On the M30 chart, the intraday structure remains bearish, with price consistently rejecting premium levels and forming lower highs.
Recent Catalysts:
USD holds mild strength following a slightly hawkish tone from the Federal Reserve
Market is awaiting mid-week economic releases → leading to a cautious sentiment
Risk appetite remains neutral with no strong safe-haven flows
Session Expectations:
London Session: Likely to generate early liquidity sweeps towards premium zones
New York Session: Higher probability of seeing genuine directional expansion
Bias: Bearish intraday unless price reaches discount zones and forms a CHoCH
Price is currently trading within mid-range levels, making the extreme liquidity zones the safest points for execution.
📉 TECHNICAL ANALYSIS (SMC + LIQUIDITY STRUCTURE)
Market Structure
M30 structure: Lower Highs → Lower Lows
Equilibrium zone: 4075–4085
Inducement layers accumulating above 4147 and 4070
Liquidity
BSL: Above 4147 & 4070
SSL: Below 4033 and the deeper pocket at 3993
Market forming engineered liquidity wicks on both sides
Imbalance Zones
Bearish FVG: 4147–4148 → strong scalp sell zone
Minor imbalance: 4070–4071
Discount imbalances: 4033 and 3993 support buy setups
🔑 KEY PRICE ZONES (Clear & Attractive Explanations)
4148–4147 → Premium Liquidity Trap – Ideal Scalp Sell
A premium zone combining an unmitigated bearish order block and BSL inducement.
This area often triggers breakout buyers before institutions reverse the move.
4071–4070 → Secondary Premium Liquidity – Fast Rejection Zone
A small liquidity pool above equilibrium designed to sweep early highs before price turns bearish again.
4035–4033 → Discount Reaction Zone – Scalping Demand
A micro order block aligned with a cluster of sell-side liquidity.
Provides clean, low-drawdown intraday rebounds.
3995–3993 → Deep Discount Liquidity Pool – High-Value Reversal Zone
A major liquidity pocket aligned with higher-timeframe discounts.
If price reaches here, a strong reversal is highly probable.
⚙️ TRADE SETUPS (SMC-Driven, High Precision)
✔️ SELL SETUP 1 – Premium Scalp
Entry: 4148–4147
Stop-loss: 4126
Targets: 4135 → 4120 → 4085
Logic: BSL sweep + FVG fill leading to strong bearish rejection.
✔️ SELL SETUP 2 – Mid-Range Liquidity Sweep
Entry: 4071–4070
Stop-loss: 4077
Targets: 4058 → 4043 → 4033
Logic: Sweep of mini BSL followed by downward displacement.
✔️ BUY SETUP 1 – Intraday Rebound
Entry: 4035–4033
Stop-loss: 4027
Targets: 4048 → 4070
Logic: SSL sweep with potential for a micro CHoCH → clean bounce setup.
✔️ BUY SETUP 2 – Deep Discount Reversal
Entry: 3995–3993
Stop-loss: 3987
Targets: 4010 → 4040 → 4070
Logic: Strong higher-timeframe discount zone → excellent reversal potential.
🧠 NOTES / SESSION PLAN
Avoid trading in mid-range areas — only execute at the extreme liquidity zones
Expect fake movements during London open
New York session likely provides the main trend direction
Wait for M5/M15 confirmation signals (CHoCH + BOS)
Avoid buying around premium levels to stay clear of liquidity traps
🏁 CONCLUSION
XAUUSD continues to hold a bearish intraday structure, favouring premium-zone sell opportunities at 4147 and 4070.
Discount-zone levels at 4033 and 3993 remain high-probability areas for intraday bounces or deeper reversals.
Trade only at liquidity extremes.
Be patient.
Let the market form the trap — and then strike with precision.

Gold H1 – Sideway or Preparing for a Bigger Break?🟡 XAUUSD – Intraday Smart Money Plan | by Ryan_TitanTrader (20/11)
📈 Market Context
Gold continues to move inside a tight consolidation as markets digest fresh headlines:
Treasury markets just erased hopes for a December rate cut and now even a January cut is doubtful, following hawkish tones revealed in the latest Fed minutes.
This shift reinforces USD strength in the short term and pressures gold’s bullish momentum, keeping price trapped between well-defined liquidity zones.
Key implications from the news:
• The 6-month Treasury yield jumped back to 3.83%, aligning with hawkish expectations.
• Rate-cut bets evaporating → USD stays firm, limiting gold’s upside.
• Institutions are engineering both-side liquidity sweeps ahead of upcoming Fed speakers.
• Gold is currently hovering around ~$4,070 inside a neutral zone where no clean premium/discount imbalance exists.
Until the market receives fresh macro catalysts, price is likely to sweep liquidity at the edges of the range before choosing direction.
🔎 Technical Analysis (1H / SMC Structure)
• Structure: Price remains inside a short-term sideways distribution after the recent CHoCH + BOS sequence.
• Premium Sell Zone: 4145–4147, aligning with unmitigated supply + buy-side liquidity resting above recent highs.
• Discount Buy Zone: 4004–4002, sitting inside last clean demand with previous sell-side sweep.
• Liquidity Map:
→ Buy-side liquidity: above 4145–4150 (equal-high cluster).
→ Sell-side liquidity: below 4004–3997, where earlier long positions were cleared.
🔴 Sell Setup (Premium Reaction Zone)
• Entry: 4145 – 4147
• Stop-Loss: 4155
• Take-Profit:
→ 4085 (minor imbalance)
→ 4045 (range midpoint)
→ 4004 – 4002 (discount demand)
📌 Execution rule: Wait for liquidity sweep into zone + bearish CHoCH M5–M15 before entering.
🟢 Buy Setup (Discount Reaction Zone)
• Entry: 4004 – 4002
• Stop-Loss: 3997
• Take-Profit:
→ 4040 (short-term range high)
→ 4075 (inefficiency fill)
→ 4140 (premium retest)
📌 Valid only if price sweeps the 4000–3997 liquidity pocket and shows strong bullish displacement.
⚠️ Risk Management Notes
• Expect increased volatility as markets reposition after the sharp decline in rate-cut expectations.
• Avoid trading inside the 4030–4080 chop zone unless a clear structure break occurs.
• Reduce risk size during sudden USD spikes caused by Treasury-yield moves.
• Trail stops progressively as each liquidity level is taken.
📝 Summary
Gold is currently stuck in a clean intraday range as hawkish Fed minutes remove hopes for early rate cuts, pushing USD up and holding gold below premium supply.
SMC structure favors liquidity-sweep setups at both edges:
• Sell Zone: 4145–4147 (premium supply)
• Buy Zone: 4004–4002 (discount accumulation)
Expect classic manipulation → reaction → continuation patterns until the market resolves the new macro pressure.
📍 Follow @Ryan_TitanTrader for more Smart Money updates.

GOLD H1 – Hawkish Fed Pressure Ahead of Key NFP Data🟡 XAUUSD – Intraday Smart Money Plan | by Ryan_TitanTrader (18/11)
📈 Market Context
Gold is trading inside a bearish corrective channel as markets react to hawkish Federal Reserve commentary and positioning ahead of this week’s U.S. NFP data.
• Fed officials signaled a stronger stance against premature rate cuts, keeping USD supported and limiting gold’s upside.
• Price continues to hover near $4,080, reflecting uncertainty as traders balance Fed tone with upcoming labour-market reports.
Institutional order flow shows controlled downside pressure, with engineered liquidity sweeps forming around both channel extremes.
🔎 Technical Analysis (1H / SMC Structure)
• Structure: Price remains inside a Bearish Correction Channel, creating consecutive BOS points, confirming distribution.
• Premium Sell Zone: 4107–4105 aligns with a previous mitigation block + internal liquidity.
• Discount Buy Zone: 3983–3985 sits at the lower boundary of the channel + liquidity sweep zone.
• Liquidity:
→ Buy-side liquidity above 4107 (clean equal-high pocket).
→ Sell-side liquidity resting around 3985–3976, where prior long positions were removed.
🔴 Sell Setup (Premium Reaction Zone)
• Entry: 4,107 – 4,105
• Stop-Loss: 4,117
• Take-Profit Targets:
→ 4,060 (minor imbalance fill)
→ 4,030 (BOS retest)
→ 3,985 (discount zone)
📌 Execute only after a liquidity sweep into the zone + bearish BOS on M5–M15.
🟢 Buy Setup (Discount Reaction Zone)
• Entry: 3,983 – 3,985
• Stop-Loss: 3,976
• Take-Profit Targets:
→ 4,030 (short-term structure high)
→ 4,060 (inefficiency midpoint)
→ 4,105 (premium retest)
📌 Valid if price taps channel low + shows bullish displacement.
⚠️ Risk Management Notes
• Expect volatility as markets digest hawkish Fed remarks before NFP.
• Avoid entering trades inside the 4020–4070 chop region without clear BOS.
• Reduce position size during news hours.
• Trail stops once price clears each liquidity pocket.
📝 Summary
Gold remains pressured by Fed rhetoric, but liquidity is building at both extremes.
• Sell Zone: 4107–4105 (premium mitigation area)
• Buy Zone: 3983–3985 (discount liquidity sweep)
Price is likely to form a manipulation → reaction → continuation pattern within the channel.
📍 Follow @Ryan_TitanTrader for more Smart Money updates ⚡
🎁 More insights & gifts on my TradingView profile.

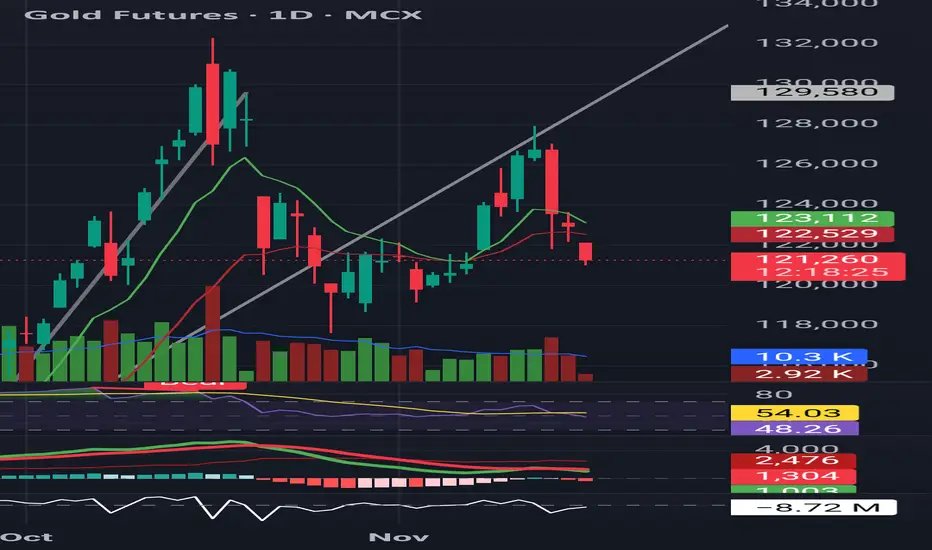
Gold Futures – Bearish Continuation Developing 🟡⬇ Gap-down open = breakdown continuation
Price below 9 EMA and 21 EMA
Evening Star pattern confirmed
RSI falling → momentum weakening
MACD below signal → bearish pressure
📌 Short Setup:
Below 121,800–121,900
🎯 Targets: 117,500 → 116,000
🛑 Stoploss: 123,650
Weak trend until gold closes back above 21 EMA.
GOLD H1 – Will Retail Sales Trigger Gold’s Next Big Move?🟡 XAUUSD – Intraday Smart Money Plan | by Ryan_TitanTrader (17/11)
📈 Market Context
Gold is trading inside a corrective phase as markets anticipate today’s U.S. Retail Sales data and several Fed speeches — both crucial for assessing whether inflation momentum is slowing or rebounding.
• Weak retail numbers may hint at cooling consumer strength, supporting safe-haven bids in gold.
• Strong data could revive USD demand, prompting sell-side setups from premium zones.
Institutional flows show engineered pushes into inefficiency before a directional leg unfolds.
🔎 Technical Analysis (1H / SMC Structure)
• Structure: Gold is forming a short-term accumulation at the discount range after consecutive bearish candles and a deep liquidity sweep below 4030.
• FVG Sell Zone: 4140–4138 aligns with an unmitigated FVG + internal liquidity — ideal for sell-side reactions.
• Discount Zone: 4008–4010 is the last clean demand zone + sweep area, matching the chart’s projected bullish inducement.
• Liquidity:
→ Buy-side liquidity rests above 4140.
→ Sell-side liquidity remains exposed near 4000–3995.
🔴 Sell Setup (Premium Reaction Zone)
• Entry: 4,140 – 4,138
• Stop-Loss: 4,150
• Take-Profit Targets:
→ 4,095 (intra-day imbalance fill)
→ 4,060 (previous BOS block)
→ 4,010 (discount accumulation area)
📌 Trade only after a liquidity sweep into FVG + bearish BOS on M5–M15.
🟢 Buy Setup (Discount Reaction Zone)
• Entry: 4,010 – 4,008
• Stop-Loss: 4,000
• Take-Profit Targets:
→ 4,060 (short-term structure high)
→ 4,095 (mid-range inefficiency)
→ 4,138 (final premium reaction zone)
📌 Valid if price sweeps 4008 and shows bullish BOS + displacement.
⚠️ Risk Management Notes
• Expect volatility during the U.S. Retail Sales release.
• Avoid chasing price inside the 4060–4100 chop region.
• Lock profits at each liquidity level and trail stops.
• Keep total risk under 1–2% per setup.
📝 Summary
Gold remains in a engineered pullback phase with clear liquidity pockets at both extremes.
• Sell Zone: 4140–4138 (FVG / premium reaction zone)
• Buy Zone: 4008–4010 (discount accumulation zone)
A clean manipulation–reaction–continuation pattern is likely before the next intraday move.
📍 Follow @Ryan_TitanTrader for more Smart Money updates ⚡
Check out my TradingView profile for special gifts 🎁

GOLD: Big Pullback Loading Before a 4400 Rally?Bias: Bullish – Buy-the-Dip Strategy
Approach: Smart Money Concepts (SMC)
🌐 Market Context
Gold continues to show a strong recovery, maintaining a clear bullish structure across the H1, H4, and Daily timeframes.
Institutional order flow remains firmly on the buy-side as:
Liquidity on H1/H4 highs is being swept consistently
Pullbacks are respecting Demand Order Blocks (OBs)
Multiple Breaks of Structure (BOS) confirm bullish continuation
However, the region 4280 – 4330 (FVG + major trap zone) has historically triggered strong distribution – making it a likely area for liquidity hunts and fake breakouts before any corrective move.
🎯 Key Price Levels
🔴 Resistance Zones (Potential Distribution Areas)
4274 – 4295
4330 – 4345 (FVG + Biggest Trap Zone)
Expect volatility and sharp reactions here – suitable for partial profit-taking, not for chasing buy entries.
🟢 Support / Buy Zones (Institutional Demand Areas)
1️⃣ BUY Opportunity – Shallow Pullback (High Probability)
Entry: 4170 – 4190 (H4 OB + BOS retest)
SL: Below 4170
TP1: 4275
TP2: 4360 – 4400
➡️ This is today’s primary setup. Requires clear bullish confirmation on entry.
2️⃣ BUY Opportunity – Deep Pullback (High R:R Setup)
Entry: 4100 – 4120 (Deep OB + liquidity sweep level)
SL: Below 4100
TP1: 4275
TP2: 4360 – 4400
➡️ Best scenario if the market retraces deeply — exceptional Risk:Reward.
📉 Why Selling Is Not a Priority
Despite resistance overhead, the market remains:
Bullish in structure
Supported by demand zones
Without a confirmed Market Structure Shift (MSS) → Bearish BOS
Therefore, selling remains counter-trend and not part of the main trading plan today.
📈 Institutional Technical Outlook (H1/H4)
1. Price approaching 4280 – 4330 trap zone
Expect:
Liquidity sweeps
Wick-driven false breakouts
Short-term corrections back into OB before continuing upwards
2. Liquidity Map
4170 liquidity pool below current price → likely target for engineered pullback
4300 – 4350 equal highs → attractive upside draw for smart money
🧠 Professional Trade Plan Summary
✔️ Do not chase breakouts near resistance
✔️ Wait for price to retrace into:
4170 – 4190
4100 – 4120
✔️ Main targets:
TP1: 4275
TP2: 4360 – 4400
✔️ At TP1:
Secure 50%
Move SL to Break-Even
✔️ Plan invalidation if price closes below 4100
📌 Notes for Large-Capital Traders (UK/EU)
Today’s environment is ideal for high-quality, low-frequency entries at institutional demand zones.
Avoid buying at highs; patience will deliver the best setups.
This plan follows a clean institutional trend-following methodology — suitable for accounts prioritising consistency and low drawdown.
📊 Daily Bias: Strong BUY
⏳ Waiting for pullback towards 4170 – 4190 or 4100 – 4120
🚀 Targeting 4360 – 4400 over the next sessions
