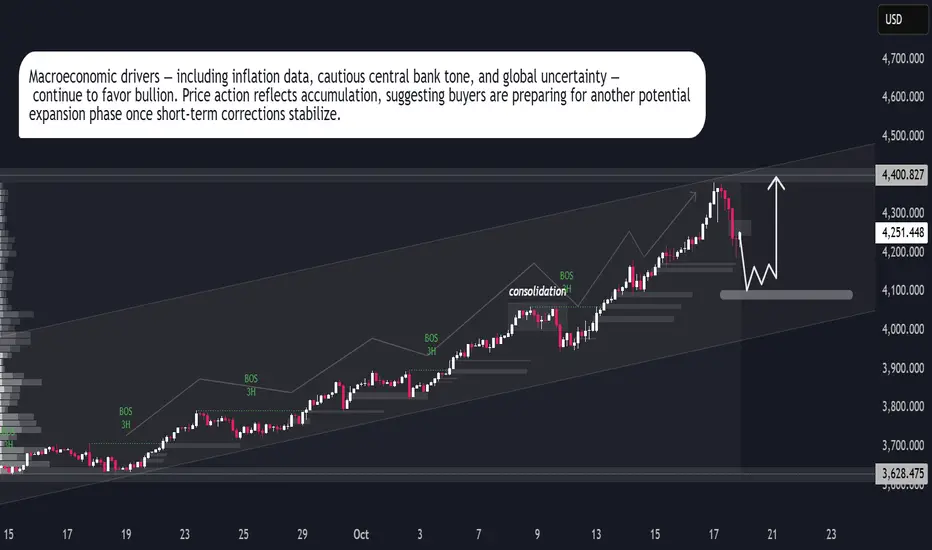
Gold Bullish Reversal from Demand Zone Targeting 4320 ResistanceGold has displayed a strong bullish rejection from the 4,220–4,240 demand zone, signaling that buyers are stepping back in after a brief corrective phase. The price has respected the previously broken ascending trendline, now acting as dynamic support, indicating that market sentiment remains positive.
Key Observations:
Trend Structure: The broader trend continues to favor the bulls, with higher highs and higher lows still valid.
Demand Zone: Buyers defended the 4,220–4,240 area with stxrong volume, confirming institutional interest.
Price Action: Recent bullish engulfing candles suggest renewed buying momentum.
Next Resistance: The 4,310–4,330 region stands as a key resistance zone where partial profit-taking could occur.
Volume: Noticeable increase in bullish volume near support adds confirmation to the move.
Trading Outlook:
If price sustains above 4,240, the bias remains bullish toward 4,320–4,340.
A daily close below 4,220 would invalidate this setup and shift focus back to the 4,100 zone.
Summary
Gold is currently positioned for a potential continuation of its primary uptrend, with early signs of buyer strength re-emerging at major support. Momentum remains in favor of the bulls as long as the 4,220 base holds firm.
Goldsignal

Gold Price Outlook | Buyers Stay in Full ControlGold remains firmly positioned within its broader bullish trajectory, supported by consistent demand from both institutional and retail investors. The market has shown strong resilience, forming a well-defined higher-low structure, which reflects continued accumulation. Price action indicates that buyers are confidently stepping in after each controlled pullback, maintaining upward momentum.
The current market tone favors continuation toward the 4,180–4,250 range if momentum persists. Short-term retracements into the 4,070–4,090 area may offer new buying opportunities for position traders aligning with the prevailing trend. Macroeconomic factors such as ongoing inflation concerns, geopolitical instability, and cautious monetary policy stance continue to underpin gold’s strength.
Trading Analysis for Gold Spot / U.S. Dollar (15-Minute Chart)Sorry I am late in giving the signal but I will say that manipulation in XAU/USD is at extreme level. Keep portfolio at least $1000.
Take buy position in XAU/USD as much as possible.
Not more than $3630.00.
Target 1 3353.00
Target 2 3358.00
Target 3 3365.00
Target 4 3372.00
SL 3630.00
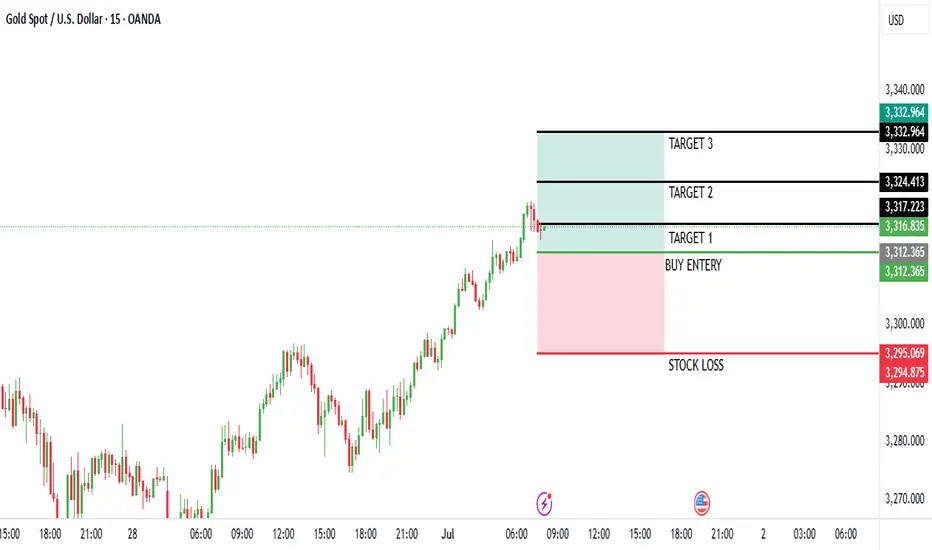
Based on the provided 15-minute chart for Gold Spot / U.S. Dollar (XAU/USD), published by NaviPips on TradingView.com on June 30, 2025, at 17:53 UTC, here’s a suggested trading setup for a buy position:
Current Price and Trend: The current price is 3,241.875, with a slight increase of +0.250 (+0.01%). The chart shows a recent downtrend that appears to be stabilizing near the current level, suggesting a potential reversal point.
Buy Entry: Enter a buy position at 3,312.875 (current price), as it aligns with a support zone where the price has found a base, indicated by the horizontal dashed line and recent consolidation.
Stop Loss: Place a stop loss at 3,295.250, below the recent low, to protect against further downside. This level is approximately 10.625 points below the entry, defining the risk.
Take Profit Levels:
Take Profit 1: 3,317.875, a conservative target about 20.000 points above the entry, aligning with a minor resistance zone.
Take Profit 2: 3,324.750, a mid-range target approximately 31.875 points above the entry.
Take Profit 3: 3,332.500, a deeper target about 45.625 points above the entry, indicating a potential trend reversal.
Price Action: The chart indicates a downtrend with a possible bottoming pattern near the current level. The support zone and upward candlestick suggest a buy opportunity if the price holds.
Risk-Reward Ratio: The distance to the stop loss (10.625 points) compared to the take profit levels (20.000 to 45.625 points) offers a favorable risk-reward ratio, ranging from approximately 1:1.9 to 1:4.3.
Conclusion
Enter a buy at 3,241.875, with a stop loss at 3,295.250 and take profit levels at 3,317.875, 3,324.750, and 3,332.500. Monitor the price action for confirmation of an upward move, and be cautious of a potential continued downtrend if the price breaks below the stop loss level. (Note: I assume "take profot" was a typo for "take profit" and have corrected it accordingly.)

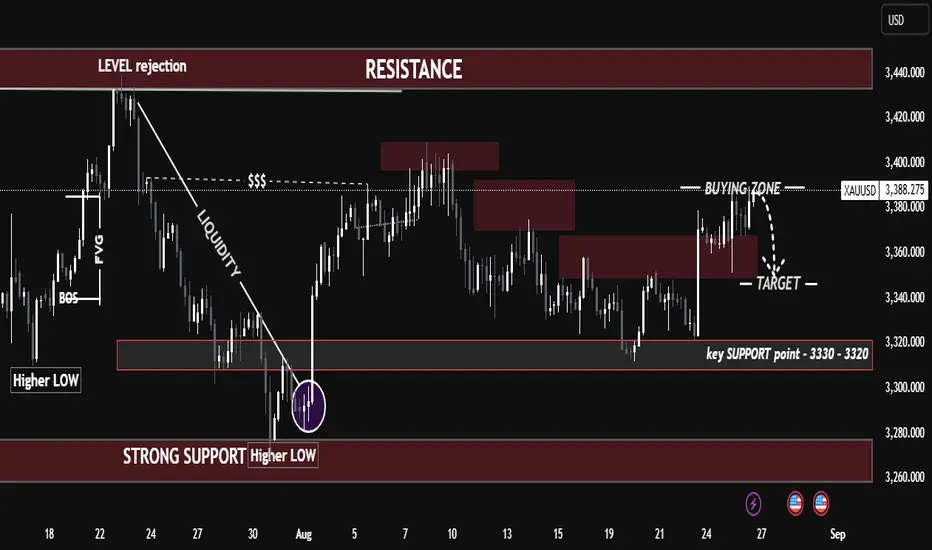
"Gold Setup: Buying Zone Rejection or Breakout Ahead?""Gold Setup: Buying Zone Rejection or Breakout Ahead?"
Gold is currently trading inside a buying zone (3380 – 3400) but facing rejection. Market structure is still holding higher lows, which keeps the bigger trend bullish, but short-term price action suggests a possible retracement move.
Resistance Zone: 3420 – 3440 (strong supply, previous rejection)
Key Support: 3330 – 3320 (major demand, higher low base)
Immediate Target: 3340 – 3360 (if rejection continues)
📉 Short-term bias: bearish correction toward 3340 – 3360
📈 Swing bias: bullish as long as 3330 – 3320 holds
🔑 My View:
I’ll be watching how price reacts around 3330 – 3320. Holding this level could trigger the next bullish leg toward 3420 – 3440. Losing it opens the door for deeper downside into 3280.
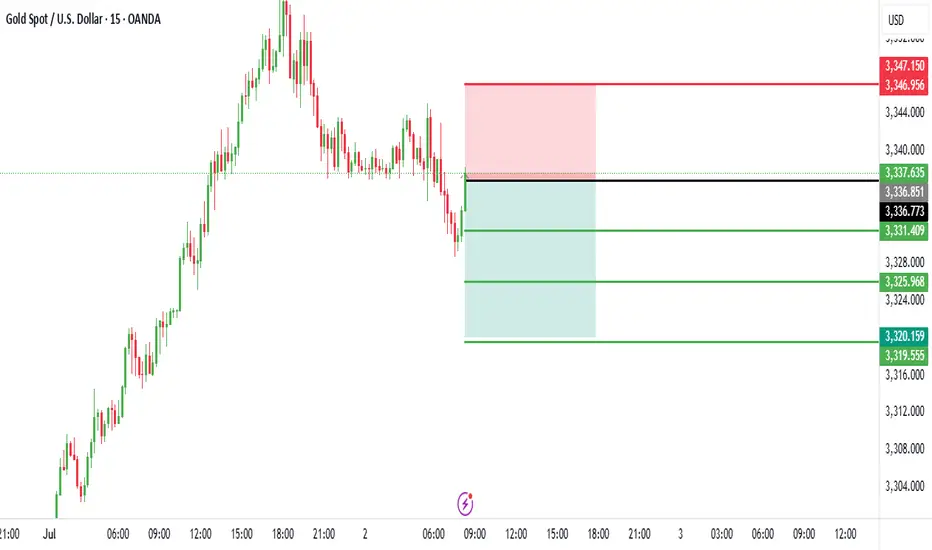
Trading Analysis for Gold Spot / U.S. Dollar (15-Minute Chart)Based on the provided 15-minute chart for Gold Spot / U.S. Dollar (XAU/USD) and the specified data, here’s a suggested trading setup for a sell position:
Current Price and Trend: The current price is not explicitly provided, but the entry price is set at 3,336.00. The chart suggests a potential resistance zone near this level, with a recent uptrend showing signs of exhaustion.
Sell Entry: Enter a sell position at 3,336.00, aligning with the specified entry price where the price may face rejection due to resistance.
Stop Loss: Place a stop loss at 3,346.00, above the recent high, to protect against an upward breakout. This level is 10.00 points above the entry, defining the risk.
Take Profit Levels:
Take Profit 1: 3,331.00, a conservative target 5.00 points below the entry.
Take Profit 2: 3,326.00, a mid-range target 10.00 points below the entry.
Take Profit 3: 3,321.00, a deeper target 15.00 points below the entry, aligning with a potential support zone.
Price Action: The chart indicates a peak near the entry level, with a bearish reversal signal suggested by the candlestick pattern and resistance line.
Risk-Reward Ratio: The distance to the stop loss (10.00 points) compared to the take profit levels (5.00 to 15.00 points) offers a mixed risk-reward profile. Take Profit 2 and 3 provide a 1:1 and 1:1.5 ratio, respectively, making this a balanced short-term trade.
Conclusion
Enter a sell at 3,336.00, with a stop loss at 3,346.00 and take profit levels at 3,331.00, 3,326.00, and 3,321.00. Monitor the price action for confirmation of a downtrend, and be cautious of a potential upward move if the price breaks above the stop loss level.
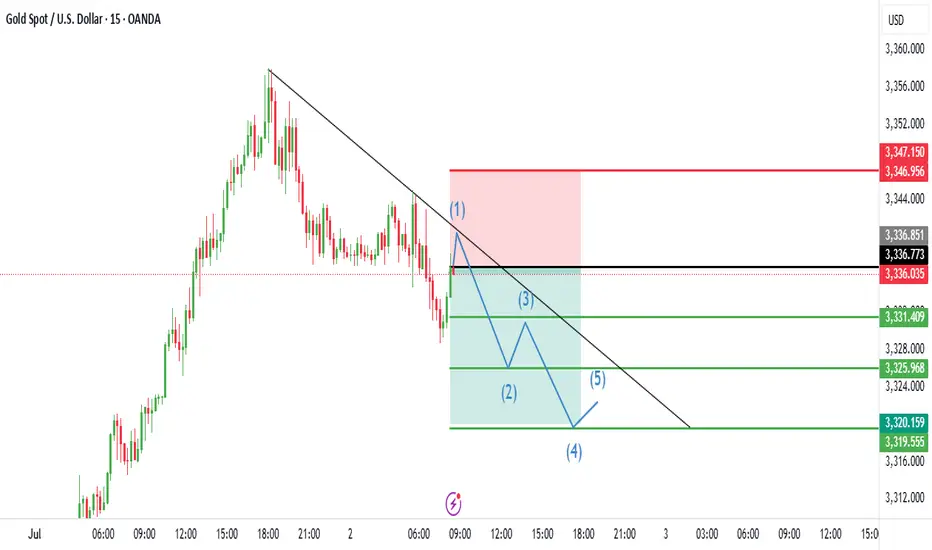
Trading Analysis for Gold Spot / U.S. Dollar (15-Minute Chart)
Based on the provided 15-minute chart for Gold Spot / U.S. Dollar (XAU/USD) and the specified data, here’s a suggested trading setup for a sell position:
Current Price and Trend: The current price is not explicitly provided, but the entry price is set at 3,336.00. The chart suggests a potential resistance zone near this level, with a recent uptrend showing signs of exhaustion.
Sell Entry: Enter a sell position at 3,336.00, aligning with the specified entry price where the price may face rejection due to resistance.
Stop Loss: Place a stop loss at 3,346.00, above the recent high, to protect against an upward breakout. This level is 10.00 points above the entry, defining the risk.
Take Profit Levels:
Take Profit 1: 3,331.00, a conservative target 5.00 points below the entry.
Take Profit 2: 3,326.00, a mid-range target 10.00 points below the entry.
Take Profit 3: 3,321.00, a deeper target 15.00 points below the entry, aligning with a potential support zone.
Price Action: The chart indicates a peak near the entry level, with a bearish reversal signal suggested by the candlestick pattern and resistance line.
Risk-Reward Ratio: The distance to the stop loss (10.00 points) compared to the take profit levels (5.00 to 15.00 points) offers a mixed risk-reward profile. Take Profit 2 and 3 provide a 1:1 and 1:1.5 ratio, respectively, making this a balanced short-term trade.
Conclusion
Enter a sell at 3,336.00, with a stop loss at 3,346.00 and take profit levels at 3,331.00, 3,326.00, and 3,321.00. Monitor the price action for confirmation of a downtrend, and be cautious of a potential upward move if the price breaks above the stop loss level.
Trading Analysis for Gold Spot / U.S. Dollar (15-Minute Chart)
Based on the provided 15-minute chart for Gold Spot / U.S. Dollar (XAU/USD), published by NaviPips on TradingView.com on June 30, 2025, at 17:53 UTC, here’s a suggested trading setup for a buy position:
Current Price and Trend: The current price is 3,241.875, with a slight increase of +0.250 (+0.01%). The chart shows a recent downtrend that appears to be stabilizing near the current level, suggesting a potential reversal point.
Buy Entry: Enter a buy position at 3,312.875 (current price), as it aligns with a support zone where the price has found a base, indicated by the horizontal dashed line and recent consolidation.
Stop Loss: Place a stop loss at 3,295.250, below the recent low, to protect against further downside. This level is approximately 10.625 points below the entry, defining the risk.
Take Profit Levels:
Take Profit 1: 3,317.875, a conservative target about 20.000 points above the entry, aligning with a minor resistance zone.
Take Profit 2: 3,324.750, a mid-range target approximately 31.875 points above the entry.
Take Profit 3: 3,332.500, a deeper target about 45.625 points above the entry, indicating a potential trend reversal.
Price Action: The chart indicates a downtrend with a possible bottoming pattern near the current level. The support zone and upward candlestick suggest a buy opportunity if the price holds.
Risk-Reward Ratio: The distance to the stop loss (10.625 points) compared to the take profit levels (20.000 to 45.625 points) offers a favorable risk-reward ratio, ranging from approximately 1:1.9 to 1:4.3.
Conclusion
Enter a buy at 3,241.875, with a stop loss at 3,295.250 and take profit levels at 3,317.875, 3,324.750, and 3,332.500. Monitor the price action for confirmation of an upward move, and be cautious of a potential continued downtrend if the price breaks below the stop loss level. (Note: I assume "take profot" was a typo for "take profit" and have corrected it accordingly.)
Trading Analysis for Gold Spot / U.S. Dollar (15-Minute Chart)
Based on the provided 15-minute chart for Gold Spot / U.S. Dollar (XAU/USD), published by NaviPips on TradingView.com on June 27, 2025, at 17:53 UTC, here’s a suggested trading setup for a sell position:
Current Price and Trend: The current price is 3,278.385, with a slight increase of +2.500 (+0.08%). The chart shows a recent uptrend that appears to be exhausting near the current level, suggesting a potential reversal point.
Sell Entry: Enter a BUY position at 3,26O TO 3270 (current price), as it aligns with a resistance zone where the price has peaked and started to show signs of decline.
Stop Loss: Place a stop loss at 3,240.526, below the recent low, to protect against an upward continuation. This level is approximately 37.859 points below the entry, defining the risk.
Take Profit Levels:
Take Profit 1: 3,300.898, a conservative target about 35.513 points above the entry.
Take Profit 2: 3,305.203, a slightly lower target approximately 34.818 points above the entry.
Take Profit 3: 3,313.816, a mid-range target about 17.431 points above the entry.
indicating a potential trend reversal.
Price Action: The chart indicates an uptrend with a recent peak followed by a bearish candle, suggesting a possible reversal. The horizontal dashed line marks a key level, supporting the sell setup at the current resistance.
Risk-Reward Ratio: The distance to the stop loss (37.859 points) compared to the take profit levels (14.440 to 35.513 points) presents a mixed risk-reward profile. Take Profit 1 offers a near 1:1 ratio, while Take Profit 4 results in a negative ratio, indicating a high-risk trade against the recent uptrend.
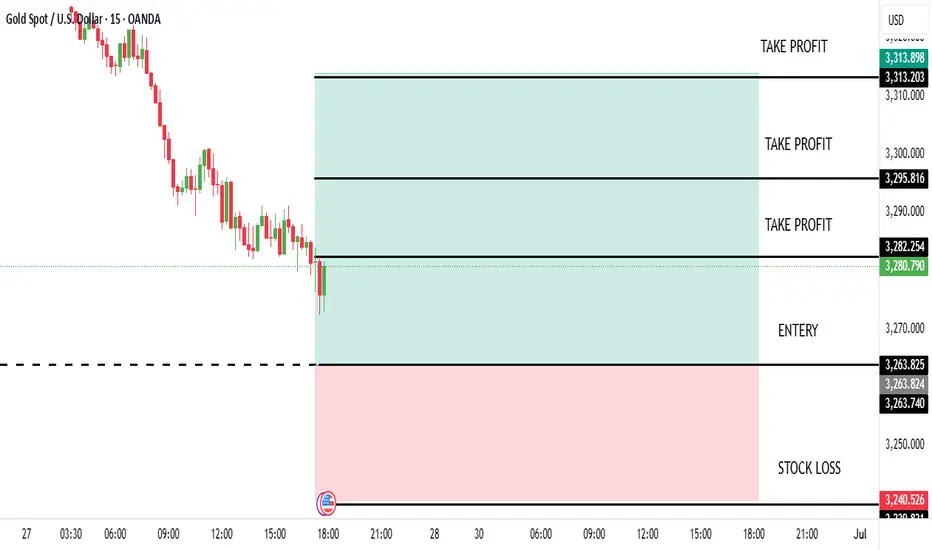
Trading Analysis for Gold Spot / U.S. Dollar (15-Minute Chart)Based on the provided 15-minute chart for Gold Spot / U.S. Dollar (XAU/USD), published by NAVIPIPS on TradingView.com on June 28, 2025, at 20:42 UTC, here’s a suggested trading setup for a sell position. Note that the chart indicates a buy setup, but since you requested a sell analysis, I will interpret a potential sell scenario based on the current price action and levels.
Current Price and Trend: The current price is 3,274.175, with a slight decline of -0.580 (-0.02%). The chart shows a recent uptrend that may be exhausting near the current level, with a potential reversal suggested by the downward trendline.
BUY Entry: Enter a sell position at 3,274.175 (current price), as it aligns with a resistance zone where the price has struggled to break higher, indicated by the buy entry level being a potential reversal point for a sell.
Stop Loss: Place a stop loss at 3,263.740, below the recent low, to protect against an upward continuation. This level is approximately 10.435 points below the entry, defining the risk.
Take Profit Levels:
Take Profit 1: 3,295.816, a conservative target about 21.641 points above the entry.
Take Profit 2: 3,280.254, a mid-range target approximately 6.079 points above the entry.
Take Profit 3: 3,263.825, a deeper target about 10.350 points below the entry, aligning with a support zone.
Price Action: The chart indicates an uptrend with a potential peak near the current level, supported by the downward trendline. The buy setup suggests a bounce, but a sell could be viable if the price fails to sustain upward momentum.
Risk-Reward Ratio: The distance to the stop loss (10.435 points) compared to the take profit levels (6.079 to 21.641 points) presents a mixed risk-reward profile. Take Profit 1 offers a 1:2 ratio, while Take Profit 3 results in a negative ratio, indicating a high-risk sell against the buy setup.
Conclusion
Enter a BUY at 3,274.175, with a stop loss at 3,263.740 and take profit levels at 3,295.816, 3,280.254, and 3,263.825. This is a counter-trend trade against the indicated buy setup, so confirm the reversal with additional indicators (e.g., candlestick patterns or RSI) and be prepared for potential upward momentum if the price breaks above the stop loss level.

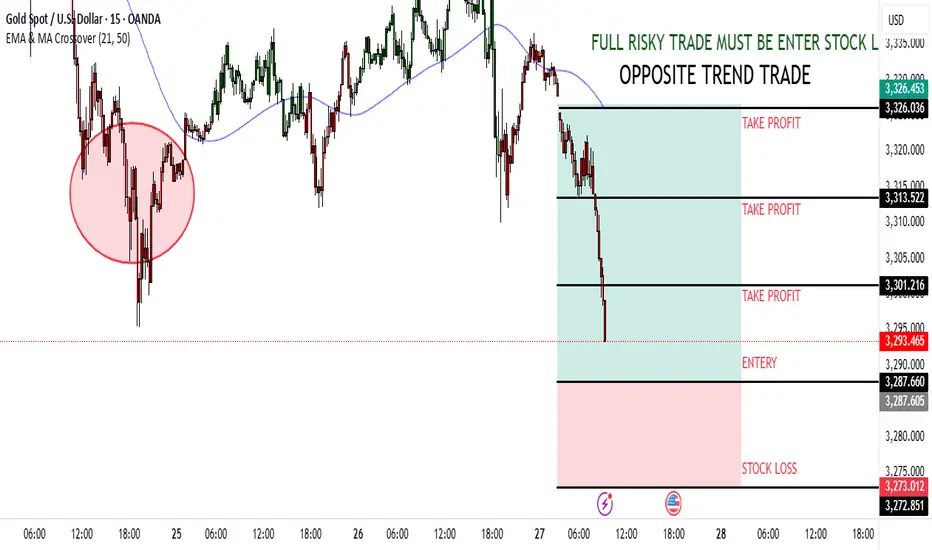
Trading Analysis for Gold Spot / U.S. Dollar (15-Minute Chart)
Based on the provided 15-minute chart for Gold Spot / U.S. Dollar (XAU/USD), published by NaviPips on TradingView.com on June 27, 2025, at 09:20 UTC, here’s a suggested trading setup for a sell position:
1. **Current Price and Trend**: The current price is 3,295.890, with a slight decline of -0.235 (-0.10%). The chart shows a recent uptrend that appears to be exhausting near the current level, with a potential reversal indicated by the EMA crossing and a bearish candle.
2. **Sell Entry**: Enter a sell position at 3,295.890 (current price), as it aligns with the resistance zone where the price has peaked and started to decline, supported by the "FULL RISKY TRADE MUST BE ENTER OPPOSITE TREND TRADE" label.
3. **Stop Loss**: Place a stop loss at 3,275.012, below the recent low, to protect against an upward continuation. This level is approximately 20.878 points below the entry, defining the risk.
4. **Take Profit Levels**:
- **Take Profit 1**: 3,326.453, a conservative target about 30.563 points above the entry, aligning with a minor resistance zone.
- **Take Profit 2**: 3,315.522, a mid-range target approximately 19.632 points above the entry.
- **Take Profit 3**: 3,301.216, a deeper target about 5.326 points above the entry.
- **Take Profit 4**: 3,287.605, the furthest target, approximately 8.285 points below the entry, indicating a potential trend reversal.
5. **Price Action**: The chart shows an uptrend with a recent peak followed by a bearish reversal signal. The EMA crossover and the "opposite trend trade" label suggest a high-risk sell setup against the prevailing uptrend.
6. **Risk-Reward Ratio**: The distance to the stop loss (20.878 points) compared to the take profit levels (5.326 to 30.563 points) presents a mixed risk-reward profile. Take Profit 1 offers a 1:1.5 ratio, while lower targets like Take Profit 4 result in a negative ratio, highlighting the high-risk nature of this trade.
### Conclusion
Enter a sell at 3,295.890, with a stop loss at 3,275.012 and take profit levels at 3,326.453, 3,315.522, 3,301.216, and 3,287.605. This is a high-risk trade due to the "opposite trend" strategy, so confirm the reversal with additional indicators and be prepared for potential continued upward momentum if the stop loss is hit.
Trading Analysis for Gold Spot / U.S. Dollar (15-Minute Chart)
Based on the provided 4-hour chart for Gold Spot / U.S. Dollar (XAU/USD), published by NaviPips on TradingView.com on June 24, 2025, at 19:14 UTC, here’s a suggested trading setup for a buy position:
Current Price and Trend: The current price is 3,300.955, reflecting a decline of -13.870 (-0.42%). The chart shows a recent downtrend with a potential support level forming near the current price.
Buy Entry : Enter a buy position at 3,300.955 (current price), as it aligns with a potential support zone where the price has stabilized. This level could serve as a base for a reversal or bounce.
Stop Loss: Place a stop loss at 3,293.294, below the recent low, to protect against further downside. This level is approximately 7.661 points below the entry, defining the risk.
Take Profit Levels:
Take Profit 1: 3,317.960, a conservative target about 17.005 points above the entry, aligning with a minor resistance zone.
Take Profit 2: 3,324.255, a mid-range target indicating a moderate upward move.
Take Profit 3: 3,344.000, a deeper target reflecting a stronger bullish reversal.
Price Action: The chart indicates a downtrend with a possible exhaustion near the current level, supported by the horizontal dashed line (potential support). A break above the recent consolidation could confirm the buy setup.
Risk-Reward Ratio: The distance to the stop loss (7.661 points) compared to the take profit levels (17.005 to 43.045 points) offers a favorable risk-reward ratio, particularly for Take Profit 3.
Conclusion
Enter a buy at 3,300.955, with a stop loss at 3,293.294 and take profit levels at 3,317.960, 3,324.255, and 3,344.000. Monitor the price action for confirmation of a reversal, and be cautious of potential continued bearish momentum given the recent trend.

Trading Analysis for Gold Spot / U.S. Dollar (15-Minute Chart)Based on the provided 15-minute chart for Gold Spot / U.S. Dollar (XAU/USD), published by NaviPips on TradingView.com on June 25, 2025, at 12:28 UTC, here’s a suggested trading setup for a sell position:
Current Price and Trend: The current price is 3,331.315, with a slight decline of -1.390 (-0.04%). The chart shows a recent downtrend with a potential resistance zone near the current price.
Sell Entry Options:
1st Entry: Enter a sell position at 3,355.490, aligning with the upper resistance level marked, where the price may face rejection.
2nd Entry: Enter a sell position at 3,344.221, a secondary resistance level if the price retraces slightly.
Stop Loss: Place a stop loss at 3,357.831, above the recent high, to protect against an upward breakout. This level is approximately 2.341 points above the 1st entry and 13.610 points above the 2nd entry, defining the risk.
Take Profit Levels:
Take Profit 1: 3,325.242, a conservative target about 30.248 points below the 1st entry and 18.979 points below the 2nd entry.
Take Profit 2: 3,316.079, a mid-range target approximately 39.411 points below the 1st entry and 28.142 points below the 2nd entry.
Take Profit 3: 3,304.625, a deeper target about 50.865 points below the 1st entry and 39.596 points below the 2nd entry.
Take Profit 4: 3,286.474, the furthest target, approximately 69.016 points below the 1st entry and 57.747 points below the 2nd entry.
Price Action: The chart indicates a downtrend with a recent bounce that may be exhausting near the 1st and 2nd entry levels. The 1:2 risk-reward ratio zone suggests a potential reversal point.
Risk-Reward Ratio: .
For the 1st entry (3,355.490), the stop loss to Take Profit 4 distance (69.016 points) offers a 1:2 risk-reward ratio with Take Profit 2 (39.411 points).
For the 2nd entry (3,344.221), the stop loss to Take Profit 4 distance (57.747 points) also aligns with a favorable risk-reward profile.
Conclusion
Option 1: Sell at 3,355.490 with a stop loss at 3,357.831 and take profit levels at 3,325.242, 3,316.079, 3,304.625, and 3,286.474.
Option 2: Sell at 3,344.221 with a stop loss at 3,357.831 and the same take profit levels. Monitor the price action for confirmation of a reversal at the entry levels, and be cautious of potential bullish momentum if the price breaks above the stop loss.

Trading Analysis for Gold Spot / U.S. Dollar (15-Minute Chart)Based on the provided 15-minute chart for Gold Spot / U.S. Dollar (XAU/USD), published by NaviPips on TradingView.com on June 25, 2025, at 03:52 UTC, here’s a suggested trading setup for a sell position:
Current Price and Trend: The current price is 3,322.840, with a slight decline of -0.190 (-0.01%). The chart shows a recent downtrend with a potential resistance level near the current price.
Sell Entry: Enter a sell position at 3,323.400 (near the current price and entry level marked), as it aligns with a resistance zone where the price has struggled to break higher.
Stop Loss: Place a stop loss at 3,357.864, above the recent high, to protect against an upward breakout. This level is approximately 34.464 points above the entry, defining the risk.
Take Profit Levels:
Take Profit: 3,286.372, a target about 37.028 points below the entry, aligning with a support zone and offering a 1:1 risk-reward ratio as indicated on the chart.
Price Action: The chart indicates a downtrend with a recent bounce that may be exhausting near the current level. The horizontal dashed line suggests a resistance area, supporting a sell setup.
Risk-Reward Ratio: The distance to the stop loss (34.464 points) compared to the take profit (37.028 points) provides a balanced 1:1 risk-reward ratio, making this a reasonable short-term trade.
Conclusion
Enter a sell at 3,323.400, with a stop loss at 3,357.864 and a take profit at 3,286.372. Monitor the price action for confirmation of a continued downtrend, and be cautious of potential reversals if the price breaks above the stop loss level.

Analysis of Gold Spot / U.S. Dollar (1-Minute Chart)
The provided chart for Gold Spot / U.S. Dollar (XAU/USD) on a 1-minute timeframe, published by NaviPips on TradingView.com on June 24, 2025, at 15:11 UTC, presents a short-term trading setup with the following insights:
Current Price and Trend: The current price is 3,322.030, with a slight increase of +0.410 (+0.01%). The chart shows a recent downward trend followed by a potential reversal or consolidation phase.
Entry Level: The entry point is not explicitly marked, but the chart suggests a buy opportunity near the current price level of 3,322.030, aligning with the recent low and a possible support zone.
Stop Loss: The stop loss is implied at 3,319.229, below the recent low, providing protection against further downside. This level is approximately 2.801 points below the current price, defining the risk.
Take Profit Levels (Green Lines):
Take Profit 1: 3,325.848, a conservative target about 3.818 points above the entry, aligning with a resistance zone.
Take Profit 2: 3,327.405, a mid-range target indicating a moderate upward move.
Take Profit 3: 3,329.317, a deeper target suggesting continued bullish momentum.
Take Profit 4: 3,330.000, a further target reflecting a stronger upward trend.
Take Profit 5: 3,332.290, the furthest target, indicating a significant short-term rally.
Price Action: The chart displays a descending pattern with a recent bounce from a low (around 15:00), followed by a projected upward move. The dotted line indicates a potential trendline break, supporting a bullish outlook.
Risk-Reward Ratio: The distance to the stop loss (2.801 points) compared to the take profit levels (3.818 to 10.260 points) offers a favorable risk-reward ratio, especially for higher targets.
Conclusion
This setup anticipates a bullish move from the current level of 3,322.030, with multiple take-profit levels marked by green lines and a stop loss at 3,319.229 to manage risk. Traders should confirm the entry with a breakout above the recent low and monitor for potential reversals given the short timeframe.

Analysis of Gold Spot / U.S. Dollar (15-Minute Chart)The provided chart for Gold Spot / U.S. Dollar (XAU/USD) on a 15-minute timeframe, published by NaviPips on TradingView.com on June 24, 2025, at 09:19 UTC, outlines a trading setup with the following insights:
Current Price and Trend: The current price is 3,353.510, with a slight decline of -0.425 (-0.01%). The chart shows a recent peak followed by a downward correction, suggesting a potential short-term bearish move.
Entry Level: The entry point is set at 3,358.290, slightly above the current price, indicating a buy opportunity if the price stabilizes or retraces to this level. This aligns with a support zone near the recent low.
Stop Loss: A stop loss is placed at 3,370.362, above the recent high, offering protection against an upward breakout. This level is approximately 12.072 points above the entry, defining the risk.
Take Profit Levels:
Take Profit 1: 3,344.209, a conservative target about 14.081 points below the entry, aligning with a support level.
Take Profit 2: 3,335.002, a deeper target indicating further downside momentum.
Take Profit 3: 3,332.879, the furthest target, suggesting a significant short-term decline if the trend continues.
Price Action: The chart reflects a recent consolidation phase after a peak, with a clear downward move initiating. The setup anticipates continued bearish momentum from the entry level.
Risk-Reward Ratio: The distance to the stop loss (12.072 points) compared to the targets (14.081 to 25.411 points) offers a favorable risk-reward ratio, making this a potentially viable short-term trade.
Conclusion
This setup targets a bearish move from the entry level of 3,358.290 , with defined take-profit levels and a stop loss to manage risk. Traders should watch for confirmation at the entry level and be prepared for potential reversals given the short timeframe and minor price change.

Insightful Dive into Gold Spot / U.S. Dollar (XAU/USD) 15-MinuteHistorical Flow: The chart tracks the Gold Spot / U.S. Dollar (XAU/USD) price action on a 15-minute timeframe from June 22 to June 24, 2025. The price climbed steadily until around 21:00 on June 23, followed by a noticeable drop, suggesting a potential shift from an upward trend to a corrective phase along a descending trendline.
Key Levels:
Stop Loss: Positioned at $3,382.374 (red line), serving as the upper threshold to exit a short position if the price reverses.
Entry: Marked at $3,370.510 (gray line), indicating the optimal entry point for a short trade near the trendline break.
Target 1: Set at $3,365.880 (green line), the initial profit-taking level below the entry.
Target 2: Aimed at $3,346.664 (green line), offering a deeper profit zone.
Target 3: Projected at $3,335.066 (green line), the furthest target for the short trade.
Support: The $3,321.57 level (green line) acts as a potential support if the downward move continues.
Recent Price Action: The price reached a high near $3,382.374 and then breached the downtrend line (highlighted with a yellow circle), signaling a shorting opportunity. As of 18:27 UTC on June 23 (11:57 PM IST, June 23, 2025), it has declined to $3,360.330, reflecting sustained bearish momentum.
Projected Movement: The downward trajectory suggests a potential drop to Target 1 at $3,365.880, with possibilities of reaching Target 2 at $3,346.664 and Target 3 at $3,335.066 if the bearish trend holds. A move above $3,382.374 could indicate a bullish reversal.
Volume and Indicators: The chart features Bollinger Bands (O3,360.030 H3,363.990 L3,359.245 C3,360.330) with a -0.240 (-0.01%) change, pointing to low volatility. The trendline break hints at increased selling pressure, though specific volume data is unavailable.
Outlook: This chart supports a shorting strategy with a defined entry and stop loss. The price is currently in a bearish phase following the trendline break, with targets at $3,365.880, $3,346.664, and $3,335.066. Watch for a break above $3,382.374, which could signal a shift to a bullish trend.

DeGRAM | GOLD Held Support Level📊 Technical Analysis
Gold’s slide paused at $3 315; holding here keeps $3 500 – 3 520 in play.
💡 Fundamental Analysis
• PBoC has been buying for 5 months in a row.
• WGC expects strong demand from central banks in 2025.
• Trade wars, tensions in the Middle East and South Asia are causing risks that are increasing demand for gold.
• IMF warns new tariffs could slow growth, boosting safe-haven bids.
• Western ETFs had bought ≈240 t by mid-April.
• DXY is at 3-year lows and yields are down.
✨ Summary
Strong central-bank buying, renewed ETF inflows, softer USD yields and rising geopolitical risk align with chart support, favouring a rebound toward $3 500 – 3 520 while $3 315 holds.
-------------------
Share your opinion in the comments and support the idea with a like. Thanks for your support!

GOLD TRADING POINT UPDATE >READ THE CAPTAINBuddy'S dear friend 👋
Gold Trading Signals 🗺️ 🗾 Update Gold Trader's Today NFP High Impact of USD Technical Analysis Update Gold NFP open 2650 big up trand 2667 +2678
Trader's FVG back Down trand 😱 My Target 2540 Open New York sessions Gold Down trand
Resistance level 2665 2678
Support level 2621 2604 2540
Support 💫 My hard analysis Setup like And Following Me 🤝 that star ✨ game 🎯

Inflation Cools, Gold Heats Up Inflation Cools, Gold Heats Up
In June, the United States inflation fell to 3%, which is the lowest since March 2021. This was slightly below the market's expectations of 3.1% and a significant decline from May's rate of 4%. Additionally, the core inflation rate unexpectedly dropped to 4.8%, marking its lowest level since October 2021.
The implication of this deceleration is that it could prompt the Federal Reserve to scale back its plans for interest rate hikes. With inflation showing signs of cooling, the central bank may now be inclined to raise rates only once more throughout the remainder of the year.
In the wake of the inflation report gold prices shot up, soaring by more than 1.3%. The metal breached the $1,940 resistance level but fell just short of clearing the $1,960 overhead barrier. If further upward momentum materializes, it could pave the way for a potential retest of $1,975 and $1,980.
At the same time, the US dollar faced a steep decline, sinking to its lowest point in over 14 months. Against the Swiss franc, it tumbled to depths not witnessed since early 2015, settling at 0.8673 francs, down 1.4%. Earlier in the session, it even touched 0.8660, marking its weakest position since the Swiss National Bank abandoned the Swiss currency peg back in January 2015. Against the Japanese yen, the dollar hits a six-week low of 138.47 yen, witnessing a 1.4% decline. Additionally, the US dollar weakens by more than 1.5% against the New Zealand and Australian dollars. Conversely, the euro surges to its highest level since March last year, reaching $1.1125. The Euro trades up 1.2% at $1.113.

#XAUUSD 🔴 M15. Sell (Gold). Global Imbalance
A Global Level of Imbalance (H1) has formed. (+)
An imbalance of M15 has formed at the upper boundary of the H1 Range. (+)
The price is higher than the market opening. (+)
Resistance is the zone of imbalance of the open interest of stock options. (+)
input: 1927.43 (input on imbalance test)
stop: 1931.02
tp-1: 1923.81
tp-2: 1916.52

Powell hints at 2 more hikes, sends gold lower Powell hints at 2 more hikes, sends gold lower
The US dollar rose on Wednesday after the gathering of central bank leaders worldwide, which included Federal Reserve Chair Jerome Powell. During the meeting, Powell left open the possibility of the Federal Reserve implementing two more rate hikes this year. Furthermore, Powell stated that he does not anticipate inflation reaching the Federal Reserve's target of 2% until the year 2025.
However, investors might be hanging onto the words of Powell a little too tightly considering his central bank counterparts in the ECB and BoE presented more hawkish remarks (natural for the stickiness of inflation that these regions are facing). Christine Lagarde emphasized that the European Central Bank (ECB) remains unconvinced by the available evidence inflation is falling in the Euro Area. A revision by investors might be in order.
With the rise in the USD, we are also seeing selling pressure in the XAU/USD for a third straight day.
Currently, gold is hovering around $1,909 and maintaining a bearish outlook, with the potential to breach the $1,900 level. The daily chart reveals that the precious metal has dropped further below both the 20 and 100 Simple Moving Averages, which are currently converging at $1,943.
Among the current levels, $1,875 perhaps stands out as the most significant support level. Despite previously acting as a resistance point, it has served as a pivot on multiple occasions.

GOLD H1HI GUYS,
i hope all of us diong very well gold h1 chart update last few days we are posting chart analysis its hit ratio alomst 99%,we analysis the market move after move very closely every day , we are using pure price action and fundamental ,use this information wisley more accuracy on your trading
bullish targets
1757,1753 this zone HOLDING above the price next target open on 1767
1771,1767 this zone HOLDING above the price next targets open on 1780
bearish targets
1757,1753 this zone HOLDING below the price next target open on 1757
1757,1753 this zone HOLDING below the price next target open on 1747
thank you so much... guys use this informtion wisley

GOLD Buy Trade opportunityGOLD Buy Trade opportunity
Gold is currently in a bearish trend expecting to change the trend on major support level on 1870 area if market make a very strong bullish candle on support line so it will be a very nice point to take a buy trade with very good risk rewards
"Always use Stop Loss"
