Shorts active in BTcAs per priceaction it seems market taking stoploss of small sellers now may go for deep dive it's totally priceaction plz don't trade on my analysis as I am only student of charts 🙏
Goldsignals

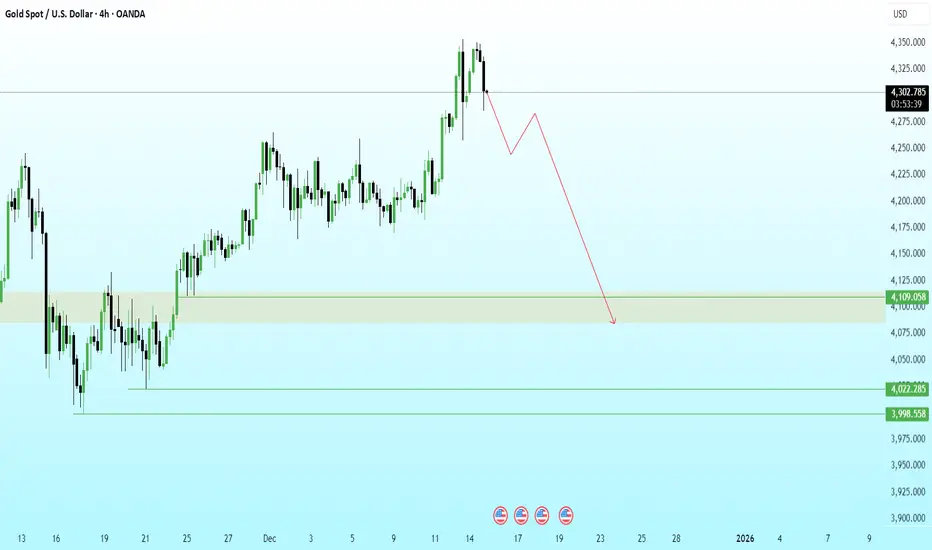
GOLD 4H | Liquidity Harvest Done… Now the Slide BeginsPrice engineered liquidity above the previous swing high and immediately delivered a sharp rejection, confirming a buy-side liquidity grab and the start of distribution.
Structure has now shifted bearish with a clear BOS from the premium zone. I’m expecting a mitigation leg before continuation lower.
The draw on liquidity sits inside the 4100–4080 demand imbalance, which aligns with unmitigated bullish orders from the prior accumulation phase.
If 4100 fails to hold on mitigation, the next liquidity pools rest at:
4022 (clean sell-side pocket)
3998 (final downside liquidity target)
XAUUSD Short | 15m |Gold revisited the upper band of the intraday structure and showed clear signs of weakening momentum. Price failed to sustain above the model’s trailing zone, indicating a shift from short-term accumulation to distribution.
The short entry was executed as price broke back below the cloud, supported by a clean loss of intrabalance strength.
Stop is placed above the most recent structural failure.
Primary target sits near the liquidity cluster around 4175.

Holding Breath for FOMC News - Will History Repeat?XAUUSD Trading Idea Today 10/12/25 (FOMC - Big News)
Will history repeat:
Before the news: Sideway | News release: prioritize SELL
Today's range: 417X–423X
Expectation: FOMC release leads to selling (Powell is usually hawkish → price drops like in September & October)
1) Intraday Trading (catching the Sideway range)
Upper range:
4218–4220
4230–4233
Lower range:
4170–4173
4180–4182
→ Morning & afternoon prioritize catching the range – trade within the range for safety before the news.
2) During the news (for those who trade the news)
Not suitable for those who are risk-averse, so you can skip if you can't handle it. Limit if you want to learn and profit using a very small account.
1) 4218–4220 (Risk-only) (if it doesn't break all day)
• High reaction area
• Safe → skip
• Risk → Probe sell, small SL
2) 4230–4233 (Main Sell)
• Strong resistance within the range
3) 4240–4244–424X (Best Sell)
• Liquidity zone
• If spike during/before news → High RR sell
3) Target down
TP1: 418X
TP2: 416X-5x
TP3: 409X (main target – swing + FVG + fibo)
4) BUY?
Attention area:
4150-52
4128-32
4102-96
5) Note on the news
This scenario holds if Powell maintains a hawkish tone.
If Powell is more "dovish" → it may go against expectations.
Risk-averse traders → do not trade the news.
News traders → use a small account to test market reactions.
Quick Summary
Before the news → Sideway, catch the range 417X–423X
News release → prioritize SELL
SELL zone: 4218, 4230–4233, 4240–4244
Main target: 409X
The price will move with each statement from the Fed Chairman and keep an eye on Trump too.
Wishing everyone a victorious day.

Gold Maintains Bullish Momentum,Watching for Breakout Above 4150📊 Market Overview:
Gold is currently trading around 4140. Market sentiment remains tilted toward buying due to expectations of an upcoming Fed rate cut, while the USD shows mild weakening during the session.
📉 Technical Analysis:
• Key resistance: 4150 – 4162
• Nearest support: 4125 – 4130
• EMA: Price is above the EMA-09, indicating the bullish trend is still intact.
• Candlestick / Momentum:
– The 4150 zone is forming a strong resistance; H1 candles show upper wicks → short-term profit-taking pressure.
– If H1 closes above 4150 → gold may extend to 4175 – 4190.
– If it fails, price may retest 4130.
📌 Outlook:
Gold may continue rising if it breaks above 4150 with a confirmed candle.
Otherwise, if it cannot break 4150 in the next 2–3 H1 candles, the market could retrace to 4130 before rising again.
________________________________________
💡 Suggested Trading Strategy:
🔺 BUY XAU/USD
Entry: 4128 – 4132
🎯 TP: 40 / 80 / 200 pips
❌ SL: 4125

Gold Drops to 4050 – Testing a Key Support Zone📊 Market Overview:
Gold continues to fall toward the 4050 region as the US Dollar strengthens and US bond yields edge higher, reducing safe-haven demand. The market is now awaiting clearer signals from the Fed minutes and upcoming US economic data, causing bullish momentum to weaken.
________________________________________
📉 Technical Analysis:
Key Resistance: 4072 – 4085
Stronger Resistance: 4095 – 4105
Nearest Support: 4055
Stronger Support: 4045 – 4040
EMA09: Price is trading below the EMA09 on the H1 chart → short-term bearish signal.
Candlestick / Momentum:
H1 candles continue forming lower highs, showing sellers are in control. Volume is gradually decreasing, indicating the market is waiting for a reaction at the 4050 support zone.
________________________________________
📌 Outlook:
• Gold may continue to decline in the short term if price breaks below 4045.
• Conversely, if gold bounces strongly from 4050 with a clear reversal candle, price could retrace toward 4072–4085, and may extend to 4095 if buying pressure strengthens.
________________________________________
💡 Suggested Trading Strategy:
🔻 SELL XAU/USD at: 4082 – 4085
🎯 TP: 40 / 80 / 200 pips
❌ SL: 4088
🔺 BUY XAU/USD at: 4040 – 4037
🎯 TP: 40 / 80 / 200 pips
❌ SL: 4035

XAU/USD OUTLOOK – TODAY 13/11/25
The US House has approved the reopening of the government, now just awaiting President Trump's signature. This means US economic data will gradually be released again, promising a week of strong and unpredictable fluctuations.
In terms of technicals, gold maintains an upward trend after breaking the H4 sideway boundary, but signs of overbought conditions and H4 peak divergence are emerging.
In smaller time frames (M30 – H1), slight divergence is also beginning to appear, so BUY positions need to be selected carefully, avoiding FOMO. SELL should only be short-term reactive trades.
🎯 Scenario for the day
Morning
Expecting sideway ~30 points within the 4180 – 4212 range
You can WATCH FOR TRADES WITHIN THIS RANGE
if the price breaks through 4212, then wait for a retest back to 4205 to buy up.
Afternoon
Wait for gold to adjust to reasonable BUY zones:
4160 – 4162
4152 – 4148
4123 – 4120
If a strong adjustment occurs:
Beautiful BUY at 4070 – 4040 (deep support zone).
🎯 Target increase:
4280 – 4285
4300 – 4305
🎯 Reactive SELL:
4255, 428X, 430X
(SL 10 – TP 10)
⚠️ Important Note
The overall trend is still uptrend, but attention is needed:
H4 shows signs of overbought + peak divergence.
M30 – H1 shows slight divergence, indicating the market may have a short adjustment before continuing to rise.
BUY should only be entered at beautiful support zones, if a bad candle is seen → close short and exit quickly.
SELL is only reactive selling at strong resistance zones, not holding for long.

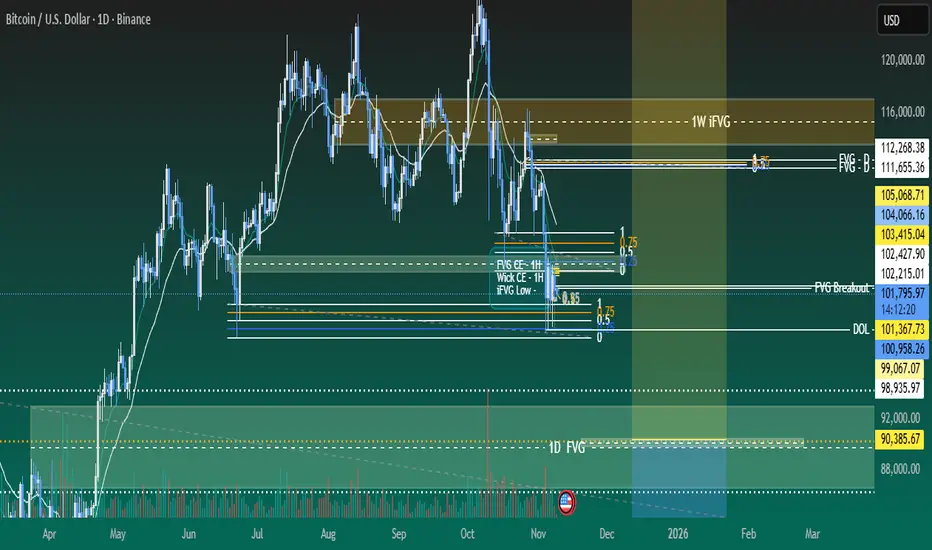
Weekly analysis BTC with 4R trade ideaLast weeks’ trade has performed well and already moved ~15K points and still going on. Further to this week analysis, we expect good reversal trade from the zone of 89700 to 90385. Still we have ~11k points movement pending to reach to this level. Price would be showing weakness in sell side and reversal pattern. We should patiently wait for entry model and confirmation as price is in sell side.
1. 1D FVG and wick is creating strong cluster of their relevant CE levels.
2. We would see exaction in sell side movement and reversal pattern.
3. RSI will also show oversold or bearish divergence on HTF.
4. Most probably price will take liquidity of FVG and create MSS/CISD/TS/iFVG in LTF.
5. Price should show rejection/reversal in respective LTF (1H/15m) at FVG zone.
6. Take the trade only once clear entry model i.e. turtle soup. iFVG break, CDS or MSS happens on LTF
All these combinations are signalling a high probability and ~4R trade scenario.
Note – if you liked this analysis, please boost the idea so that other can also get benefit of it.
Also follow me for notification for incoming ideas.
Also Feel free to comment if you have any input to share.
Disclaimer – This analysis is just for education purpose not any trading suggestion. Please take the trade at your own risk and with the discussion with your financial advisor.
,
XAUUSD – Intraday H1 Plan Range-Bound Volatility(November 5, 2025)
🌐 MARKET CONTEXT
Gold is trading within a narrow range around ₹3,963 – ₹4,015, showing indecision between safe-haven demand and short-term profit-taking pressure.
After the previous New York session, price created a new local low near ₹3,962.92, then quickly rebounded as dip buyers stepped in.
However, the ₹4,015–₹4,020 zone remains a strong supply area, limiting further upside momentum.
Bias for today: Ranging with mild bullish potential
→ Prefer buying at lower supports and taking profits quickly near the ₹4,015–₹4,020 supply zone.
If price breaks below ₹3,962, deeper downside movement toward ₹3,945 may occur.
📉 TECHNICAL ANALYSIS (SMC + LIQUIDITY STRUCTURE)
Market Structure: On the H1 timeframe, XAUUSD is consolidating between the strong demand zone ₹3,962–₹3,965 and the supply zone ₹4,015–₹4,020, forming a clear sideways range.
Liquidity Map:
Below ₹3,962 lies heavy sell-side liquidity, which Smart Money may sweep before a reversal.
Above ₹4,015–₹4,020 sits buy-side liquidity, serving as the next liquidity target if a breakout occurs.
🔑 KEY PRICE ZONES
Zone Type Price Range Description
Supply Zone ₹4,015 – ₹4,020 Short-term supply zone, likely to trigger sell reactions
Order Block ₹4,010 – ₹4,008 Quick reaction zone during London session
FVG zone ₹3,956-₹3,960 as a retest reaction area to look for confirmed Buy setups if the higher-timeframe trend remains bullish, or Sell on retest if price breaks below this zone
Deep Demand - OB ₹3,935 – ₹3,940 Deep buy zone, for liquidity sweep setups
⚙️ TRADE SETUPS
✅ BUY SCENARIO 2 – OB Reaction Entry
Entry: ₹3,935 – ₹3,934
Stoploss: ₹3,928
TP1: ₹3,970
TP2: ₹4,000
Logic: Price may sweep liquidity below the FVG and mitigate the H1 Bullish Order Block (₹3,935–₹3,944); if CHoCH/BOS confirms reversal, enter buy targeting the previous imbalance and liquidity above ₹4,000.
✅ BUY SCENARIO 2 – FVG Rebalance Entry
Entry: ₹3,955 – ₹3,954
Stoploss: ₹3,948
TP1: ₹3,985
TP2: ₹4,015
Logic: Price retraces to fill the ₹3,955–₹3,954 H1 FVG within the discount zone; if bullish CHoCH/BOS confirms a reversal, execute buy entry targeting liquidity above recent highs.
🔻 SELL SCENARIO – From Short-Term Supply Zone
Entry: ₹4,011 – ₹4,009
Stoploss: ₹4,017
TP1: ₹3,990.000
TP2: ₹3,965.000
Logic: Price reaches supply zone, forms rejection or bearish engulfing → valid short setup within range.
⚠️ SCALPING SELL – Quick Reversal Opportunity
Entry: ₹4,020 – ₹4,022
Stoploss: ₹4,028
TP: ₹4,000.000 – ₹3,985
Logic: If price spikes to ₹4,020–₹4,022 sweeping buy-side liquidity and quickly rejects → short scalp opportunity.
🧠 NOTES / SESSION PLAN
Focus on London and New York sessions when liquidity is highest.
Wait for H1 candle confirmation (wick, retest, or CHoCH) before entering any trade.
Avoid trading just because price touches the zone — confirmation is key.
Risk management: limit exposure to ≤1% per trade; maintain at least a 1:2 RR ratio.
When price approaches entry zones, use M15 timeframe to confirm structure and momentum before executing.
🏁 CONCLUSION
Within the ₹3,962.92 – ₹4,015.04 range, XAUUSD is consolidating tightly.
→ Prefer buying near ₹3,965–₹3,963 upon confirmation, or deep buys at ₹3,958–₹3,956 after liquidity sweep.
→ Conversely, if price rallies to ₹4,015–₹4,020 and shows rejection signals, short opportunities may arise.
Trade according to structure, wait for confirmations, and manage risk strictly to avoid stop-hunts.

Gold (XAU/USD) Sell Trade Analysis1. Technical Rationale for a Sell (Short) Setup
Rejection from All-Time Highs (ATH): Gold recently printed an all-time high around $4380. The sharp, rapid reversal from this level is a classic sign of profit-taking and potential exhaustion in the immediate uptrend, often forming a possible Double Top on the higher timeframes (e.g., 4-Hour, Daily).
Trendline Break: The recent sell-off broke below a significant ascending trendline/channel on intraday and possibly 4-hour charts, signaling a near-term shift in market structure from bullish to bearish.
Key Resistance Test: The price is currently finding resistance near the previous key support and psychological round numbers that were broken during the recent sharp drop. This zone is a likely area for sellers to re-enter the market.
2. Trade Setup Details
Parameter Recommended Zone (Approx.) Rationale
Entry Zone (Sell Limit/Market) $4200 - $4225 This is a major psychological and former support area. It also aligns with the "Neckline" of the potential Double Top pattern and key structural resistance from which the previous drop initiated.
Stop Loss (SL) $4240 - $4250 Placing the SL safely above the main short-term resistance and the high of the current pullback, which would invalidate the immediate bearish outlook.
Target 1 (TP1) $4100 - $4095 This level represents the low of the initial sharp sell-off (the Double Top's neckline) and a key psychological round number, which is a common immediate target for profit-taking.
Target 2 (TP2) $4020 - $4000 A break below TP1 clears the path to the major psychological support at $4000. This also aligns with the typical "Measured Move" target of the Double Top pattern.
Export to Sheets
3. Key Levels to Watch
Level Type Significance
Immediate Resistance $4225 High of the current bounce/re-test area.
Critical Resistance $4380 All-Time High (ATH) and top of the potential Double Top. A close above this invalidates all bearish structure.
Immediate Support $4100 Key psychological and structural support (Neckline).
Major Support $4000 Major psychological round number, a long-term anchor.
Export to Sheets
4. Risk Management Note
The overarching long-term trend for Gold is still considered bullish due to global economic uncertainty and central bank rate cut expectations. This Sell Trade is a counter-trend or short-term correctional trade.
Only enter with confirmation (e.g., a bearish candlestick rejection on a lower timeframe like 1-Hour or 4-Hour once the price hits the entry zone).
Risk Management is paramount: Do not risk more than 1-2% of your capital on this single trade\
Disclaimer: Trading is highly risky. This analysis is for informational purposes and is not financial advice. Always use a Stop Loss and manage your risk.

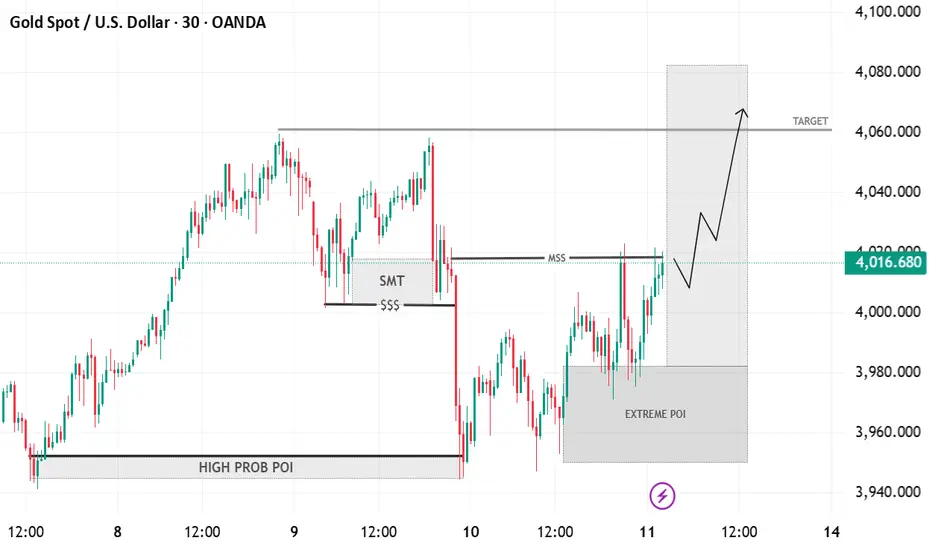
Gold–Bullish Reversal Setup from Extreme POI Toward 4060 TargetTimeframe: 30-minute chart (XAU/USD – Gold Spot vs U.S. Dollar)
Market Structure:
Price made a structural low (SMT) around the $$$ liquidity zone.
A Market Structure Shift (MSS) occurred as price broke above short-term highs.
POI (Point of Interest) Zones:
High Probability POI: Previous accumulation zone that caused a bullish impulse.
Extreme POI: Current demand zone (around 3960–3980), where price is rebounding.
Current Price Action:
Price has reacted bullishly from the Extreme POI.
The breakout above MSS signals possible continuation to the upside.
Target Zone:
The shaded grey target area (~4060–4080) aligns with previous liquidity highs.
Bias:
Bullish short-term bias toward 4060–4080 zone, assuming the demand zone holds.
Break below Extreme POI would invalidate the setup and suggest deeper retracement.
“XAU/USD 1H – Bullish Continuation from Demand Zone Key Observations:
Uptrend Structure:
Price has been consistently making Higher Highs (HH) and Higher Lows (HL), confirming an overall bullish market structure.
Break of Structure (BOS) levels confirm continuation of the trend.
Market Structure Shift (MSS):
Recently, price created a short-term shift downward (MSS) but retraced into a POI zone (demand area) near 3,646 – 3,659.
Current Setup:
The price bounced from the POI zone and is now recovering upward.
A long position was marked with entry near 3,659, Stop Loss at 3,646, and Target around 3,709.
Bias:
As long as price holds above 3,646 (POI zone), bullish continuation is favored.
If broken below 3,646, bearish correction could extend further.

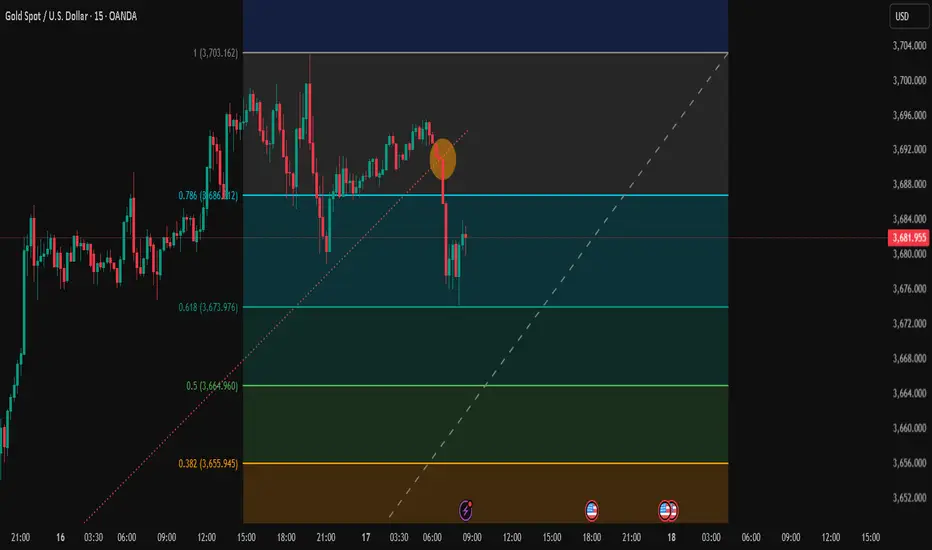
Trading Analysis for Gold Spot / U.S. Dollar (15-Minute Chart)Sell XAU/USD now at 3688.00 level and take a stop loss of 3703.00 and the targets will be as follows.
Entry range 3691.00 to 3687.00
Take Profit 1 = 3673.00
Take Profit 2 = 3665.00
Take Profit 3 = 3655.00
Take Profit 4 = 3645.00
Stock Loss 3703.00
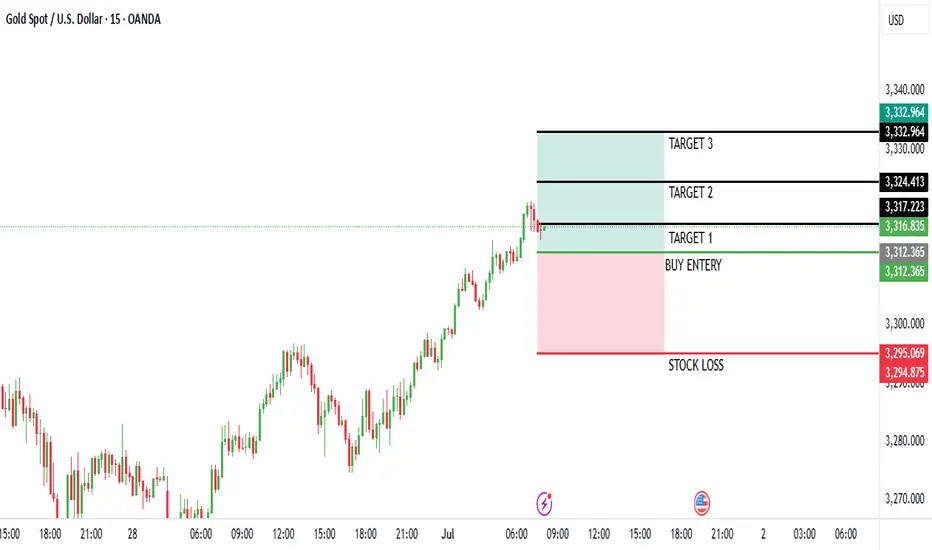
Based on the provided 15-minute chart for Gold Spot / U.S. Dollar (XAU/USD), published by NaviPips on TradingView.com on June 30, 2025, at 17:53 UTC, here’s a suggested trading setup for a buy position:
Current Price and Trend: The current price is 3,241.875, with a slight increase of +0.250 (+0.01%). The chart shows a recent downtrend that appears to be stabilizing near the current level, suggesting a potential reversal point.
Buy Entry: Enter a buy position at 3,312.875 (current price), as it aligns with a support zone where the price has found a base, indicated by the horizontal dashed line and recent consolidation.
Stop Loss: Place a stop loss at 3,295.250, below the recent low, to protect against further downside. This level is approximately 10.625 points below the entry, defining the risk.
Take Profit Levels:
Take Profit 1: 3,317.875, a conservative target about 20.000 points above the entry, aligning with a minor resistance zone.
Take Profit 2: 3,324.750, a mid-range target approximately 31.875 points above the entry.
Take Profit 3: 3,332.500, a deeper target about 45.625 points above the entry, indicating a potential trend reversal.
Price Action: The chart indicates a downtrend with a possible bottoming pattern near the current level. The support zone and upward candlestick suggest a buy opportunity if the price holds.
Risk-Reward Ratio: The distance to the stop loss (10.625 points) compared to the take profit levels (20.000 to 45.625 points) offers a favorable risk-reward ratio, ranging from approximately 1:1.9 to 1:4.3.
Conclusion
Enter a buy at 3,241.875, with a stop loss at 3,295.250 and take profit levels at 3,317.875, 3,324.750, and 3,332.500. Monitor the price action for confirmation of an upward move, and be cautious of a potential continued downtrend if the price breaks below the stop loss level. (Note: I assume "take profot" was a typo for "take profit" and have corrected it accordingly.)
Trading Analysis for Gold Spot / U.S. Dollar (15-Minute Chart)Buy XAU/USD now at 3644.00 level and hold at 3631.00 and target will be specific.
Entry Range 3642.00 to 3644.00
Take Profit 1 = 3646.00
Take Profit 2 = 3650.00
Take Profit 3 = 3654.00
Take Profit 4 = 3658.00
Stock Loss 3631.00
Key News Timings Chart Per.
i will try to update continue.

Trading Analysis for Gold Spot / U.S. Dollar (15-Minute Chart)Sorry I am late in giving the signal but I will say that manipulation in XAU/USD is at extreme level. Keep portfolio at least $1000.
Take buy position in XAU/USD as much as possible.
Not more than $3630.00.
Target 1 3353.00
Target 2 3358.00
Target 3 3365.00
Target 4 3372.00
SL 3630.00
Based on the provided 15-minute chart for Gold Spot / U.S. Dollar (XAU/USD), published by NaviPips on TradingView.com on June 30, 2025, at 17:53 UTC, here’s a suggested trading setup for a buy position:
Current Price and Trend: The current price is 3,241.875, with a slight increase of +0.250 (+0.01%). The chart shows a recent downtrend that appears to be stabilizing near the current level, suggesting a potential reversal point.
Buy Entry: Enter a buy position at 3,312.875 (current price), as it aligns with a support zone where the price has found a base, indicated by the horizontal dashed line and recent consolidation.
Stop Loss: Place a stop loss at 3,295.250, below the recent low, to protect against further downside. This level is approximately 10.625 points below the entry, defining the risk.
Take Profit Levels:
Take Profit 1: 3,317.875, a conservative target about 20.000 points above the entry, aligning with a minor resistance zone.
Take Profit 2: 3,324.750, a mid-range target approximately 31.875 points above the entry.
Take Profit 3: 3,332.500, a deeper target about 45.625 points above the entry, indicating a potential trend reversal.
Price Action: The chart indicates a downtrend with a possible bottoming pattern near the current level. The support zone and upward candlestick suggest a buy opportunity if the price holds.
Risk-Reward Ratio: The distance to the stop loss (10.625 points) compared to the take profit levels (20.000 to 45.625 points) offers a favorable risk-reward ratio, ranging from approximately 1:1.9 to 1:4.3.
Conclusion
Enter a buy at 3,241.875, with a stop loss at 3,295.250 and take profit levels at 3,317.875, 3,324.750, and 3,332.500. Monitor the price action for confirmation of an upward move, and be cautious of a potential continued downtrend if the price breaks below the stop loss level. (Note: I assume "take profot" was a typo for "take profit" and have corrected it accordingly.)

XAUUSD Price Action Analysis Current Market Overview
Price is trading at 3,371.67 🟢, showing bullish momentum after bouncing from the highlighted support zone (purple box).
The support zone (3,358 – 3,348) is currently holding strongly, converting old resistance into support 🔄.
🔑 Key Levels to Watch
Support Zone (3,358 – 3,348) 🛡️ → Price respected this area, confirming it as a demand zone.
Immediate Support: 3,358.65 🟪
Secondary Supports: 3,348.60 📉 | 3,325.99 📉 | 3,311.63 📉
📈 Bullish Scenario
If buyers maintain momentum above 3,358, price may attempt a move toward 3,380+ 🚀.
Break above 3,380 could signal continuation to new highs 📊✨.
📉 Bearish Scenario
A strong break back below 3,358 could re-test 3,348 → 3,325 → 3,311 ⬇️.
Failure to hold support may trigger deeper correction.
✅ Professional Takeaway
Market sentiment is bullish as long as price stays above 3,358 support zone 🟩.
Traders may look for buy opportunities on dips near support with targets toward 3,380 – 3,390 🎯.
Watch price reaction closely at the purple zone for confirmation before entering.

XAUUSD – Gold getting ready for a big breakout!Gold is moving exactly as expected: consolidation – breakout – consolidation again. Right now, price is forming a tight triangle pattern, showing strong pressure for the next move.
👉 With both technical setup and global macro headlines creating indecision, the market is waiting for a clear breakout. Once it happens, we can expect a strong trend in either direction.
🔑 Key Levels
Resistance: 3337 – 3343 – 3350 – 3356 – 3365
Support: 3325 – 3320 – 3314
📌 Buy Plan
Buy Zone: 3316 – 3314
SL: 3309
TP: 3320 – 3325 – 3330 – 3335 – 3340 – 3345 – 3350 – 3360 – 3370
📌 Sell Plan
Scalp Sell: 3348 – 3350
SL: 3355
TP: 3344 – 3340 – 3335 – 3330
Sell Zone: 3365 – 3367
SL: 3372
TP: 3360 – 3355 – 3350 – 3345 – 3340
🎯 MMFLOW Note
The tighter the range, the stronger the breakout.
Always prepare for both bullish & bearish scenarios.
Wait for confirmation at the Key Levels before taking positions.

Gold Pulls Back as Expected, Long-Term Buying Opportunity Ahead🟡 XAUUSD 24/07 – Gold Pulls Back as Expected, Long-Term Buying Opportunity Ahead
🧭 Market Overview
Gold dropped sharply from the 343x area, exactly as anticipated, after breaking the rising channel on the H1 chart and starting to sweep liquidity zones below.
Key factors influencing price action today:
Global markets are awaiting the final outcome of US-EU-China tariff negotiations.
Focus now shifts to next week’s FOMC meeting, where talks of potential rate cuts are intensifying.
Tonight’s PMI and Jobless Claims from the US could introduce unexpected volatility.
📊 Technical Outlook
While the broader trend remains bullish on D1 and H4 timeframes, the short-term H1 chart shows a clear break in structure. Price is currently exploring key FVG zones and OBS levels below.
If these liquidity zones are fully filled, it could set up a highly attractive long-term BUY opportunity, especially as markets price in future Fed rate cuts.
🎯 Today’s Trading Strategy
📌 Short-Term SELL Opportunity
→ Look for early entries at resistance zones, but only with proper confirmation.
📌 Long-Term BUY Setup
→ Target strong technical confluences at deeper levels. Be patient — focus on clean RR setups, don’t rush into early longs.
🔎 Key Price Levels to Watch
🔺 Resistance Zones (Above):
3393 – 3404 – 3414 – 3420 – 3428
🔻 Support Zones (Below):
3375 – 3366 – 3352 – 3345 – 3330
🔽 Trade Scenarios
✅ BUY ZONE: 3352 – 3350
SL: 3345
TP: 3356 → 3360 → 3364 → 3370 → 3375 → 3380 → 3390 → 3400
🔻 SELL ZONE: 3414 – 3416
SL: 3420
TP: 3410 → 3406 → 3400 → 3395 → 3390 → 3380
⚠️ News Alert
Stay cautious with tonight’s US PMI and Jobless Claims releases — these could cause sharp spikes.
✔️ Use proper SL/TP
✔️ Avoid emotional trades
✔️ Let structure confirm before entries
📣 From MMF Team – Trade Smarter Together
If you find this analysis helpful and want more daily trading plans like this:
👉 Follow the MMF channel right here on TradingView — we deliver real, actionable market strategies, not just generic analysis.
🎯 Updated daily. Straight from the charts. Built for traders.

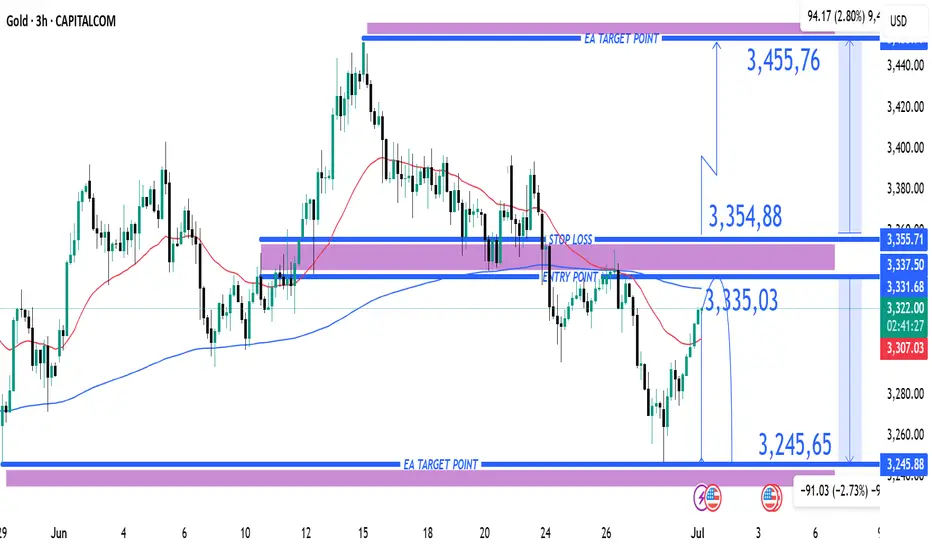
(XAU/USD) 3H Chart – Bearish Reversal Setup from Resistance Zone1. Entry Point (Sell):
Marked at 3,335.03
This is a key resistance level where price is expected to reverse downward.
2. Stop Loss:
Placed above at 3,354.88
This acts as a protection level in case the trade goes against the direction.
3. Take Profit Targets (EA Target Points):
TP1 (Downside): 3,245.65
TP2 (Upside - if Stop Loss is hit): 3,455.76 (in case of reversal or long position)
4. Price Action Observation:
Price is currently around 3,320.56, climbing back toward the entry zone.
The red 50-period moving average (EMA) and blue 200-period MA show convergence, often preceding volatility.
---
📉 Bearish Scenario (Main Setup)
Sell Bias is expected from the 3,335 region.
If price respects the resistance zone and breaks down again, the target is 3,245.65, yielding approximately 90-point move.
This is a risk-reward favorable setup, with:
Risk: ~20 points
Reward: ~90 points
RRR ≈ 1:4.5
---
⚠️ Bullish Invalidity (Stop Loss Hit)
If the price breaks and closes above 3,354.88, it invalidates the bearish setup.
Then, the market may shift towards targeting 3,455.76 — about 100 points to the upside.
---
🔧 Technical Factors Supporting the Setup
Supply zone marked by the purple box around the entry.
Trend previously bearish — recent upward move may just be a retracement.
Confluence with MAs: Price is testing MAs — rejection here would add bearish confirmation.
---
✅ Summary of Trade Setup
Element Value
Entry 3,335.03
Stop Loss 3,354.88
Take Profit 3,245.65
Alt Target 3,455.76 (if SL hit)
Risk-Reward ~1:4.5
Bias Bearish (Sell Setup)
Trade Setup – SELL GOLD (XAU/USD)✅ Trade Setup – SELL GOLD (XAU/USD)
📅 Date: July 7–10, 2025
🕒 Timeframe: 1H (Hourly)
🎯 Trade Parameters:
Sell Entry Zone: 3,322 – 3,330 USD/oz (previous support turned resistance + MA20 + Fibonacci 0.236)
Stop Loss (SL): 3,336 USD (above local resistance and moving average)
Take Profit (TP):
• TP1: 3,260 USD (near Fibonacci 0.618 and historical support)
• TP2: 3,168 – 3,160 USD (deeper support zone and Fibo 0.786)
📊 Technical Analysis:
Price has broken the short-term ascending trendline and is testing from below — suggesting a potential bearish continuation.
Recent candles closed below the 20 & 50-period moving averages, showing weak upside momentum.
Volume rises during bearish moves, and shrinks on retracements — indicating sellers are in control.
Bollinger Bands are expanding downward, confirming momentum is building to the downside.
🧭 Trading Strategy:
Wait for price to retest the 3,322–3,330 zone with bearish confirmation (e.g., engulfing, pin bar).
Partial take profit at 3,260, and hold remainder for TP2 if breakdown continues.
Place strict SL at 3,336 to minimize risk if resistance breaks.

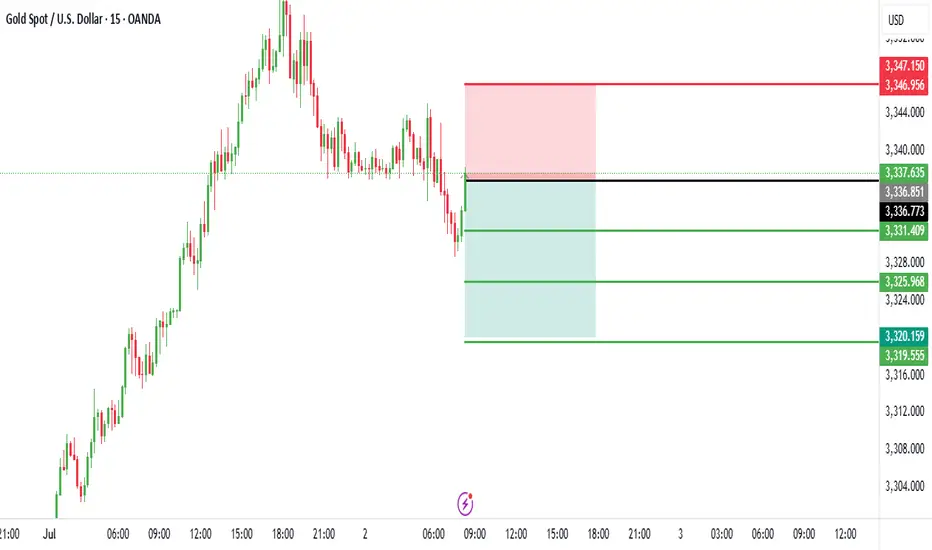
Trading Analysis for Gold Spot / U.S. Dollar (15-Minute Chart)Based on the provided 15-minute chart for Gold Spot / U.S. Dollar (XAU/USD) and the specified data, here’s a suggested trading setup for a sell position:
Current Price and Trend: The current price is not explicitly provided, but the entry price is set at 3,336.00. The chart suggests a potential resistance zone near this level, with a recent uptrend showing signs of exhaustion.
Sell Entry: Enter a sell position at 3,336.00, aligning with the specified entry price where the price may face rejection due to resistance.
Stop Loss: Place a stop loss at 3,346.00, above the recent high, to protect against an upward breakout. This level is 10.00 points above the entry, defining the risk.
Take Profit Levels:
Take Profit 1: 3,331.00, a conservative target 5.00 points below the entry.
Take Profit 2: 3,326.00, a mid-range target 10.00 points below the entry.
Take Profit 3: 3,321.00, a deeper target 15.00 points below the entry, aligning with a potential support zone.
Price Action: The chart indicates a peak near the entry level, with a bearish reversal signal suggested by the candlestick pattern and resistance line.
Risk-Reward Ratio: The distance to the stop loss (10.00 points) compared to the take profit levels (5.00 to 15.00 points) offers a mixed risk-reward profile. Take Profit 2 and 3 provide a 1:1 and 1:1.5 ratio, respectively, making this a balanced short-term trade.
Conclusion
Enter a sell at 3,336.00, with a stop loss at 3,346.00 and take profit levels at 3,331.00, 3,326.00, and 3,321.00. Monitor the price action for confirmation of a downtrend, and be cautious of a potential upward move if the price breaks above the stop loss level.
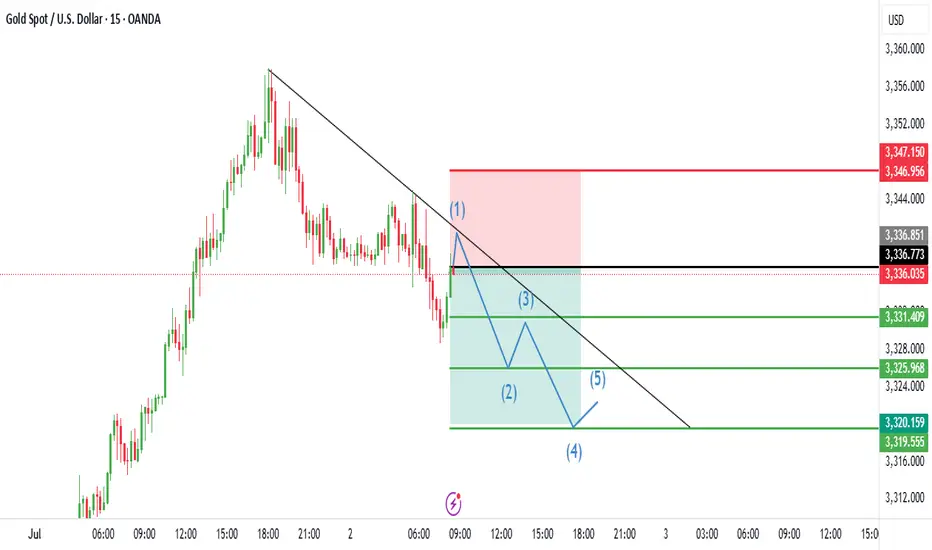
Trading Analysis for Gold Spot / U.S. Dollar (15-Minute Chart)
Based on the provided 15-minute chart for Gold Spot / U.S. Dollar (XAU/USD) and the specified data, here’s a suggested trading setup for a sell position:
Current Price and Trend: The current price is not explicitly provided, but the entry price is set at 3,336.00. The chart suggests a potential resistance zone near this level, with a recent uptrend showing signs of exhaustion.
Sell Entry: Enter a sell position at 3,336.00, aligning with the specified entry price where the price may face rejection due to resistance.
Stop Loss: Place a stop loss at 3,346.00, above the recent high, to protect against an upward breakout. This level is 10.00 points above the entry, defining the risk.
Take Profit Levels:
Take Profit 1: 3,331.00, a conservative target 5.00 points below the entry.
Take Profit 2: 3,326.00, a mid-range target 10.00 points below the entry.
Take Profit 3: 3,321.00, a deeper target 15.00 points below the entry, aligning with a potential support zone.
Price Action: The chart indicates a peak near the entry level, with a bearish reversal signal suggested by the candlestick pattern and resistance line.
Risk-Reward Ratio: The distance to the stop loss (10.00 points) compared to the take profit levels (5.00 to 15.00 points) offers a mixed risk-reward profile. Take Profit 2 and 3 provide a 1:1 and 1:1.5 ratio, respectively, making this a balanced short-term trade.
Conclusion
Enter a sell at 3,336.00, with a stop loss at 3,346.00 and take profit levels at 3,331.00, 3,326.00, and 3,321.00. Monitor the price action for confirmation of a downtrend, and be cautious of a potential upward move if the price breaks above the stop loss level.
Trading Analysis for Gold Spot / U.S. Dollar (15-Minute Chart)
Based on the provided 15-minute chart for Gold Spot / U.S. Dollar (XAU/USD), published by NaviPips on TradingView.com on June 30, 2025, at 17:53 UTC, here’s a suggested trading setup for a buy position:
Current Price and Trend: The current price is 3,241.875, with a slight increase of +0.250 (+0.01%). The chart shows a recent downtrend that appears to be stabilizing near the current level, suggesting a potential reversal point.
Buy Entry: Enter a buy position at 3,312.875 (current price), as it aligns with a support zone where the price has found a base, indicated by the horizontal dashed line and recent consolidation.
Stop Loss: Place a stop loss at 3,295.250, below the recent low, to protect against further downside. This level is approximately 10.625 points below the entry, defining the risk.
Take Profit Levels:
Take Profit 1: 3,317.875, a conservative target about 20.000 points above the entry, aligning with a minor resistance zone.
Take Profit 2: 3,324.750, a mid-range target approximately 31.875 points above the entry.
Take Profit 3: 3,332.500, a deeper target about 45.625 points above the entry, indicating a potential trend reversal.
Price Action: The chart indicates a downtrend with a possible bottoming pattern near the current level. The support zone and upward candlestick suggest a buy opportunity if the price holds.
Risk-Reward Ratio: The distance to the stop loss (10.625 points) compared to the take profit levels (20.000 to 45.625 points) offers a favorable risk-reward ratio, ranging from approximately 1:1.9 to 1:4.3.
Conclusion
Enter a buy at 3,241.875, with a stop loss at 3,295.250 and take profit levels at 3,317.875, 3,324.750, and 3,332.500. Monitor the price action for confirmation of an upward move, and be cautious of a potential continued downtrend if the price breaks below the stop loss level. (Note: I assume "take profot" was a typo for "take profit" and have corrected it accordingly.)