Gold (XAU/USD) Intraday Buy Setup with High Reward-to-Risk Ratio1. Entry Point Zone: Around 3,271.79 USD
This is identified as a potential buy entry area, marked in purple.
2. Stop Loss: Below the entry point at 3,257.71 USD
Risk management level in case the trade moves against the setup.
3. Target Point One: Between 3,313.75 and 3,317.07 USD
A short-term take-profit level, likely based on previous resistance.
4. Final Target (EA Target Point): Around 3,373.04 USD
A more ambitious take-profit, possibly based on a major resistance level or Fibonacci extension.
5. Trade Range:
Risk: 3,271.79 - 3,257.71 = 14.08 USD
Reward to First Target: ~42 USD
Goldsignals

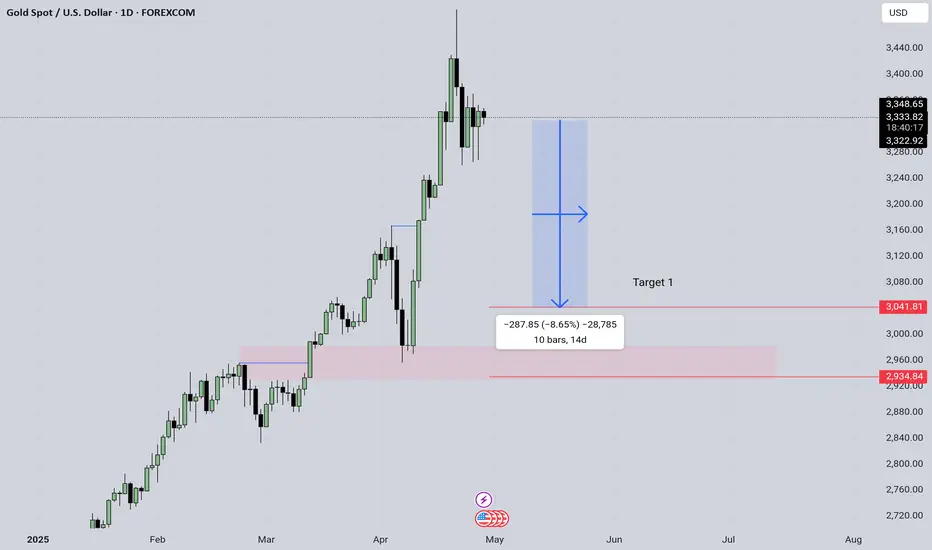
GOLD correction is coming (-8% fall)As per my analysis, gold is consolidating for days.
Even though currency move higher but gold didn't.
Trump tarriffs are cooling down , so gold will fall nearly -8% which is 3050 area.
Maybe it can fall below 3000 dollars per ounce.
Maybe next month dollar index may retrace a bit from the current fall.
So from all this information, I conclude GOLD may fall for couple of weeks.
This is for education purpose only.
Do your own research. Thanks for reading, leave your comment.
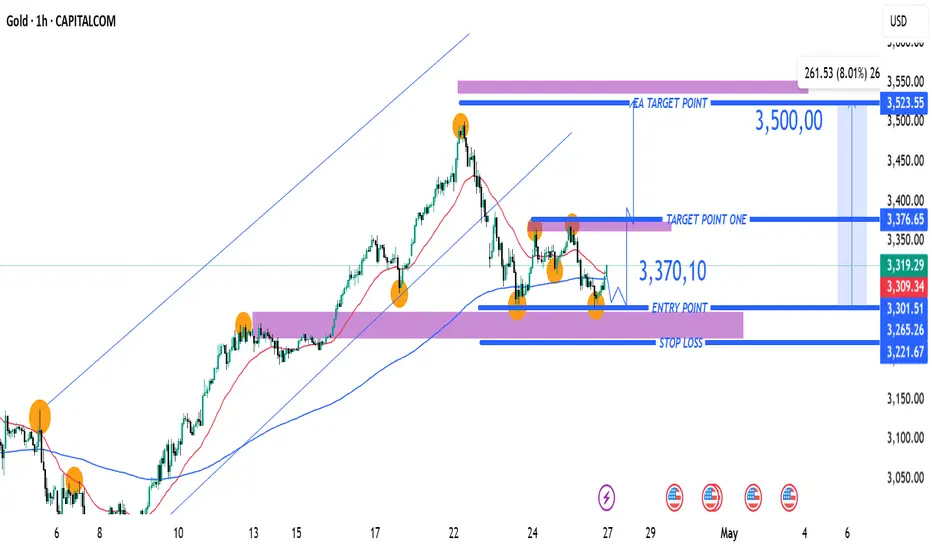
(XAU/USD) 1H Chart: Long Setup Targeting 3,500 with Key SupportEntry Point: Suggested near 3,301.51 USD (marked with the purple support zone).
Stop Loss Zone: Below 3,266.87 to 3,221.67 USD (marked in blue and purple). This is where you limit your loss if the trade goes wrong.
First Target (Target Point One): 3,376.65 USD.
Final Target (EA Target Point): 3,523.55 USD (~8.26% potential gain from entry).
Main Setup Idea:
The price is consolidating around the support zone.
There's a plan to buy (go long) at the purple zone (Entry Point) and aim for the two target points
Gold (XAUUSD) Trade Setup: Bullish Breakout Toward $3,637 TargeCurrent Price: $3,309.18
EMA 30 (Red Line): $3,265.00
EMA 200 (Blue Line): $3,163.35
Trend Direction: Strong uptrend (price above both EMAs)
Timeframe: 1-hour (short-term analysis)
📍 Key Levels
Entry Point: Around $3,266.63 (just above EMA 30)
Stop Loss: Around $3,265.00
Target (EA Target Point): $3,637.23
Potential Profit: +$365.01 or +11.16%
🔍 Technical Patterns & Zones
Rising Channel: Price is moving within a rising wedge or channel, indicating bullish momentum but with narrowing range — a potential reversal signal if broken.
Support Zone: Highlighted purple box around the entry point; likely a demand zone.
Resistance Zone: $3,637.23 area marked as the EA Target Point — previous resistance or Fibonacci extension level.
✅ Bullish Signals
Price is consistently making higher highs and higher lows.
EMAs are aligned in a bullish formation (short EMA above long EMA).
Clear breakout above consolidation range recently.
Trade setup shows favorable risk-to-reward ratio.
⚠️ Risks / Caution
Rising wedge can sometimes break down — watch for volume drop or divergence.
Potential pullback to the entry zone is expected (indicated by the arrow).
News Events: Symbols below the chart indicate upcoming USD economic data, which could bring volatility.
📈 Strategy Summary
Buy on pullback to $3,266.63 with tight stop at $3,265.00.
Target: $3,637.23 — potential 11% gain.
Risk: Minimal if stop is respected, tight stop-loss.

GOLD (XAUUSD) 15-Min Chart – Bearish Reversal Setup with Key EntPrice: $3,232.02 (at time of chart)
Trend: Price is consolidating near a resistance area after an upward move, with potential for a reversal.
🔍 Key Technical Levels
📈 Entry Point: $3,241.88
(Marked for a potential short entry)
🔻 EA Target Point (Take Profit): $3,187.70
This is the target for the short position; aligns with a strong previous demand zone and near the 200 EMA.
⛔ Stop Loss Zone: Above $3,243.48
Purple zone indicates the invalidation area for the short trade.
📉 Resistance Point: $3,229.87
(Red line, also the 30 EMA) – Important level where price is currently hovering.
🔵 Confirm Target Points: $3,223.04 & $3,218.25
Zones to watch for confirmation of downward momentum.
📘 EMA (30): $3,229.87
Acts as short-term dynamic resistance.
📘 EMA (200): $3,182.40
Acts as major support and long-term trend indicator. Also very close to the target area.
💡 Trade Idea Summary
Strategy: Short (Sell) from the resistance/entry point around $3,241.88.
Target: $3,187.70
Stop Loss: Above $3,243.48
Risk-Reward Ratio: Solid (approx. 1:2+ based on visual range)
🔎 Additional Notes
Price is testing resistance after forming a potential double top or lower high.
A breakdown below $3,223 could confirm bearish continuation.
Watch for confirmation candles on 15m or 1h before entering

Gold (XAU/USD) 15-Min Short Setup: Bearish Reversal from ResistaEntry Point: $3,127.10
Stop Loss: $3,141.53
Target Point (Take Profit): $3,080.62
Technical Indicators:
EMA 30 (red line): $3,111.98 – showing short-term trend
EMA 200 (blue line): $3,056.92 – showing long-term trend
Setup Explanation:
This is a short/sell setup based on the following:
The price action has hit a resistance zone near $3,127 and shows signs of rejection.
The setup assumes that the price will reverse from this zone and head lower.
The Risk-to-Reward Ratio appears decent, aiming for a move of about -1.45% (-$45.34).
Current Status:
Price is currently around $3,119.69, below the entry point.
A slight bounce

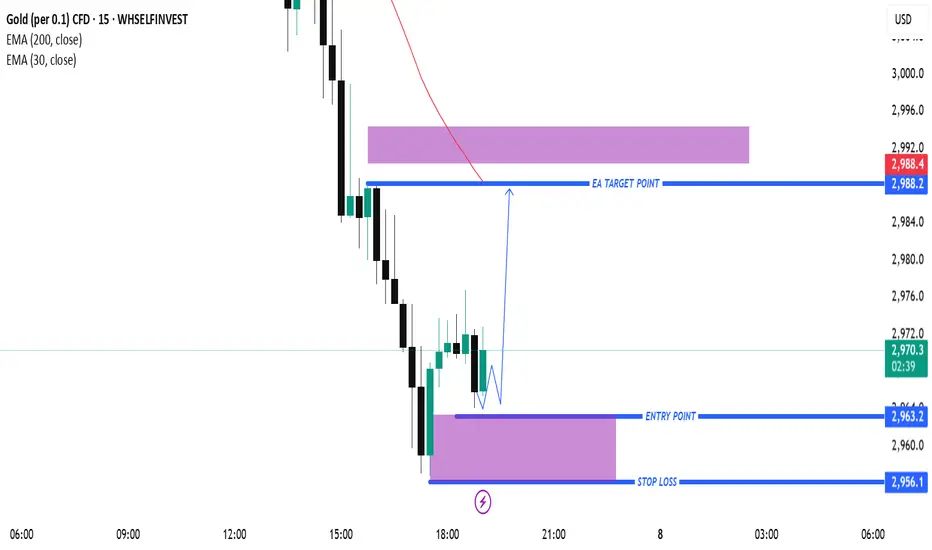
Gold (XAU/USD) Intraday Buy Setup – Demand Zone Reversal with 3.Timeframe: Appears to be intraday (possibly 5-15 minutes).
Indicators:
EMA 30 (red): Showing recent bearish momentum.
EMA 200 (blue): Positioned above, indicating a longer-term bearish trend.
Candlestick Pattern: After a steep drop, price shows signs of consolidation and potential reversal.
📌 Trade Setup (Long/Bullish Bias)
Entry Zone: Around $2,963.2
Price is expected to pull back into this purple demand zone before moving up.
Stop Loss (SL): $2,956.1
Placed below the support zone to limit downside risk.
Take Profit (TP / Target Point): $2,988.2
A previous supply zone near the EMA 30, where selling pressure could return.
📊 Risk-Reward Ratio
Risk: $2,963.2 - $2,956.1 = $7.1
Reward: $2,988.2 - $2,963.2 = $25
RRR (Reward-to-Risk Ratio): ~3.5:1
This is a solid ratio, suggesting a high-potential trade if the setup plays out.
📈 Bullish Scenario
Price pulls back into the demand zone (entry).
A bullish candlestick confirmation or wick rejection could trigger a buy.
Target is the previous structure + EMA zone.
Gold (XAUUSD) Reversal Setup: Buy Opportunity from Demand Zone t GOLD (XAUUSD)
Timeframe: 30-minute
Indicators:
EMA 30 (Red): 3,000.22
EMA 200 (Blue): 3,042.92
🔍 Price Action & Zones
Current Price: 2,982.27
Support Zone (Demand Zone): ~2,940.27 (highlighted in purple, labeled as STOP LOSS)
Resistance Zone (Supply Zone): ~3,040.17–3,042.92 (labeled as EA TARGET POINT)
📈 Trade Idea (Based on Drawing)
Strategy: Buy from demand zone, targeting supply zone
Entry: Near 2,940.27
Stop Loss: Slightly below 2,940.27
Target: ~3,040.17
Risk to Reward: ~1:2.6 (visually)
📊 EMA Dynamics
Bearish Bias in the Medium Term: Price is trading below the 200 EMA, indicating an overall bearish trend.
Short-Term Weakness: The price has also dropped below the 30 EMA, confirming bearish momentum in the short run.
🔄 Possible Scenario
Price is currently heading back down toward the demand zone, where a bounce is anticipated.
If it respects that zone, we may see a reversal toward the target zone at ~3,040.
If it breaks below 2,940, the setup would be invalidated (stop loss hit).
⚠️ Things to Watch
Rejection or support confirmation at 2,940 zone is key before entry.
Be cautious of continued bearish momentum if economic news or global risk sentiment shifts.
Look for bullish reversal patterns (e.g. hammer, bullish engulfing) at the demand zone for confirmation.

GOLD (XAUUSD) 30-Min Chart Analysis – Key Reversal & Breakout Zo200 EMA (blue): 3085.72 (bearish as price is below it)
30 EMA (red): 3033.52
Current Price: 3034.10
🟪 Key Zones (Highlighted in Purple)
Resistance Zone: Around 3045.54–3065.70
Support Zone: Around 2968.27
Previous High Zone / Target Area: 3158.42
📉 Short Trade Setup (Blue Arrow Going Down)
Entry Area: If price rejects the resistance zone around 3045–3065
Stop Loss: Above the zone, around 3065.70
Take Profit: At the support zone, 2968.27
Risk-to-Reward: Approx. 2.4x (shown as -2.43%)
📈 Long Trade Setup (Blue Arrow Going Up)
Entry Area: If price breaks and holds above the 3065.70 zone
Stop Loss: Below 3045.54 zone
Take Profit: 3158.42 (previous resistance)
Risk-to-Reward: Approx. 3.0x (shown as 3.00%)
💡 Analysis Summary
Price is currently ranging just below the resistance zone.
Two possible scenarios:
Rejection from the zone → short entry.
Breakout above zone → long opportunity.
Use EMA alignment for confirmation:
Bearish if price stays below both EMAs.
Bullish if price breaks above 200 EMA (3085.72).

Gold (XAU/USD) Technical Analysis: Key Resistance Test Before BrThis chart represents a Gold (XAU/USD) 30-minute timeframe analysis from TradingView. Here are the key takeaways:
Technical Indicators & Levels
Exponential Moving Averages (EMAs)
200 EMA (Blue Line): 3,110.97 – A long-term trend indicator.
30 EMA (Red Line): 3,134.65 – A short-term trend indicator.
Key Levels
Resistance Point: Around 3,136.56.
Support Zone (Stop Loss Level): 3,103.16.
Target Point: 3,167.44, indicating a potential 1.62% upside.
Potential Trade Setup
Scenario 1 (Bullish Case):
If price breaks above resistance (3,136.56) and holds, the next target is 3,167.44.
A bullish breakout could indicate further momentum.
Scenario 2 (Bearish Case):
If price fails to break resistance and drops, it could test the support zone around 3,103.16.
A break below this level might lead to further downside.
Pattern Analysis:
The chart suggests a potential retest of resistance before a breakout.
A possible accumulation phase before a strong move.
Conclusion
Bullish above 3,136.56, targeting 3,167.44.
Bearish below 3,103.16, watching for downside risk.
The 200 EMA (3,110.97) could act as dynamic support.

Gold (XAUUSD) 30-Minute Trade Setup: Bullish Reversal from SuppoThis chart represents a trading analysis for Gold (XAUUSD) on a 30-minute timeframe. Here are the key points from the chart:
Technical Indicators:
EMA (30, close) - Red Line: 3,124.52 (shorter-term trend)
EMA (200, close) - Blue Line: 3,090.41 (longer-term trend)
Trade Setup:
Entry Point: 3,108.21
Stop Loss: 3,098.52 (just below the support zone)
Target Point: 3,149.04 (potential profit level)
Analysis:
The price is currently bouncing from a purple support zone, which aligns with a short-term retracement.
The 30 EMA (red) is currently above the price, indicating short-term resistance.
The 200 EMA (blue) is significantly lower, showing that the overall trend is still bullish.
A potential long (buy) trade is suggested, as price is expected to reverse from the support level towards the target point of 3,149.04.
Risk-to-Reward Ratio:
The stop loss is set below the key support level to minimize risk.
The target price provides a significant profit potential.
Conclusion:
If price holds above 3,108.21, there is a strong bullish case.
If price breaks below 3,098.52, the bullish setup may become invalid.
Monitoring the 30 EMA resistance will be crucial for confirmation.

Gold (XAUUSD) Bullish Trade Setup: Demand Zone Entry & Target PrThis is a gold (XAUUSD) trading chart from TradingView, showing a technical analysis setup on the 1-hour timeframe.
Key Observations:
Uptrend: The chart shows a strong bullish trend, with price making higher highs and higher lows.
Demand Zone (Entry Point):
A highlighted yellow zone around $3,121.38 indicates a demand area where price is expected to bounce.
This could be a support level or a key order block.
Stop Loss: Placed at $3,112.40, below the demand zone, to minimize risk in case the trade fails.
Target Point:
Set at $3,177.94, which is 1.69% above the entry point.
The expected reward is 52.77 points.
Risk-Reward Ratio: This setup follows a risk-reward strategy, aiming for a potential gain significantly higher than the risk taken.
Trading Strategy:
If the price retraces into the demand zone, a long position (buy) is expected.
A bounce from this zone could lead to a price surge towards the target.
If price falls below the stop-loss level, the trade is invalidated.
Conclusion:
This is a bullish setup relying on a pullback to a key support zone before continuation. Traders may monitor price action in the yellow zone for confirmation before entering a trade

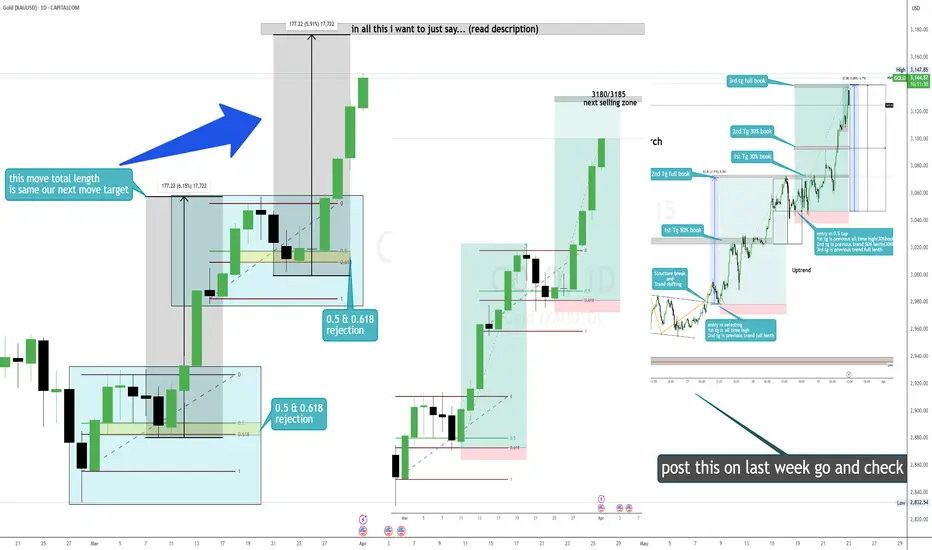
My gold target is 3177/3183 because(read description)Hello
It's a jayesh balar.
(this was not only i tell you after this happen i tell you this 3 4 days ago and gave a trade and all trade hit target)
my gold next target is 3177/3183 because if you see gold chart in 1day time frame in this bullish trend gold 25 to 28 feb trying to go down but its not happen and then you see next move 3 to 5 march move and consider as a swing and put fib and see market got rejection on 0.5/0.618 level and gave 177 point up move.
so as of you all know "MARKET ALLWAYS REPEAT HISTORY"
in this up trend next 14 to 19 march consider as a swing and put fib you see market still got rejection on 0.5/0.618 level so in this time our next target same as previous trade total move.
i am just trying to tell anyone say anything don't believe market is still bullish and continue his up trend so go with flow and grab this opportunities.
If you have a any "Questions"
Ask me in comment
If my analysis is helpful,
press booster bottom.
Gold (XAUUSD) 15-Minute Chart Analysis: Bullish Setup with Key SGold (XAUUSD) 15-Minute Chart Analysis
Key Technical Indicators:
Current Price: $3,122.28
30 EMA (Red Line): $3,115.90 (Short-term trend indicator)
200 EMA (Blue Line): $3,081.17 (Long-term trend indicator)
Support Zone: Around $3,106.62
Target Point: $3,154.02
Analysis:
Trend:
The price is in an uptrend, as it is trading above both the 30 EMA and 200 EMA.
The 30 EMA is acting as dynamic support, showing strong buying interest at pullbacks.
Key Levels:
Support: $3,106.62 (marked in blue) is expected to hold as a key support level.
Resistance Zone (Previous Supply Area): Around $3,090-$3,100 (shaded purple) was previously a resistance zone but has now turned into support.
Target Level: $3,154.02 is the expected bullish target if the price respects the support zone.
Trade Setup:
Bullish Scenario: The price may pull back to the support zone (~$3,106.62) before bouncing higher towards the target.
Stop Loss: Below $3,106.62 to minimize risk.
Entry Point: A retest of the support area with bullish confirmation could provide an optimal entry for a long trade.
Risk Management:
Stop Loss: Set just below the support zone.
Reward-to-Risk Ratio: Favorable if targeting $3,154.02 with a stop at $3,106.62.
Conclusion:
The chart suggests a bullish outlook, with price expected to continue its upward momentum if support holds.
A breakout above $3,123 could further confirm bullish strength.
Caution: If the price breaks below $3,106, further downside movement toward the 200 EMA ($3,081.17) is possible.

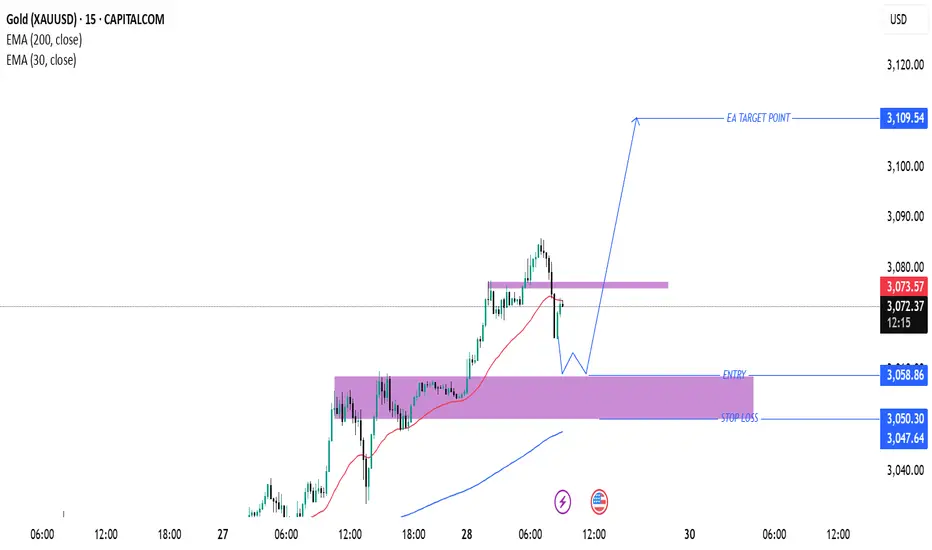
Gold (XAU/USD) Trade Setup & Analysis – March 28, 2025Gold (XAU/USD) Trade Analysis – March 28, 2025
Current Market Overview:
Price: $3,073.77
Recent High: $3,074.00
Recent Low: $3,070.29
EMA (30): $3,073.71 (Short-term trend)
EMA (200): $3,047.40 (Long-term trend)
Technical Analysis:
Support & Demand Zone:
The highlighted purple area represents a strong support zone around $3,050 - $3,058, where buyers may step in.
The price is currently pulling back into this area, indicating a potential bullish reversal opportunity.
Bullish Projection:
The chart suggests a retracement to the demand zone, followed by a strong bullish continuation.
A breakout from the minor resistance zone around $3,073 - $3,075 would confirm the uptrend.
Target & Stop Loss:
Entry Zone: Around $3,058.86 (near the demand zone).
Stop Loss: Below $3,047.40 (under the key support and EMA 200).
Target: $3,109.54 (significant resistance level and profit-taking point).
Trade Strategy:
Wait for confirmation of a bullish rejection at the support zone before entering.
If price breaks above the minor resistance, it could indicate momentum toward the target.
Risk-to-reward ratio looks favorable with a potential upside move of +50 points if the trend continues.
Conclusion:
The setup favors a bullish continuation after a pullback.
Key Levels to Watch: $3,058 (entry), $3,047 (stop loss), and $3,109 (target).
Traders should monitor price action at the demand zone before entering a long position.
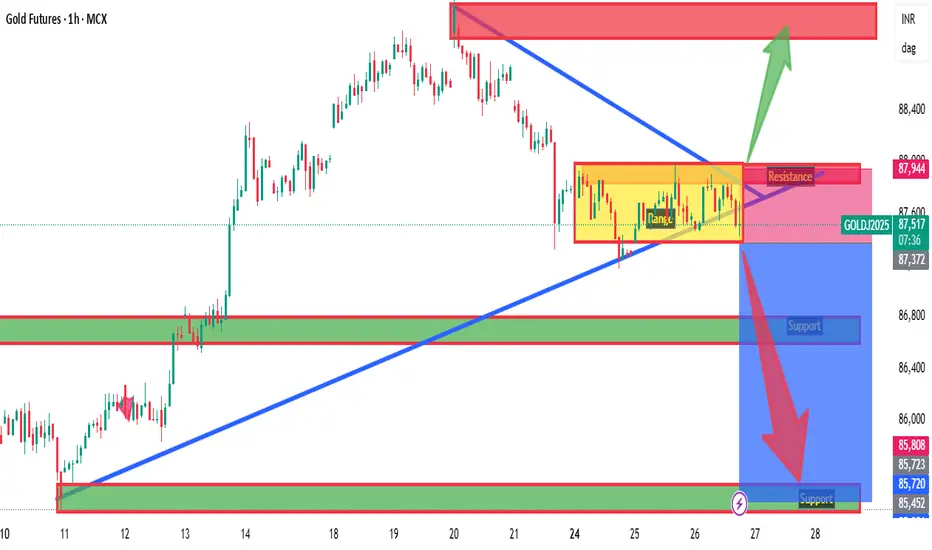
Gold Intraday Levels : 26 & 27-Mar-25
Gold Important zones mentioned on chart
Bearish < 87370
Bullish > 88000
Wait for Proper Rejection/Pattern :
@Support : Bullish
@Resistance : Bearish
*All views for educational purpose only
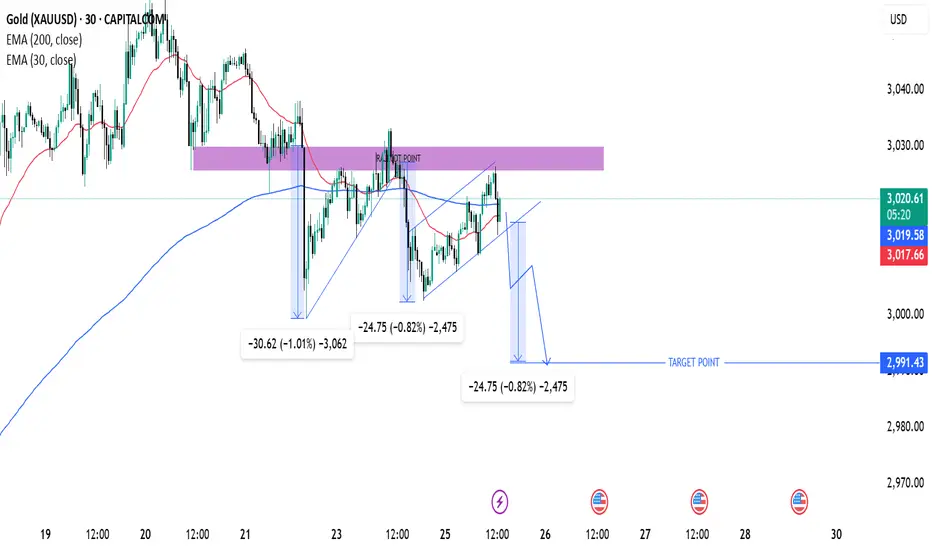
Gold (XAU/USD) Bearish Setup – Potential Drop to $2,991This is a trading setup for Gold (XAU/USD) on the 30-minute timeframe, showing a potential bearish move.
Analysis:
Key Indicators:
200 EMA (blue line) at 3,019.55: Acting as a resistance level.
30 EMA (red line) at 3,017.45: Providing short-term trend guidance.
Price Action & Structure:
The price previously rejected from a resistance zone (purple area) and started forming lower highs.
Repeated bearish patterns suggest another potential drop.
The chart highlights measured moves of previous declines (-30.62, -24.75), indicating a possible repeat of the pattern.
Trade Setup:
Bearish Outlook: Price is expected to drop towards the target point at 2,991.43.
Entry: Near the break of the lower trendline in the ascending wedge.
Target: 2,991.43 (marked as "TARGET POINT").
Risk Management: Ensure proper stop-loss placement above recent highs.
Conclusion:
If price respects the pattern, a downward move is likely.
A confirmed break below support could accelerate the drop.
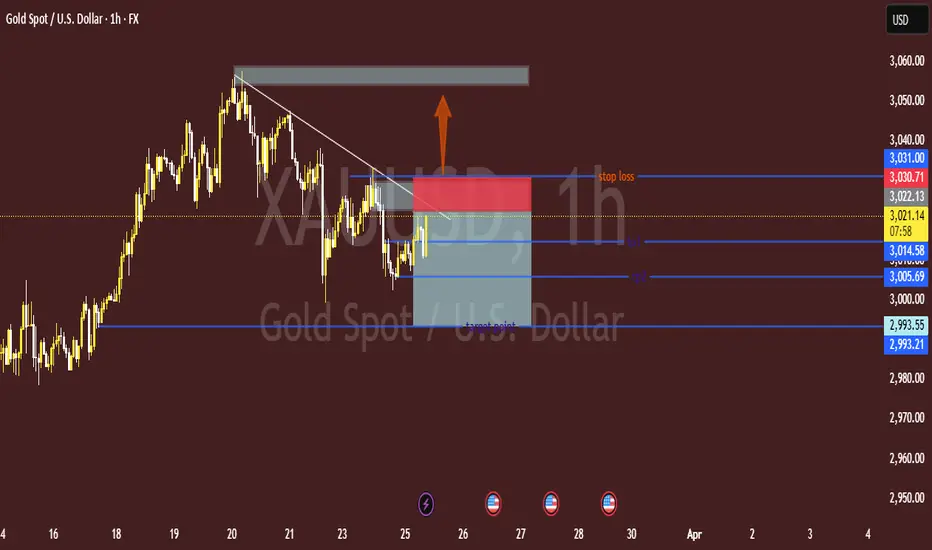
"XAU/USD (Gold) Potential Reversal Setup — Bullish Recovery or FAlright! Let's break down the chart analysis for XAU/USD (Gold vs. USD) 📊💛:
Structure & Trend:
The market is in a corrective phase after a clear downtrend. The trendline break shows potential bullish momentum.
Zone Analysis:
The gray box represents a supply zone (strong resistance). Price may struggle to break above this area.
The target points (TP1 and TP2) are likely support levels where price might react if it drops.
Trade Setup:
The blue box indicates the potential buy zone with a stop loss slightly below it.
The stop loss is set around 3,030.71 - 3,031.00, aiming to minimize risk.
TP1: 3,014.58 — Short-term target.
TP2: 3,005.69 — A more conservative, safer target.
Bias:
The bullish arrow suggests a possible move upward if the price can maintain above the current support.
📌 Conclusion:
If you plan to buy, wait for a strong bullish confirmation (like a bullish engulfing candle) before entering.
If price breaks the stop loss level, a deeper drop may occur toward 2,993.55 - 2,993.21.
Gold (XAU/USD) 15-Minute Analysis – Bearish Reversal from ResistThis chart is a 15-minute timeframe analysis of Gold (XAU/USD) using TradingView. Here's the breakdown of the analysis:
Key Levels & Setup:
Entry Zone (ENTRE): Around 3,004.172 - 3,003.999
Stop Loss (SL): 3,010.919 - 3,010.746 (Above the resistance zone)
Take Profit Targets:
TP1: 2,995.869
TP2: 2,987.219
TP3: 2,980.646
Technical Indicators:
Exponential Moving Averages (EMAs):
EMA 30 (Red Line): 2,992.313 (Short-term trend)
EMA 200 (Blue Line): 2,978.242 (Long-term trend)
Market Structure & Trade Idea:
The price is near a resistance zone (purple area), indicating a potential short-selling opportunity.
If the price fails to break above the resistance and reverses, it could drop toward the take profit levels.
The risk-to-reward ratio looks favorable, with the stop loss set just above resistance.
A break below the 30 EMA could further confirm bearish momentum toward 200 EMA.
Trade Execution Plan:
Short Entry: If the price respects the resistance area and starts to reject downward.
Stop Loss: Above the resistance at 3,010.919.
Take Profits: TP1, TP2, and TP3 as per the marked levels.
Conclusion:
Bearish Setup: If price rejects resistance.
Bullish Risk: If price breaks above resistance and holds, the trade setup is invalid.

GOLD TRADING POINT UPDATE > READ THE CHPATIANBuddy'S dear friend 👋
SMC Trading Signals Update 🗾🗺️ Gold Traders SMC-Trading Point update you on New technical analysis setup for Gold 🪙 list week profitable profomans reached target point 2961 ) New technical analysis setup for Gold 🪙 a short trend 📉 analysis setup. Guys 🤝 Gold 🪙 1 Time Frame 🪟 patterns chart 📉. Looking for selling zone ☺️ 🤝 FVG level 3006$ 2996$ rejected point below 👇 ⬇️ target point 2832 - 2818. ) again back 🔙 that entry buying said. Update you next analysis Guys 🤝 now follow it' good luck 💯
Key Resistance level 2996+ 3006
Key Support level 2832 - 2818
Mr SMC Trading point
Pales Support boost 🚀 analysis follow)

GOLD TRADING POINT UPDATE > READ THE CHAPTIAN Buddy'S dear friend 👋
SMC Trading Signals Update 🗾🗺 Gold Traders SMC-Trading Point update you on New technical analysis setup for Gold 🪙 💥 Gold Traders Gold 4 Time Frame. Tast diamond zone support level. Close above EMA ) indicator. ) SMC Trading point expect it. Bull 🐂 trend 📈 supply zone 2920 2930. This levels. Expect it selling Arya )
Key Resistance level 2920 + 2930
Key Support level 2852 - 2834
Mr SMC Trading point
Pales support boost 🚀 analysis follow)

GOLD TRDAING POINT UPDATE >READ THE CHAPTIAN Buddy'S dear friend 👋
SMC Trading Signals Update 🗾🗺️ Gold Traders SMC-Trading Point update you on New technical analysis setup for Gold 🪙. Gold Traders Gold 🪙) weekly 1D 4H Time Frame Candle) update. Gold Gold weekly basis analysis setup. Close above. ) and close below)
Weekly Time Frame Candle close above 2887) NEXT targets 2956 ) 1D candle close below 👇 ⬇️ 2873 Next target 2788
weekly TFM
4 TFM
Key Resistance level 2888+ 2940 + 2956
Key Support level 2834 - 2788
Mr SMC Trading point
Pales support boost 🚀 analysis follow)

GOLD TRADING POINT UPDATE > READ THE CHAPTIAN Buddy'S dear friend 👋
SMC Trading Signals Update 🗾🗺️ Gold Traders SMC-Trading Point update you on New technical analysis setup for Gold 🪙 Gold Traders Gold weekly Time Frame 🖼️ looking a good time for. Short Trade 😁. Also Goldman Sachs talk and 2025 if gold tast 3000$. Not for now weekly candle 🕯️ close below 👇 ⬇️ 2800 Next target 2538.
Key Resistance level 2900 + 2956
Support level 2800 - 2782 - 2706 - 2538
Mr SMC Trading point
Pales support boost 🚀 analysis follow)
