XAU/USD Range Market – Sell from PremiumGold is currently trading in a clear ranging (TR) environment after the recent bullish expansion. On the H1 timeframe, price has reacted from the premium zone near the previous highs, while liquidity remains stacked below the range.
🔻 Sell Scenario:
Price is expected to react from the 4303 – 4306 resistance zone, aligned with prior distribution and rejection. This area favors short-term sell opportunities while the market remains inside the range.
🔺 Buy Scenario:
The 4247 – 4245 zone represents a liquidity pocket below the major value area, offering a favorable risk-to-reward setup. With a tight stop-loss, buy limit orders are valid if price sweeps liquidity and shows reaction.
📌 Key Levels:
Resistance: 4303 – 4306
Support / Liquidity: 4247 – 4245
As long as price stays within the range, sell from premium and buy from discount remains the primary strategy. Always respect stop-loss levels and manage risk accordingly.
Goldtrade

XAUUSD (Gold) 15TF Technical Outlook - 22/12/2025 XAU/USD (Gold) maintains a strong bullish structure, with price trading near 4415–4420 and holding firmly above all major moving averages, confirming trend continuation. The primary BUY zone lies at 4410–4408, which is the key pivot, EMA cluster, and decision level for intraday and positional bulls. As long as price sustains above this buy zone, upside momentum remains intact, opening targets toward 4425, 4440, and the extended resistance area of 4460–4480.
On the bearish side, short-term selling pressure or profit booking may emerge near 4425–4440, but this remains corrective in nature. The key BEAR trigger level is below 4400, and stronger bearish confirmation appears only if gold breaks and sustains below 4385–4380, where the bullish structure weakens. A decisive breakdown below these levels could drag price toward 4360–4350, while a complete trend reversal is expected only below 4300. Overall, the market favors buy-on-dips above 4408, with bears gaining control strictly below 4380.

XAUUSD – LANA | Sell 4190–4194 and Buy 4100–4102 | 04/12 ...XAUUSD – LANA | Sell 4190–4194 and Buy 4100–4102 | 04/12
1. Fundamental Analysis
The current market sentiment is dominated by concerns about a global economic slowdown.
In a recession cycle, bond yields in the US and Europe tend to fall faster than in Japan, as these regions still have more room for rate cuts.
This results in:
A narrowing yield spread, causing USD/JPY carry trades to unwind.
Increased risk-off sentiment, pushing money back into JPY and safe-haven assets like gold.
If risk aversion strengthens further, USD/JPY may experience sharp declines rather than a slow drop.
Such volatility in the currency market often triggers strong swings in gold as well, providing better liquidity zones to trade — instead of chasing price at unfavourable levels.
2. Technical Analysis
On the H1 chart, gold is currently being squeezed between two major trendlines:
Upper descending trendline: drawn from the 4,245–4,260 highs, indicating sellers are active whenever price touches this line.
Lower ascending trendline: extending from the previous month’s low, acting as support for the medium-term uptrend.
Key zones on the chart:
Timing zone 4190–4194:
Near the descending trendline + previous volume cluster.
This is Lana’s preferred short-term Sell zone.
Buy zone at POC – VAL (Volume Profile):
A price area where strong trading activity occurred previously — potential buying interest if price corrects deeper.
Buy Liquidity Zone 4100–4102:
Located just above the major ascending trendline.
An attractive liquidity zone for trend-continuation buys if the market flushes downward.
Summary:
Price may first retrace to 4190–4194 and weaken from there.
If price drops to 4100–4102 and holds the ascending trendline, this becomes a solid area to consider buying again.
3. Key Price Levels to Watch
Resistance / Sell zone: 4190 – 4194
Invalidation for Sell (wide SL zone): 4219 – 4231 Support / Buy zone: 4100 – 4102
SL options for Buy setup: 4081 – 4063 – 4045 (depending on individual risk appetite)
4. Trade Scenarios
⭐ Short-Term Sell Setup
Sell entry: 4190 – 4194 SL: 4219 – 4231 TP: 4181 – 4155
⭐ Deep Buy Setup (Trend-Following)
Buy entry: 4100 – 4102 SL: 4081 – 4063 – 4045

U.S. data storm ahead – Gold awaits its next breakout🟡 XAU/USD – Timing Reversal at 4188, FVG Retest Expected
🔍 Market Context
Gold is approaching a key timing zone near 4188–4190, which aligns with previous supply and structural rejection.
After a strong impulsive leg, liquidity resting above recent highs may be targeted before a deeper pullback into the Fair Value Gap (FVG) zone.
The structure remains bullish in the medium term, but short-term corrective moves are expected before continuation toward the 4212 liquidity objective.
📈 Key Trading Zones
🔻 SELL Setup
Entry: 4188 – 4190
Stop Loss: 4192
Target 1: 4090
Target 2: 4020
Expect rejection at timing zone — short-term bearish retracement into FVG.
🟢 BUY Setups
BUY GOLD 4090 – 4088 | SL 4085
→ Scalp long targeting 4140–4160 if price reacts strongly within FVG.
BUY GOLD 4022 – 4020 | SL 4017
→ Ideal deeper retracement buy zone aligning with structural liquidity & prior demand.
🧠 Trading Plan Logic
Wait for price sweep & rejection at 4188–4190 before confirming short.
Monitor FVG zone (~4090) for reaction to flip back long.
The higher-timeframe target sits near 4212, aligning with liquidity above prior highs.
⚙️ Bias
Short-term: Bearish correction from 4190 toward 4090.
Medium-term: Bullish continuation toward 4212 after retracement.

Gold Awaits PPI & GDP – Buy Dips, Sell Rallies🟡 XAU/USD – PPI & GDP Data to Define Range Expansion
🔍 Market Context
Gold remains range-bound between $4000–$4100, consolidating after last week’s liquidity sweep.
This week’s key U.S. data — Core PPI, Retail Sales, GDP, and Core PCE — will likely dictate the next major move.
Slight improvement in inflation and consumption data could strengthen the USD temporarily, but overall bias remains bullish mid-term as the Fed is expected to maintain a dovish stance into Q1.
📊 Technical Outlook (4H Chart)
Main Sell Zone (Super OB): 4170–4200 → potential reversal supply zone.
Fair Value Gap (FVG): 4130–4160 → short-term reaction zone if price retraces.
Sell Zone: 4090–4095 → short opportunity aligned with intraday bearish structure.
Buy Zone 1: 4024–4025 → minor demand, expecting internal liquidity sweep.
Buy Zone 2 (Main OB): 4003–4001 → strong order block with multiple rejections; key liquidity pool.
Structure: H4 BOS (Bullish) intact, suggesting a liquidity sweep before next expansion upward.
🎯 Trade Plan
1️⃣ SELL Setup – Short-term reaction from FVG
Entry: 4090–4095
Stop Loss: 4100
Take Profit 1: 4055
Take Profit 2: 4040
Take Profit 3: 4025
➡️ Reasoning: Price is likely to tap the lower edge of FVG and sweep local liquidity before a downside reaction toward internal range demand.
2️⃣ BUY Setup – First demand zone test
Entry: 4024–4025
Stop Loss: 4022
Take Profit 1: 4065
Take Profit 2: 4080
➡️ Reasoning: Expecting a short-term liquidity grab below the mid-range before bullish continuation.
3️⃣ BUY Setup – Main OB accumulation zone
Entry: 4003–4001
Stop Loss: 3998
Take Profit 1: 4045
Take Profit 2: 4075
Take Profit 3: 4090
➡️ Reasoning: Deep liquidity zone aligning with higher-timeframe OB. If macro data disappoints, this area can trigger the next impulsive leg to retest 4170+.
🧭 Overall Bias
→ Ranging bias before Core PCE
→ Buy dips – Sell rallies within 4000–4100 until a clear breakout post-GDP/PCE data.
→ Watch for false breakouts around FVG and maintain risk control before U.S. session releases.

Gold (XAUUSD) – Bears Eye the 4000 Wall! Short Setup AheadGold is currently trading within a tight range of 3990 – 3960, and price action is now approaching the crucial resistance zone at 3990 – 4000.
📈 This area has acted as a strong supply zone in recent sessions — and could once again attract sellers.
💡 Trading Plan:
🔸 Sell Zone: 4000 – 4003
🎯 Targets: 3990, 3980 and 3970
🛑 Invalidation: View remains valid below 4012 — a sustained break above this level would negate the short setup and could open the door for further upside momentum.
📊 Bias: Bearish near resistance until confirmed breakout above 4012
💬 Watch for rejection signals or bearish candles in this zone before entering.
⚠️ Disclaimer
This is for educational purposes only — not financial advice. Always manage your risk and use proper position sizing.
Your feedback drives our content and keeps everyone trading smarter. Let’s make those pips together! 🚀
Happy Trading,
– The InvestPro Team

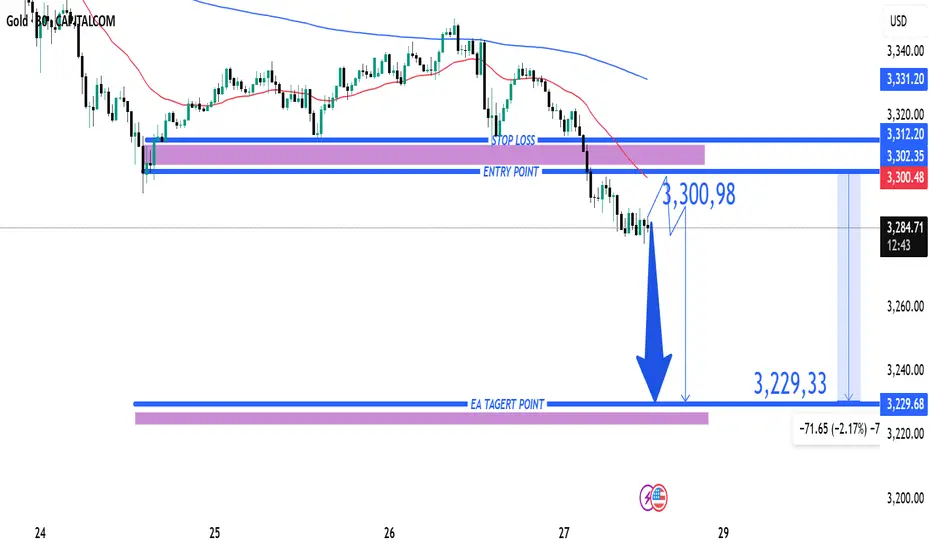
Gold (XAU/USD) Bearish Trade Setup – June 27, 2025Entry Point: Around 3,300.98 USD
Stop Loss (SL): ~3,312.20 USD
Take Profit (TP): 3,229.33 USD
Current Price: 3,286.15 USD
Risk-Reward Ratio: ~1:6.3
(Potential reward ≈ 71.65 pts; risk ≈ 11.22 pts)
Technical Breakdown:
Trend:
The price is in a short-term downtrend, supported by:
Lower highs and lower lows.
Price trading below both 50 EMA (red) and 200 EMA (blue), confirming bearish momentum.
Bearish Breakout:
Price broke below a key support-turned-resistance zone near 3,300–3,302, triggering sell pressure.
Resistance Area:
Strong rejection at 3,302–3,312 zone, which is now acting as resistance.
SL is placed just above this zone to protect against false breakouts.
Target Zone:
TP set at 3,229.33, aligning with a previous support zone — a logical area for price to react.
Strategy Notes:
Bias: Bearish
Entry confirmation: Already triggered.
Risk Management: SL placement is tight and strategic; RR ratio is highly favorable.
Next support below TP: If 3,229 breaks, further downside could follow.
Summary:
This setup shows a well-defined bearish continuation with a clean break of support, a controlled SL above resistance, and a strong RR ratio. A suitable trade for trend-following strategies, but price must not retrace above 3,312 for this idea to remain valid.
Gold XAU/USD Bullish Reversal Setup – Targeting $3,454.65Price: $3,384.41
Strategy: Buy/Long
🟦 Key Levels:
Entry Zone: Around $3,345.76
This level aligns with a previously tested support zone marked in purple.
Stop Loss: $3,331.56
Below the support zone, providing downside protection if the setup fails.
Target (TP): $3,454.65
Marked as EA TARGET POINT, suggesting a potential upside of 3.16% (~$105.83 gain).
📊 Technical Indicators:
Moving Averages:
200 EMA (blue): Near the entry level, adds strength to the support zone.
50 EMA (red): Recently crossed below price, indicating early bullish momentum.
Price Action:
Sharp bounce from support suggests buying interest.
Potential inverse head and shoulders pattern forming, which is a bullish reversal pattern.
🧠 Trade Idea:
Buy near $3,345.76,
Stop Loss at $3,331.56,
Take Profit at $3,454.65
Risk/Reward Ratio ≈ 1:3.3 — favorable setup for long positions.

XAU/USD) Buy Trade Setup – Entry, Target & Risk Management Plan Entry Point:
3,140.34 USD
This is the suggested level to enter a long (buy) trade.
Stop Loss (SL):
3,121.66 USD
A protective level to limit losses if the trade goes against the setup.
Target Point (Take Profit - TP):
3,251.33 USD
This is the EA target point — where profits are expected to be taken.
---
3. Risk/Reward Ratio:
Risk: From 3,140.34 to 3,121.66 = 18.68 points
Reward: From 3,140.34 to 3,251.33 = 110.99 points
Risk/Reward Ratio ≈ 1:6, which is very favorable.
4. Resistance Point:
Around 3,222.45 - 3,227.27
This area might act as a challenge for price movement, potentially leading to temporary retracements.
5. Indicators:
Moving Averages: Red (shorter period) and Blue (longer period) lines help indicate trends.
The price is moving above the short-term MA but currently under the long-term MA, which might suggest a short-term bullish move within a broader downtrend or sideways range.
Conclusion:
This is a bullish setup, anticipating a reversal or continuation to the upside after a pullback:
Buy Zone: 3,140.34
Stop Loss: 3,121.66
Take Profit: 3,251.33
If the price drops to the entry point zone

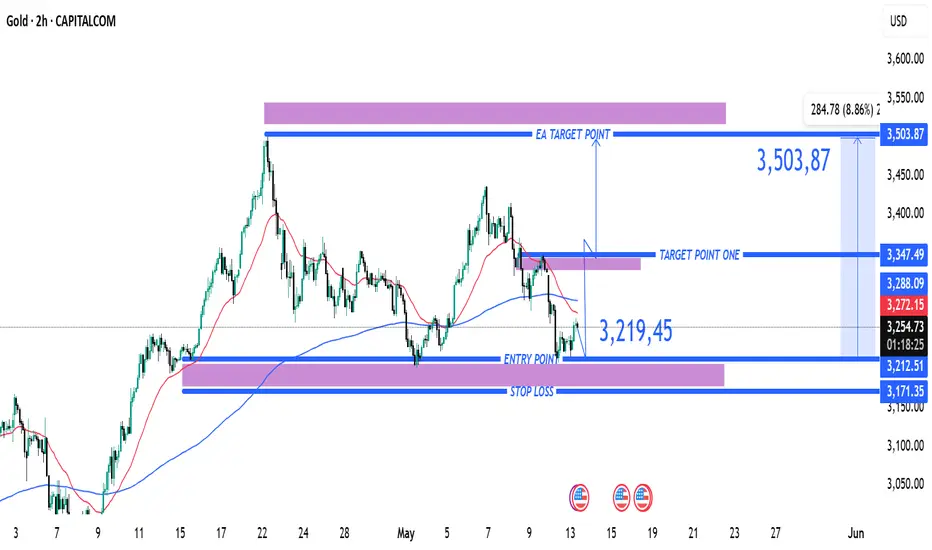
XAU/USD) 2H Trade Setup – Long Entry from Support with Targets aEntry Point: 3,219.45
Stop Loss: 3,171.35
Target Point One: 3,347.49
EA Target Point (Final Target): 3,503.87
Trade Plan:
Risk Zone: Between entry (3,219.45) and stop loss (3,171.35). The trader risks roughly 48.1 points.
Reward Zone: From entry to:
Target Point One: ~128 points.
Final Target (EA Target): ~284.4 points.
Risk-Reward Ratios:
To Target Point One: ~2.66:1
To EA Target Point: ~5.9:1
Indicators and Signals:
Price appears to be bouncing off a support zone near 3,212–3,219, indicating a potential reversal.
200 EMA (blue) and 50 EMA (red) are shown; price is slightly above the 200 EMA, suggesting long-term support.
There is a downtrend before the bounce, so this might be a counter-trend trade or the start of a new trend.
Summary:
This setup is a classic bounce from a demand/support zone with a clear upside potential. The risk is tightly managed, and the reward is significantly higher, aligning with favorable risk-reward principles. However, the position is speculative and relies on bullish follow-through from the support level. Watch price behavior near the 3,288 and 3,347 resistance zones to assess momentum.
Gold (XAU/USD) 15-Min Short Setup: Bearish Reversal from ResistaEntry Point: $3,127.10
Stop Loss: $3,141.53
Target Point (Take Profit): $3,080.62
Technical Indicators:
EMA 30 (red line): $3,111.98 – showing short-term trend
EMA 200 (blue line): $3,056.92 – showing long-term trend
Setup Explanation:
This is a short/sell setup based on the following:
The price action has hit a resistance zone near $3,127 and shows signs of rejection.
The setup assumes that the price will reverse from this zone and head lower.
The Risk-to-Reward Ratio appears decent, aiming for a move of about -1.45% (-$45.34).
Current Status:
Price is currently around $3,119.69, below the entry point.
A slight bounce

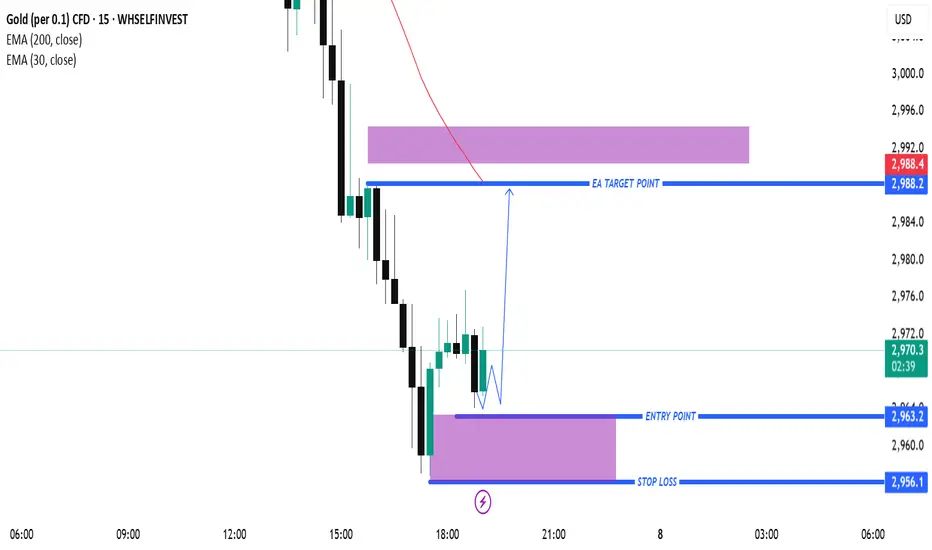
Gold (XAU/USD) Intraday Buy Setup – Demand Zone Reversal with 3.Timeframe: Appears to be intraday (possibly 5-15 minutes).
Indicators:
EMA 30 (red): Showing recent bearish momentum.
EMA 200 (blue): Positioned above, indicating a longer-term bearish trend.
Candlestick Pattern: After a steep drop, price shows signs of consolidation and potential reversal.
📌 Trade Setup (Long/Bullish Bias)
Entry Zone: Around $2,963.2
Price is expected to pull back into this purple demand zone before moving up.
Stop Loss (SL): $2,956.1
Placed below the support zone to limit downside risk.
Take Profit (TP / Target Point): $2,988.2
A previous supply zone near the EMA 30, where selling pressure could return.
📊 Risk-Reward Ratio
Risk: $2,963.2 - $2,956.1 = $7.1
Reward: $2,988.2 - $2,963.2 = $25
RRR (Reward-to-Risk Ratio): ~3.5:1
This is a solid ratio, suggesting a high-potential trade if the setup plays out.
📈 Bullish Scenario
Price pulls back into the demand zone (entry).
A bullish candlestick confirmation or wick rejection could trigger a buy.
Target is the previous structure + EMA zone.
MCX GOLD - ONE MORE SHORT ATTEMPT ?MCX GOLD is currently trading at 68900.
I shorted GOLD twice in last three weeks. One position was closed in 700 points profit and other went 1000 points in profit and then closed CTC.
I'm shorting MCX Gold Futures once again at CMP 68900. I will add more short position if 69600 comes & will hold with SL above 70100.
I think rally in gold is about to end and I'm expecting Gold to fall soon & change its trend from bullish to sideways - negative. M pattern is in making in 4 HTF.
Disclaimer - Do not consider this as a buy/sell recommendation. I'm sharing my analysis & my trading position. You can track it for educational purposes. Thanks!

Rally is about to end in MCX GOLD ?MCX Gold has rallied one way from 62000 to 67000 in last 5 weeks without any major retracements.
Gold is currently respecting a rising channel pattern & currently trading at higher end of this channel pattern. I'm expecting gold to correct and touch bottom of this rising channel.
I tried to short gold last week but it went sideways so I had to close. Closed that position in 700-750 rupees in profit.
I am seeing a trading opportunity in gold.
Here's a trading opportunity.
GOLD CMP - 66780
I'm taking short positions in Gold June Future at CMP 67160.
Holding Future short position with Stoploss 67600.
I'm also planning to short MAY 65000 CE positionally which is now trading at 2500-2600.
I'm expecting a correction in Gold very soon.
Disclaimer - Do not consider this as a buy/sell recommendation. I'm sharing my analysis & my trading position. You can track it for educational purposes. Thanks!

BTC DEEP ANALYSIS Accumulation phase has finished.
Read the chart and study it how they Manipulate market after breaking out of range for the long time. After accumulation it always do fake BREAKOUT.
Manipulation phase has started
Currently hunting sell side liquidity
People will be shorting it for 20k target but they will be rekt soon.
When it start pump and cross above the red box, people will be long on BTC and it will be dumped back below box and suddenly we will see huge green candles that we can't even catch the trade😅
Don't trade futures till btc enters accumulation zone again...go for spot entries for now.
Boost 🚀 if you liked this content which never been talked about.

Gold possible upside momentgold hase broke 30 minutes resistance and retested. one can enter for 80-100 pips moments upsede. USD is seen week. one can target upto 2030

GOLD | InvestmentBuying some quantity of goldbees
Disclaimer: This analysis is solely for educational purposes and does not make me a SEBI registered analyst.
If you found this analysis helpful, I encourage you to like and share it. Your observations and comments are also welcomed below. Your support, likes, follows, and comments motivate me to consistently share valuable insights with you.
🔍 More Analysis & Trade Setups 🔍
For more technical analysis and trade setups, make sure to follow me on TradingView: www.tradingview.com

Gold Trade Idea Gold Update
- Since my last post Gold did follow my plan and led to a significant move to the upside.
- Remember we don't trade any patterns my conviction was based on merging Fundamentals along with technical analysis.
- The Global Scenario for gold looks bullish and commodities overall will remain bullish in a market where we have chances of the war getting escalated.
- DXY too will be important to be observed before trading Commodities because DXY has stayed calm since 3 weeks.
- Trading aggressively this week will only result in leaked gains and losses.
- The mentioned Red Zone will be an important area to catch a gold short ONLY if you see a good rejection or else let it hover around. (2100-2150 is a strong supply zone).

GOLD Daily Swing GOLD Daily Chart
$1810 was the Major reversal expected level we seen with NFP this Month and closing was $1828 and since the war attacks started its 1828 to 2008 Continuously with no retest no reversal or Technical move only Bullish
Next Targets as Follows $2021-2048-2081
if you get retest buy on Dips
Stay with Trend

GOLD target for all mcx traderHi every one
I am gold king
you can watch my anlysis
You can start Investing in gold
Note: this is not buy sale tips
this is my perfect analysis gann cycle
R u ready

GOLD UPDATE - Long side after upmove price is making side ways it can be continous for next up move
there is a level 58450-60 around for buyers liquidity might retest this
or else 59450 can trade breakout for the target of 60600

GOLD today. Continues to draw in safe haven investments🌷US Dollar, Treasury Yields, Israel, Federal Reserve, GVZ Index - Talking Points
- Gold prices appear to be comfortably above the USD level during Wednesday's trading session
- Treasury yields after hitting new highs again but gold seems unaffected by that
- The US dollar has been volatile despite global instability. Will XAUUSD continue to rise?
🌷World gold price stood at 1,937 USD/ounce, a sharp increase of 22 USD/ounce compared to the same hour yesterday morning. The precious metal is holding its position high as a haven despite US government bond yields rising to multi-year highs.
🌷Two-year Treasury notes traded at 5.24% for the first time since 2006 on strong economic data. US retail sales in September exceeded forecasts, causing Treasury bond yields to increase. The US Dollar rose against the British Pound, Yen and Canadian Dollar, but remained mostly stable elsewhere. RBA signals a more hawkish stance on the Australian Dollar.
🌷The geopolitical situation in the Middle East has supported gold as a safe-haven asset, despite the usual challenge posed by rising returns on low-risk assets such as Treasury bonds. Resolution of the situation seems distant as it continues to develop.
🌷The XAUUSD market will continue to attract safe haven flows due to the Israel-Hamas conflict. If there are signs that the Fed is nearing the end of this rate hike cycle, that would be good for gold, even if we don't get any rate cuts anytime soon. It is forecasted that gold will fluctuate in the range of 1,900 USD/ounce until there is some ceasefire or the conflict subsides.
Plan trading
SELL GOLD 1951-1953
SL 1955
TP 1940
BUY GOLD 1935-1937
SL 1932
TP 1950

gold next support level 57460 - 56300??* IM NOT IN FAVOUR TO SHORT INSTEAD WAIT FOR VALUE BUYING AREA*
gold has breached all of its recent support and this fall looks like free fall maybe because of dxy rising
57460 and 56300 will be very important level base on previous trend low to recent high fib retracement of 0.6 and 0.7 golden zones are appearing on exactly on our fair value area
WILL UPDATE FURTHER ON EVERY MAJOR MOVE
