Gold (XAUUSD) – Bears Eye the 4000 Wall! Short Setup AheadGold is currently trading within a tight range of 3990 – 3960, and price action is now approaching the crucial resistance zone at 3990 – 4000.
📈 This area has acted as a strong supply zone in recent sessions — and could once again attract sellers.
💡 Trading Plan:
🔸 Sell Zone: 4000 – 4003
🎯 Targets: 3990, 3980 and 3970
🛑 Invalidation: View remains valid below 4012 — a sustained break above this level would negate the short setup and could open the door for further upside momentum.
📊 Bias: Bearish near resistance until confirmed breakout above 4012
💬 Watch for rejection signals or bearish candles in this zone before entering.
⚠️ Disclaimer
This is for educational purposes only — not financial advice. Always manage your risk and use proper position sizing.
Your feedback drives our content and keeps everyone trading smarter. Let’s make those pips together! 🚀
Happy Trading,
– The InvestPro Team
Goldtradeidea

Gold Breaks $3900: Safe-Haven Demand Soars & Fed Fuels the Rally📊 Market Context
Gold continues to assert its strength by breaking the psychological barrier of $3,900, becoming the central asset amidst financial and political turmoil.
US government shutdown → defensive capital flows strongly into gold.
Fed expected to cut interest rates by another 0.25 points → further strengthens the advantage for the non-yielding precious metal.
Lack of economic data → investors closely follow private reports, adding uncertainty and supporting gold's role as the “number 1 safe haven”.
👉 Market sentiment is perfectly aligned: USD under pressure, capital moving away from risky assets, BUY side FOMO continues to amplify → gold stands before the opportunity to climb and conquer the 3950–3990 range.
🔎 Technical Analysis (H1/H4)
Main trend: Strong uptrend, price holding above the rising trendline.
BUY ZONE 1: 3904–3902 → Volume CP Zone, supports momentum.
BUY ZONE 2: 3885–3883 → Retest old ATH, accumulation zone for the next rally.
SELL Zone: 3949–3950 → Liquidity Zone, prone to liquidity traps.
Extended target: 3994 (Fib 3.618).
🔑 Key Levels
BUY Zones: 3904–3902, 3885–3883
SELL Zone: 3949–3950
Resistance: 3950, 3994
Support: 3900, 3880
📈 Scenario & Trading Plan
✅ BUY ZONE 1: 3904–3902
SL: 3898
TP: 3910 - 3915 - 3925 - 3935 - 3945 - ???
✅ BUY ZONE 2: 3885–3883
SL: 3878
TP: 3895 - 3905 - 3920 - 3935 - 3945 - ???
⚠️ SELL ZONE (scalp/trap): 3949–3950
SL: 3955
TP: 3940 - 3935 - 3925 - ???
⚠️ Risk Management Notes
Liquidity may sweep above 3950 before adjusting → need to wait for price action confirmation.
Avoid FOMO at the peak, prioritize BUY only when price adjusts to support zones.
Order volume should be slightly reduced before unexpected Fed policy announcements.
✅ Summary
Gold is in the “golden phase” of an uptrend: political instability + dovish Fed + safe haven demand = BUY is the main strategy. Plan to accumulate around 3904–3902 and 3885–3883, with an extended target of 3950–3990. SELL is only a short-term strategy at the liquidity zone.
📢 Follow MMFLOW TRADING for real-time updates & BIGWIN setups with the team!

XAU/USD Near Record Highs: Key Data AheadGold (XAU/USD) Technical Outlook – October 3, 2025
1. Macro & News Context
Gold is holding near record highs, heading for its seventh consecutive weekly gain, supported by expectations that the Federal Reserve will continue cutting rates and by concerns around the ongoing U.S. government shutdown. Spot prices have recently tested the ₹3,890–3,900 region and are now consolidating around ₹3,860.
Nonfarm Payrolls (NFP) – Typically scheduled for 18:00 IST on the first Friday of the month, the September jobs report is likely to be delayed due to the U.S. government shutdown.
Key event to watch today:
ISM Services PMI (September) will be released at 19:30 IST. Since ISM data is privately produced, it will be published regardless of the shutdown and may serve as the main volatility catalyst in today’s U.S. session. 【ISM】
Labor market signals: Challenger job cut data showed lower layoffs in September, but planned hiring at the lowest level since 2009, reinforcing a softer employment backdrop. Combined with the Fed’s recent 25 bps rate cut (to 4.00%–4.25%), this continues to support the bullish gold narrative.
USD trend: The dollar has weakened broadly this week, aligning with market bets on further monetary easing. This backdrop provides an additional tailwind for gold.
2. Technical Landscape (H1 Chart)
The attached chart highlights key technical zones and a completed Harmonic XABCD pattern on the 1H timeframe:
Support levels:
Near-term: ₹3,844–3,841
Deeper: ₹3,827 (intraday pivot), ₹3,792 (strong low)
Strategic: ₹3,764–3,770 (Bullish Order Block)
Resistance levels:
Immediate: ₹3,865
Strong supply: ₹3,880–3,890 (Bearish Order Block)
Extended target: ₹3,930–3,940 (Sell Scalping | Fibo zone)
Momentum: After bouncing from point D of the harmonic structure, gold has been forming higher lows (HL). Price currently sits above the longer-term moving average and is testing the shorter-term average, suggesting a constructive short-term bias as long as supports hold.
3. Trade Scenarios
Scenario 1 – Buy-the-dip (preferred bias)
Entry zone: ₹3,844–3,841
Stop loss: Below ₹3,827 (safer: below ₹3,792)
Targets:
₹3,865 (first take-profit)
₹3,880–3,890 (major supply)
Stretch: ₹3,930–3,940
Rationale: Higher low formation, bullish macro backdrop, aligned with strong weekly uptrend.
Scenario 2 – Countertrend short at resistance
Trigger zone: ₹3,880–3,890 (Bearish OB)
Confirmation: Rejection candles (H15–H1) such as wicks, engulfing, or failed breakout.
Stop loss: Above ₹3,895–3,900 (or above ₹3,945 if price spikes into the ₹3,930–3,940 fib zone).
Targets: ₹3,865 → ₹3,844 → ₹3,827
Rationale: Potential liquidity sweep ahead of ISM, with profit-taking likely near supply zones.
Scenario 3 – Breakdown through support
Trigger: 1H close below ₹3,841
Path: ₹3,827 → ₹3,792 (Strong Low) → ₹3,764–3,770 (Bullish OB)
Rationale: Loss of intraday structure would flip bias short until major demand zones.
4. How to Trade Around Today’s Data
If NFP is indeed delayed, the 18:00 IST slot may bring limited volatility.
Focus instead on the ISM Services PMI at 19:30 IST, which could trigger sharp swings in both USD and gold.
Adjust position sizing: Expect spread widening and slippage around the release. Reduce leverage or scale into positions.
5. Risk Management
Limit risk per trade to 0.5–1% of account equity.
Avoid chasing price once levels are tested; wait for H15–H1 candle closes for confirmation.
Monitor the U.S. Dollar Index (DXY) and Treasury yields – further dollar weakness would reinforce bullish gold setups.
🔑 Key Takeaway
Gold remains structurally bullish in the broader trend, with immediate support at ₹3,841–3,844 critical to maintain upside momentum. Watch for reactions around ₹3,880–3,890 and ₹3,930–3,940. With NFP possibly delayed, the ISM Services PMI at 19:30 IST will be today’s most important catalyst for directional moves.

Daily Plan: Gold Targets 7th Straight Weekly Gain |MMFLOWTRADING📊 Market Context
Gold holds firm above $3,850, aiming for its 7th consecutive weekly gain.
🔥 Main driver: Risks from a prolonged U.S. government shutdown.
📉 54% probability of the shutdown lasting 29 days (Polymarket) → directly impacting gold sentiment.
🛡 Safe-haven demand & BUY-side FOMO keep fueling momentum.
⚖️ Still, profit-taking at higher resistance zones could trigger sharp swings before the next directional move.
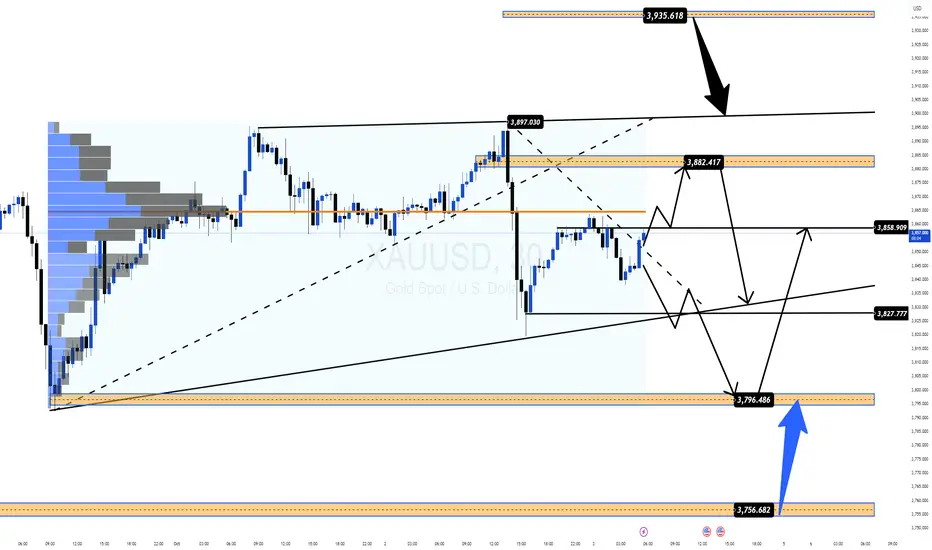
🔎 Technical Analysis (H1/H4)
📈 Main trend: Bullish, but consolidating near 3,850.
🚧 Key Resistances: 3882–3884 & 3934–3936 (Liquidity Sell Zones).
🏦 Key Supports: 3797–3795 & 3756–3754 (Buy Zones).
🎯 Key Levels: 3850 – 3880 – 3900.
📈 Trading Scenarios & Plan
✅ SELL ZONE 1: 3882–3884
SL: 3890
TP: 3878 – 3874 – 3870 – 3865 – 3860 – 3850 – 3840 – ???
✅ SELL ZONE 2: 3934–3936
SL: 3940
TP: 3930 – 3925 – 3920 – 3910 – 3900 – ???
✅ BUY ZONE 1: 3797–3795
SL: 3790
TP: 3800 – 3810 – 3820 – 3830 – 3840 – ???
✅ BUY ZONE 2: 3756–3754
SL: 3750
TP: 3760 – 3770 – 3780 – 3790 – 3800 – ???
⚠️ Risk Management Notes
🌀 U.S. shutdown headlines may spark unexpected volatility.
🕵️♂️ Focus on BUY setups at support, avoid chasing FOMO at highs.
❌ Consider SELL only if clear rejection signals form at resistance zones.
✅ Summary
Gold remains supported by safe-haven flows, eyeing a 7-week winning streak.
🎯 Strategy:
BUY setups: 3797–3795 & 3756–3754.
SELL setups: 3882–3884 & 3934–3936.
📢 Follow MMFLOW TRADING for real-time updates & BIGWIN setups!
(XAU/USD) – Gold likely to touch $4,000/oz: Ideal buying levels?1. Market Structure & Trend Outlook
On the H1 chart, gold is sustaining its bullish structure with higher highs and higher lows.
After the BoS (Break of Structure), price retraced near 3,862 Buy Zone and bounced upward.
At present, price trades above EMA34 and EMA89, keeping bullish bias intact.
2. Important Levels
Buy Zone: 3,862 – 3,865. Acts as short-term support. Holding above strengthens the bullish case.
OB1: 3,806 – 3,810. Next support in case Buy Zone breaks.
OB2: 3,763 – 3,770. Deeper support, triggered only if market corrects heavily.
Sell Scalping Zone (Fibo): 3,912. A short-term resistance, profit booking expected.
Sell Zone / ATH: 3,933 – 3,935. Breakout here may lead to fresh record highs.
3. Trade Setups
Bullish Setup: Buy on retest of 3,862 – 3,865.
SL: Below 3,850.
TP1: 3,912.
TP2: 3,933 – 3,935.
Bearish Setup (Defensive): If below 3,860, expect test of 3,806 – 3,810.
If this fails, price may decline towards 3,763 – 3,770.
4. Conclusion
Trend remains positive on H1. Best strategy: Buy on dips near support, manage SLs carefully, and book partial profits near resistances. Sustaining above 3,933 may open doors for new highs.

Bearish Pressure Builds: Gold Poised for More RetreatGold retreated sharply today as expected, and directly hit my expected retracement target of 3520-3510 area; the lowest point happened to be around 3511. We added a lot of short positions around 3575 and 3578 overnight, which helped us to make considerable profits during the gold retreat. All short positions made a total profit of 1830pips after being closed.
Since gold has begun to retreat from 3578, and the retracement has reached 670 pips in the short term, a retracement that is rare in recent times, as gold has shown obvious signs of retreat, once large funds begin to withdraw, it may trigger serious selling sentiment in the market. Taking this opportunity, the gold market may usher in a round of sharp correction. Moreover, after gold retreats, 3578 is expected to become the interim peak, which will limit the room for gold to rebound while being conducive to the downward pressure on gold.
In addition, gold rose sharply before the NFP market, probably to reserve room for the NFP market to fall, so I think gold still has the demand and space to continue to retreat, so the current decline has not ended yet, and I think the current short-term rebound provides us with good conditions for entering the short market.
According to the current structure, gold still needs to retreat after fluctuating at high levels. Therefore, in trading, we can still look for suitable opportunities to short gold during the gold rebound. First of all, we need to pay attention to the short-term resistance area of 3545-3555. Once gold cannot effectively stand in this area during the rebound, gold will also test the 3510-3500 area. After falling below this area, it is expected to continue to the 3490-3480 area.

XAU/USD – End-of-Month Trading Strategy | MMFlow TradingGold is entering a short-term correction phase as we close the month. Looking at historical data, in the last 4 months, Gold has shown deep liquidity sweeps at month-end before continuing its upward rally. Today, we could see a similar setup.
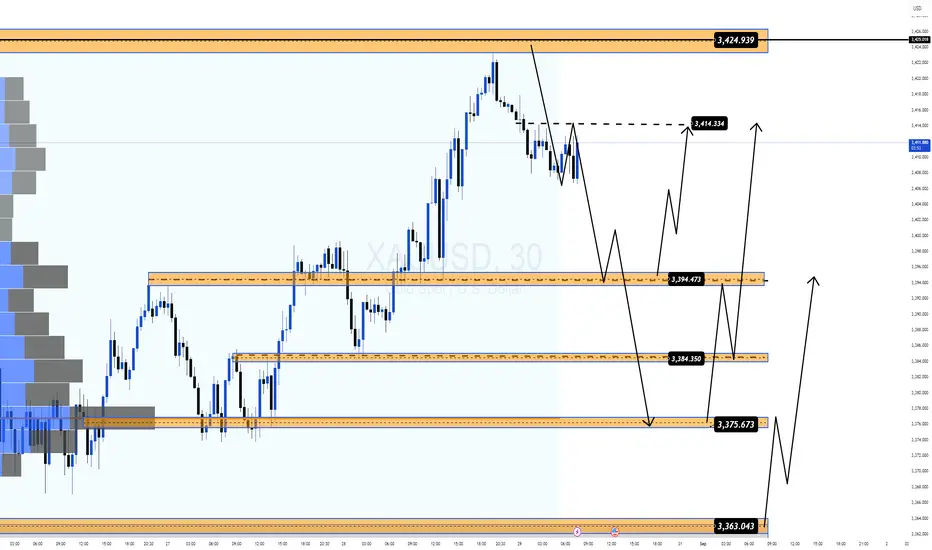
📊 Market Context:
Month-end candles often create long wicks (343x → 335x).
If price breaks below 3395, we could see deeper liquidity grabs.
US Session has PCE Data release – expected to match the previous reading. This may trigger short-term volatility, providing opportunities for intraday traders.
📌 Key Levels
🔺 Resistance (Sell Zone)
3434 – 3436 → Short-term selling opportunity.
3424 – 3435 → A breakout here opens the path to new highs.
🔻 Support (Buy Zone)
3395 – 3390 → Important intraday liquidity zone.
3376 – 3374 (VPOC Area) → Strong demand zone, likely to attract buyers.
3363 – 3355 (Deep Liquidity Zone) → Extreme scenario, less likely without major news.
📌 Trade Plan
✅ Long Setup (Buy Zone)
Entry: 3376 – 3374
Stop Loss: 3369
Targets: 3380 – 3385 – 3390 – 3400 – 3410 – 3420 – ???
🎯 This aligns with the VPOC zone, highly probable for bullish reaction.
✅ Short Setup (Sell Zone)
Entry: 3434 – 3436
Stop Loss: 3440
Targets: 3430 – 3425 – 3420 – 3410 – 3400
⚠️ Short trades are better executed in Asian & European sessions to catch the correction move before US volatility.
📍 Summary:
Watch 3395 – 3375 closely → if this holds, September could bring strong bullish momentum.
Month-end dips are often the best opportunities to position for the next ATH rally.
Patience + precise levels = high probability setups.
🔥 Stay tuned with MMFlow Trading for precise institutional-style analysis & real-time market insights.
XAUUSD-Gold bearish continuationSince bearish momentum is strong, short positions can be opened.
Entry-$3359
SL-$3363
TP1-$3320
TP2-$3300
4 points SL, 50+ points TP

BREAKOUT OCCURRED ITS A SURESHOOT SELLING TRADE ITS A SURESHOOT
IRS MY PERSONAL STRATEGY
The gold showing a good falling
Having a good potential
There is nothing to doubt
It have a great surety of FALL
Due to these reason
1.It have clear-cut neckline without any confusing chat
2. It have clear entry and Tp point
3. Sellers seems heavy due to volume
its a good one

GOLD long setup (check the description)we have captured the down trend since the beinginng on trend change
currently price has breached some fair value area and ob's from medium time frame
as i have captured the big trend personally i wont be shorting instead will wait for my buying zone
58810 and 58665 is new current resistace
58275 and 58120 is the level where price would like wick this level to sweep the liquidity and stop loss of remaining buyers
there after 58090 - 57970 would be the non mitigated old order block where there will be order and we can new buying from this level
57650 to 57875 will be last demand zone for gold where it will be value zone for buyers

GOLD: What happens next for Gold?Temporary concerns cooled down during trading hours in Europe but continued before Wall Street opened, with XAU/USD trading at a low of 1,902.68 per troy ounce, which aligns closely with the lowest level in July. Ultimately, the positive tone from Wall Street finally interrupted the USD protest rally and helped XAU/USD recover from the aforementioned low level, although gains were modest amid limited selling pressure on the US currency.


JACKPOT BUY IN GOLDBullish Alt Shark
Cmp - 58055
Buy PRZ - 58019/58126
SL - 57700
Target - 58900/59475/59900

XAUUSDOANDA:XAUUSD
As you can see that, XAUUSD has given a good consolidation breakout and wait for the retest entry, go for sell side. plan your trade accordingly...


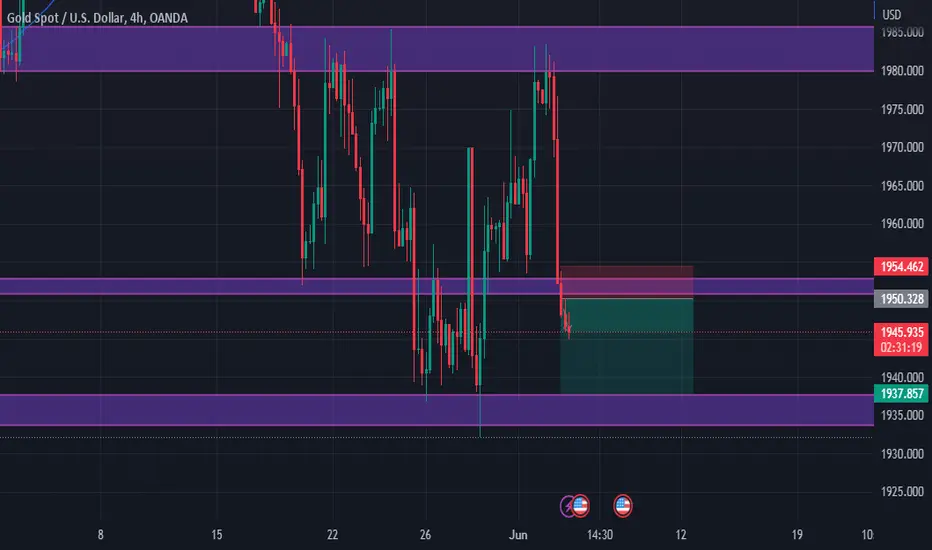
06/06 - Gold upGold prices at the beginning of the trading week increased as the US dollar weakened, resulting in a decrease in the US Dollar Index.
This made gold more appealing to buyers who use other currencies.
Gold has bounced back strongly from the support level of $1,950/ounce due to disappointing economic data.
The May Purchasing Managers' Index (PMI) for the US service sector fell significantly below expectations.
Business activity and new order indices have also decreased.
Bullish gold speculators are being backed by the 50-period Exponential Moving Average (EMA) at $1,959.38, and the Relative Strength Index (RSI) is fluctuating between 40.00-60.00.
I will consider buying gold around 1951-1954, this area will test again

Do you think gold will rise today?The price of gold rebounded after hitting a low point not seen in over two months.
This was due to the recent data showing that the US services sector had experienced minimal growth in May, which halted several months of strong market growth.
The weakened dollar was also beneficial to metal markets, with gold being a safe-haven asset.
However, it is expected that US interest rates will remain high this year, limiting the potential for significant gains in metal prices.
Despite this, it is possible that the value of gold will increase later in the year as the US economy weakens.
In general, in the short term, Gold can still maintain its upward momentum, if the 1950-1940 price zone can still hold the bears. Then it's not a difficult thing to crawl back to 1975 or even 1985

GOLD 1:3 TradeGold Powerful 1:3 Trade
= Down Trend
= breaking their Support
= Price below the 200 EMA
= Positibe news For USD Coming soon (Bad for Gold)
= Proper Price action
Gold Bullish Butterfly IdentifiedBullish Butterfly
Buy PRZ - 59282-59338
SL - 50149
Target - 59700/59850/60000

Gold Daily TFon Daily TF double top was formed but the red line is not yet broken. now it seems to be forming double bottom. One can hedge here and wait to break on the either side. Safes can enter on the breakout and retest.

Gold shortSell xauusd @1660.70
Sl 1673
Target1 1651.19
Target2 1642.54
Target3 1631.84
Target4 1614.54
