XAUUSD (H2) – Liam's AnalysisXAUUSD (H2) – Liam View
Rally into supply | Volatility risk rising
Gold is rebounding from the 4550–4600 demand base, but the broader H2 structure still points to a selling environment. The current move higher looks corrective, driven by short covering and liquidity rotation rather than a confirmed trend reversal.
From the chart, price is rotating back toward 4900–5030, a zone where previous distribution and liquidity rest. Unless price can accept above this area, rallies should be treated as selling opportunities, not breakout confirmation.
Key technical zones
Major selling zone: 5536 – 5580 (HTF supply)
Near-term reaction zone: 5000 – 5030
Key demand / base: 4550 – 4600
Intraday support: ~4730
Market context
Recent US political headlines and institutional reviews add another layer of headline-driven volatility, increasing the risk of sharp swings and liquidity sweeps. In such conditions, gold often reacts erratically intraday, but higher-timeframe structure tends to reassert itself once the noise fades.
Outlook
As long as price stays below 5030, the bias remains sell-side dominant.
Failure to hold above 4730 would reopen downside risk toward the demand base.
Only a clean H2 acceptance above 5030 → 5100 would neutralize the bearish structure.
Execution note
Avoid chasing momentum in news-driven sessions.
Let price come to levels. Trade the reaction, not the headlines.
— Liam
Goldtrader

XAUUSD – H2 Technical AnalysisXAUUSD – H2 Technical Outlook: Scenario 3 – Corrective Rebound Before the Next Decision | Lana ✨
Gold is showing signs of stabilization after a strong sell-off, and today’s price action may favor Scenario 3: a corrective rebound. This is not a full trend reversal yet, but a likely recovery phase into key imbalance zones, where the market will decide whether to continue lower or rebuild structure for a broader rebound.
📈 Market Structure & Context
The recent move down was impulsive, clearing multiple supports and creating a clear bearish displacement.
Price is now reacting from a lower base, suggesting selling pressure is slowing and a technical retracement can develop.
In this environment, the focus is on how price reacts at FVG/supply zones above, not on chasing moves in the middle of the range.
🔍 Key Zones to Watch Today
Buy Liquidity / Base Support: 4640 – 4645
This is the current stabilization area and the most important zone to defend for any rebound scenario.
FVG Support Zone: 4953 – 4958
First major upside target for a corrective rebound. This zone may act as a magnet for price, but also as a reaction area.
Sell FVG (Upper Supply): ~5250 – 5320
If the rebound extends, this becomes the next resistance zone where selling pressure may return.
Strong Resistance: ~5452
A higher objective only possible if price shows clear acceptance and trend rebuilding above key levels.
Structural Pivot: ~5104
A key mid-level. Acceptance above it would strengthen the rebound thesis.
🎯 Scenario 3 – Corrective Rebound Plan
If price holds above 4640–4645 and continues to build higher lows, the market may attempt a push back into imbalance:
First recovery path: 4640–4645 → 4953–4958
If price accepts above the mid-structure: → 5104
Extension (only with strong acceptance): → 5250–5320
Higher target (less likely today): → 5452
This is a structure-first environment: the rebound is valid as long as price defends the base and prints cleaner bullish follow-through.
🧠 Lana’s View
Today’s setup leans toward a retracement-driven rebound, where price rebalances into key zones after a sharp drop. The best approach is to stay patient, track reactions at 4953–4958 and 5250–5320, and let structure confirm whether this rebound is only corrective or the start of a broader recovery.
✨ Stay calm, respect the zones, and let price confirm the next move.

XAUUSD (H2) – Liam Bearish TrendXAUUSD (H2) – Liam Bearish Outlook
Structure broken | Selling pressure remains dominant
Quick summary
Gold has shifted into a clear bearish phase after failing to hold key support levels. The strong sell-off has broken the prior bullish structure, and recent rebounds show signs of weakness rather than accumulation.
At this stage, the market is no longer in a buying/entry environment. The priority is selling rallies, not catching bottoms.
Market structure
The previous uptrend has been decisively invalidated by a sharp downside impulse.
Price is now trading below former support, which has flipped into resistance.
Recent recovery attempts lack follow-through and are corrective in nature.
This keeps the broader intraday-to-short-term bias bearish.
Key technical zones
Primary sell zone: 5100 – 5110
Former support turned resistance. This area favours sell reactions if price retests.
Secondary sell / liquidity zone: 4860 – 4900
A corrective bounce into this zone is likely to attract sellers again.
Near-term support: 4690 – 4700
A weak support area that may give way if selling pressure resumes.
Deeper downside targets:
4400 – 4450, then 4120 if the bearish momentum expands.
Trading plan (Liam style: sell the structure)
Primary scenario – SELL rallies
As long as price remains below 5100, any rebound should be treated as corrective. Sell reactions are preferred at resistance and liquidity zones, targeting further downside continuation.
Secondary scenario – Breakdown continuation
Failure to hold 4690 – 4700 would confirm continuation lower, opening the path toward deeper value zones.
Invalidation
Only a strong reclaim and acceptance back above 5100 – 5150 would force a reassessment of the bearish bias.
Key notes
Volatility remains elevated after the breakdown.
Avoid premature buying/entry against structure.
Let price come into resistance, then execute.
Trend and structure first, opinions second.
Focus for now:
Selling rallies while structure remains bearish.
No bottom fishing.
— Liam

XAUUSD (H2) - Liam Plan (Jan 28)XAUUSD (H2) – Liam Plan (Jan 28)
New ATH, strong safe-haven flow | Follow trend, buy FVG pullbacks only
Quick summary
Gold continues to print new all-time highs as global capital rotates into safe-haven assets amid persistent economic and geopolitical uncertainty tied to recent US policy decisions. Additional support comes from concerns around Fed independence and expectations of lower US rates, keeping real yields capped.
Despite the bullish backdrop, price is now extended above equilibrium. The edge is not in chasing strength, but in waiting for pullbacks into imbalance and liquidity zones.
➡️ Bias stays bullish, execution stays patient.
Macro context (why gold stays bid, but volatile)
Ongoing geopolitical uncertainty keeps structural demand for gold intact.
Rate-cut expectations and doubts around Fed autonomy weaken the USD’s long-term appeal.
USD is attempting a technical bounce, but this has not shifted gold’s underlying bid.
➡️ Conclusion: macro supports higher prices, but short-term moves will likely rotate to rebalance inefficiencies.
Technical view (H2 – based on the chart)
Price is trending cleanly higher after multiple bullish BOS, riding an ascending structure and expanding into premium.
Key levels from the chart:
✅ Major extension / sell-side target: 5280 – 5320 (2.618 fib expansion)
✅ FVG / continuation buy zone: 5155 – 5170
✅ Structure support: 5000 – 5050
✅ Trend invalidation (deeper): below 4950
Current price action suggests a likely path of push → pullback → continuation, rather than straight-line expansion.
Trading scenarios (Liam style: trade the level)
1️⃣ BUY scenarios (priority – trend continuation)
A. BUY the FVG pullback (cleanest setup)
✅ Buy zone: 5155 – 5170
Condition: price taps FVG and shows bullish reaction (reclaim / HL / displacement on M15–H1)
SL (guide): below 5125 or below reaction low
TP1: recent high
TP2: 5280
TP3: 5320+ if momentum expands
Logic: This FVG aligns with prior buy-side liquidity and structure — a high-probability continuation zone.
B. BUY deeper structure support (only if volatility spikes)
✅ Buy zone: 5000 – 5050
Condition: liquidity sweep + strong rejection
TP: 5170 → 5280
Logic: This is value within trend. No interest in longs above premium if this level breaks.
2️⃣ SELL scenarios (secondary – reaction only)
SELL at extension (scalp / tactical only)
✅ Sell zone: 5280 – 5320
Condition: clear rejection / failure to hold highs on lower TF
TP: 5200 → 5170
Logic: Extension zones are for profit-taking and short-term mean rotation, not trend reversal calls.
Key notes
New ATHs invite FOMO — don’t be that liquidity.
Best trades come after pullbacks, not during impulse candles.
Reduce size around Fed headlines.
What’s your plan: buying the 5155–5170 FVG pullback, or waiting for a stretch into 5280–5320 to fade the reaction?
— Liam

XAUUSD – H1: Strong UptrendXAUUSD – H1 Technical Outlook: Extension Risk Near Highs as Geopolitical Tension Builds | Lana ✨
Gold continues to trade in a strong bullish structure, with price pushing higher along an ascending trendline. However, as the market approaches upper resistance zones, price action suggests the rally may be entering a more sensitive phase, where extension risk and volatility increase.
📈 Market Structure & Price Action
The short-term trend remains bullish, with price respecting the rising trendline.
Recent price action shows strong impulsive buying, followed by shallow pullbacks — a sign of aggressive demand.
However, price is now trading near the upper boundary of the trend channel, where upside continuation often becomes less efficient and more reactive.
The current structure favors continuation, but risk increases as price stretches further from value.
🔍 Key Technical Zones on H1
Immediate resistance / reaction zone: 4987 – 5000
This area represents a short-term ceiling where price may hesitate or form a temporary consolidation.
Sell zone (extension area): 5053 – 5070
A premium zone where upside becomes increasingly extended and profit-taking or corrective reactions are more likely.
Key support & value zones below:
4663 – 4629 (prior acceptance + structural support)
4595 – 4570 (deeper value area aligned with Fibonacci retracement)
These lower zones remain important reference points if price transitions from extension into correction.
🎯 Trading Scenarios
Primary scenario (bullish continuation):
If price consolidates above 4987 and accepts higher, the market may extend into the 5053–5070 zone. Any move into this area should be monitored closely for exhaustion signals rather than late breakout chasing.
Alternative scenario (pullback into structure):
Failure to hold above 4987–5000 could trigger a corrective move back toward 4663–4629, where buyers may look to re-engage at better value.
Lana prefers waiting for reactions at key zones, not chasing price when it is already extended.
🌍 Geopolitical Context (Why Volatility Matters Now)
Recent reports indicate that the USS Abraham Lincoln carrier strike group has entered the Indian Ocean, with expectations of moving toward the Arabian Sea in the coming days. The increased U.S. military presence in the Middle East, amid concerns of potential escalation involving Iran, adds a layer of geopolitical uncertainty.
Historically, such developments tend to:
Increase short-term volatility in gold
Support gold as a hedge, while also triggering sharp profit-taking swings
This backdrop reinforces the importance of risk management and patience, especially when price is trading near premium zones.
🧠 Lana’s Perspective
Gold remains bullish, but not every bullish phase is a good place to buy. As price trades higher into premium and extension zones, Lana focuses on structure, value, and reaction, not emotional momentum.
✨ Respect the trend, manage extension risk, and let price come to your levels.

XAUUSD (H3) – Liam PlanXAUUSD (H3) – Liam Plan
Late-stage expansion | Look for distribution and sell reactions
Quick summary
Gold has rallied aggressively and is now trading in late-stage bullish expansion, sitting near premium pricing after multiple impulsive legs.
On the macro side, political commentary from Europe highlights a structural shift in global power:
Europe’s influence is weakening as US–Russia discussions bypass Brussels.
BRICS and SCO now represent over half of the world’s population.
Calls for renewed EU–Russia energy cooperation underline long-term uncertainty in Europe’s geopolitical positioning.
This backdrop keeps gold structurally supported, but at current levels, risk shifts toward distribution rather than clean continuation.
Macro context (supportive, but asymmetric risk)
The global balance of power continues to shift from West to East, reinforcing long-term demand for hard assets.
However, much of the near-term geopolitical premium is already priced in after the recent vertical move.
Result: upside continuation is possible, but risk/reward now favors reaction sells over fresh buys.
➡️ Conclusion: don’t fight the macro trend, but don’t chase price either.
Technical view (H3 – based on the chart)
Gold remains in a broader uptrend, but price action shows signs of deceleration and potential distribution near the highs.
Key levels from the chart:
✅ Premium sell zone: 5000 – 5050 (upper range / distribution area)
✅ Sell reaction zone: 4920 – 4950 (local highs / rejection area)
✅ Bullish retracement support: 4700 – 4750 (fib + structure)
✅ Major liquidity / deep support: 4350 – 4450
Price is trading far above equilibrium, increasing the probability of rotation back into value or sell-side liquidity.
Trading scenarios (Liam style: trade the level)
1️⃣ SELL scenarios (priority – late-stage reaction)
A. SELL at premium / distribution zone
✅ Sell: 5000 – 5050
Condition: clear rejection / loss of momentum on M15–H1
SL: above the high
TP1: 4920
TP2: 4750
TP3: 4450 (if distribution expands)
Logic: Late-stage rallies often form rounded tops or distribution patterns before rotating lower. This zone favors risk-defined shorts, not breakout buys.
B. SELL lower high / reaction
✅ Sell: 4920 – 4950
Condition: failure to hold highs + bearish shift on lower TF
TP: 4750 → 4450
Logic: This area acts as a reaction zone inside the distribution range — ideal for tactical sells.
2️⃣ BUY scenario (secondary – value only)
BUY only at deep retracement
✅ Buy zone: 4350 – 4450
Condition: liquidity sweep + strong bullish reaction
TP: 4700 → 4920
Logic: This is the first area where long-term buyers regain a clear R:R edge. No interest in buying above value.
Key notes
Late-stage trends punish impatience.
Avoid mid-range entries.
Expect false breakouts near the highs.
Confirmation > conviction.
What’s your bias here:
selling distribution near the highs, or waiting patiently for a deeper pullback into 4700–4450 value?
— Liam

XAUUSD – H2 Technical AnalysisXAUUSD – H2 Technical Outlook: Pullback Builds Value Before the Next Expansion | Lana ✨
Gold continues to trade within a strong bullish structure on the H2 timeframe. The recent rally was clearly impulsive, and the current move looks like a technical pullback to rebalance liquidity, not a trend reversal.
📈 Market Structure & Trend Context
XAUUSD remains bullish, with the higher-high / higher-low structure still intact. Price is also respecting the ascending trendline, which has acted as key dynamic support throughout this uptrend.
The current sequence aligns well with a classic bullish cycle: Impulse → Pullback → Continuation. As long as structural support holds, Lana’s primary bias remains: BUY with the trend, not sell against it.
🔍 Key Technical Zones & Value Areas
Buy POC (Value Zone): 4764 – 4770 This area aligns with a high-volume node (POC/VAH) and the rising trendline, making it a strong value zone for dip-buying opportunities.
Near-term resistance: 4843 A key level that needs to be re-accepted to confirm the next continuation leg.
Psychological reaction zone: 4900 Likely to produce hesitation, profit-taking, or short-term volatility.
Upper expansion targets: 5000 and potentially the 2.618 Fibonacci extension, where higher-timeframe liquidity may be resting.
🎯 Trading Plan (H2 Structure-Based) ✅ Primary Scenario: BUY the Pullback
Buy entry: 👉 4766 – 4770
Lana prefers to engage only if price pulls back into the POC zone and shows bullish confirmation on H1–H2 (trendline hold, clear rebound / rejection of lower prices).
Stop Loss: 👉 4756 – 4758 (Placed ~8–10 points below entry, under the POC zone and below the ascending trendline)
🎯 Take Profit Targets (Scaled Exits)
TP1: 4843 First resistance — scale partial profits and reduce risk.
TP2: 4900 Psychological level — expect possible reactions.
TP3: 5000 Major psychological objective and expansion milestone.
TP4 (extension): 5050 – 5080 Potential 2.618 Fibonacci extension / higher-timeframe liquidity zone.
Lana’s approach is to scale out into targets, then protect the position by managing risk (e.g., moving SL to breakeven once price confirms continuation).
🌍 Macro Context (Brief)
Gold remains supported by its role as a safe-haven and strategic reserve asset amid ongoing geopolitical and financial uncertainty. Recent headlines highlighting the rise in the value of large gold reserves reinforce that institutional demand for gold as a long-term hedge remains active, which supports the medium-term bullish bias.
🧠 Lana’s View
This is a pullback within an uptrend, not a bearish reversal. Lana focuses on buying value, not chasing highs. Stay patient, trade the structure, and let price come into your zone.
✨ Respect the trend, stay disciplined, and let the market come to your levels.

XAUUSD – H2 Technical OutlookXAUUSD – H2 Technical Outlook | Lana ✨
Gold continues to trade within a strong bullish structure, and price action is confirming that the market is still respecting the ascending trend channel on the H2 timeframe.
📈 Market Structure & Trend Context
The overall trend remains bullish, with higher highs and higher lows clearly intact.
Price has successfully flipped the 4445–4450 zone from resistance into support, confirming strong buyer commitment.
The impulsive leg toward the current highs suggests we are still in a continuation phase, not a distribution phase.
🔍 Key Technical Zones & Liquidity
Buy resistance flip: 4445–4450
This zone has already shown clean reactions and acts as a structural base for further upside.
POC Buy zone: 4595–4600
This is a high-volume node where price is likely to rebalance liquidity before the next expansion.
Sellside liquidity sits just below current price, making a shallow pullback into value very possible before continuation.
🎯 Bullish Scenarios
Primary plan: Look for BUY setups on pullbacks into 4595–4600 (POC) with bullish confirmation.
Continuation target: If price accepts above current highs, the next upside objective sits around 4747, where higher-timeframe liquidity is resting.
A clean hold above the trendline keeps the bullish thesis valid.
🧠 Notes
Avoid chasing price at highs; wait for pullbacks into value and liquidity zones.
Trade in alignment with trend + structure, not short-term noise.
Patience is key while the market builds liquidity before the next expansion.
✨ Stay disciplined, trade the structure, and let price come to your zone.

XAUUSD (H1) – Powell Subpoena ImpactXAUUSD (H1) – Powell Subpoena Shock: Gold enters a high-volatility week, trade liquidity zones
News that the US Department of Justice has issued a criminal subpoena involving Fed Chair Jerome Powell is an extremely rare type of headline. When the market’s confidence in the Fed and US policy stability gets questioned, gold and silver can surge fast — but the price action often comes with violent two-way swings: a sharp push to grab liquidity, a hard pullback, then the real direction shows.
That’s why this week I’m not chasing candles. The best approach is to trade reactions at key liquidity / support-resistance zones and let the market come to your levels.
Macro context: why gold is moving differently right now
Pressure on the Fed (and its independence) can reprice expectations for rates, which directly hits USD and US yields.
If the market starts pricing aggressive cuts, gold tends to stay supported. But if yields whip around, gold can whipsaw too — fast.
So instead of predicting the headline outcome, the priority is simple: wait for price to hit clean technical zones.
Technical view (H1): uptrend structure holds, but price is trading in “premium”
The structure still sits inside an ascending channel. After a strong impulsive leg up, price is consolidating near the top — a common setup before another expansion, but also a zone where liquidity grabs are frequent.
Key zones to focus on
Sell zone (premium): 4655 – 4660
Buy zone (value): 4413 – 4417
Mid-range resistance (chop zone): around the 45xx area
Trading scenarios (Liam style: trade the level)
1) Primary plan: BUY the pullback into value
If price retraces into the major value support:
Buy: 4413 – 4417
SL: 4403
TP1: 4500 – 4520
TP2: 4655 – 4660
This is the “clean structure” setup: a reset into value, then continuation with the channel.
2) Short-term scalp: SELL the premium reaction
If price pushes into the major supply/liquidity zone:
Sell (scalp): 4655 – 4660 (only with clear rejection on H1/M15)
SL: 4670
TP: 4580 → 4520
This is a reaction sell — a common “profit-taking” area after headline-driven pumps.
3) Continuation setup: BUY after a confirmed hold above mid resistance
If price breaks and holds above the mid resistance (45xx area):
Look for a pullback after breakout to buy
Targets remain towards 4655–4660, then higher along the channel.
Conclusion
This is a headline-risk week, so the key is no FOMO and no entries in the middle of the range. The two zones that matter most:
Buy value: 4413 – 4417
Sell premium (short-term): 4655 – 4660
Which side are you leaning towards — waiting for the dip into 4415 to buy, or hunting a rejection near 4660 to sell?
👉 If this plan helps, follow LiamTradingFX to get the next XAUUSD updates early.

MCX GOLD future (short trade setup)61845 was the HIGH
60,000 to 59,500 has the bearish liquidity side where the price is getting rejected
also from the top to lower time frame lower high i.e. 5700 we got pullback and retraced back to 0.5 of fib zone which is giving selling pressure
the nearest LTF support we have is 58735 and further downfall we can see if this level break will be upto 57650 lvls in the short term gold is getting weak
as per chart pattern we can see double top or M pattern formed on 1h chart
58735 is also the neckline of the pattern which is import level to watch out on gold

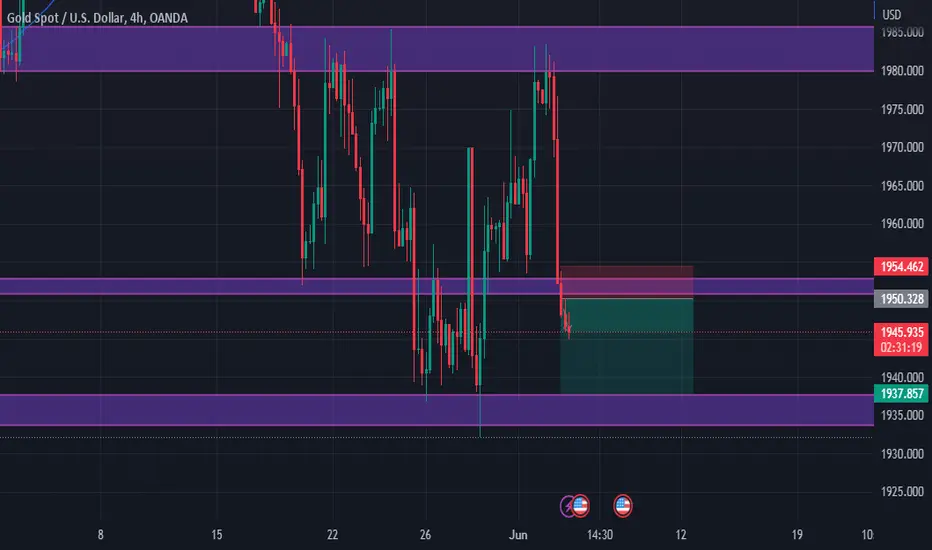
Gold or Nasdaq: What to Short this Week? Gold or Nasdaq: What to Short this Week?
For Gold (XAU/USD), the 4-hour chart suggests a neutral-to-bearish stance. While the pair is currently above its moving averages, the 50-day moving average is closely trailing its price. The Relative Strength Index (RSI) is dropping towards a neutral level, indicating a potential pause in buyer activity. If Gold drops below $1,945, there is a risk of prices descending further and retesting their previous lows or the 200-Day Simple Moving Average (SMA) around $1,941.
The deciding factor for Gold this week will likely be the US jobs data. The Non-Farm Payroll (NFP) report on Friday is a significant event, and the precursor jobs data (JOLTS Job report on Tuesday) could also sway traders. The market expects the NFP to show 190K jobs added, more than double the natural US growth rate. A strong jobs figure could influence traders' anticipation of the Federal Reserve's interest rate decision and impact the downside outlook for Gold.
On the other hand, Nasdaq and other major US indices are expected to end July with gains. The Dow Jones has particularly shown impressive growth over the past two weeks. The outperformance of the Dow Jones suggests a possible shift by investors from growth stocks (such as Nasdaq stocks) to value stocks.
Looking at the daily chart, the Nasdaq Composite is now targeting a key resistance level at 14,649. However, there is a possibility of aggressive seller response at that level. On the 4-hour chart, a divergence with the MACD indicates weakening momentum, which is often followed by pullbacks.
Earnings reports from major tech companies, Apple and Amazon, will be crucial for Nasdaq this week. These two giants represent 11.6% of the entire Nasdaq index measured by market cap. Better-than-expected US earnings could potentially prolong the bull run in the market.

GOLD 1:3 TradeGold Powerful 1:3 Trade
= Down Trend
= breaking their Support
= Price below the 200 EMA
= Positibe news For USD Coming soon (Bad for Gold)
= Proper Price action
Gold Bullish Butterfly IdentifiedBullish Butterfly
Buy PRZ - 59282-59338
SL - 50149
Target - 59700/59850/60000

sell gold 59800-830 sl small sl 59886 tgt 710--628sell gold 59800-830 sl small sl 59886 tgt 710--628 yes gap looking to fill take chance for sell with sl mkt cme gold spot looks also 1970-67$ near expect

perfect scenario sell for gold; Target 1840If the value of Gold crosses below 1854, Target expected is 1840. SL 1863
