GOLD RANGE PLAY — CLEAN SUPPLY & DEMAND REACTIONS AHEAD🧭 DAILY TRADING PLAN — GOLD (XAU/USD)
Date: Nov 3, 2025
Main Timeframe: M30 – H1
Strategy: SMC + Trendline Structure + Supply/Demand Zones
🌐 MARKET CONTEXT
Gold continues to consolidate inside a symmetrical triangle, forming clear supply and demand zones within a tightening range.
Current structure shows a bearish bias below 4039 but still holding a bullish base above 3970–3980.
Both buyers and sellers have clear liquidity zones to play from — ideal for short-term reactions and fade setups.
📈 TECHNICAL OUTLOOK
🔹 BUY SCENARIO 1 (Main Setup)
BUY 3980 – 3978
→ SL: 3973 (6 pips)
→ TP1: 4010 | TP2: 4038
Structure support + local BOS. Wait for bullish rejection or engulfing confirmation.
R:R ≈ 5–9 depending on TP target.
🔹 BUY SCENARIO 2 (Aggressive Entry)
BUY 3970 – 3968
→ SL: 3963
→ TP1: 4000 | TP2: 4038
Deep retest into lower trendline + demand imbalance zone.
Only valid if market respects structure and holds above 3960.
🔸 SELL SCENARIO 1
SELL 4027 – 4029
→ SL: 4034
→ TP1: 4000 | TP2: 3970
Short from supply zone with bearish CHoCH confirmation on lower timeframe.
Rejection at this level can target liquidity below 3980.
🔸 SELL SCENARIO 2 (Higher Supply)
SELL 4037 – 4039
→ SL: 4044
→ TP1: 4010 | TP2: 3970
This is the weak high area — potential sweep zone before reversal.
Look for liquidity grab + bearish candle confirmation before entry.
🧩 STRUCTURE RECAP
Bias: Range-bound → Bearish within triangle
BOS / CHoCH: Confirmed on M30 around 4029 zone
Weak High: 4039
Strong Support: 3970–3980
Major Resistance: 4045–4128
⚙️ TRADE MANAGEMENT
Risk per setup ≤ 1–2%
Move SL → BE after TP1
Avoid entries during high-impact news
Wait for confirmation (no blind limits)
🧠 SUMMARY
Gold is ranging within a compressed structure, where shorts from supply and buys from demand both align with liquidity targets.
The cleanest play remains:
→ Buy near 3978 / Sell near 4038, trade between zones until a breakout occurs.
If price breaks and holds above 4045, expect bullish continuation to 4128.
If breaks below 3960, bearish expansion likely resumes toward 3920.
Goldtrading

Gold Holds 3,980$ as Bulls Eye Recovery Toward 4,020$🔍 Market Context
Gold steadies near the 3,980$ mark as traders weigh shifting expectations on US interest rates.
The latest ADP employment report showed a modest increase of 42,000 jobs — easing fears of an accelerated slowdown but reinforcing the broader cooling trend in the labor market.
While the Federal Reserve’s rate cuts have supported bullion throughout the year, the prolonged US government shutdown now clouds macro visibility, delaying key economic data.
Despite mixed sentiment, gold remains one of 2025’s strongest-performing assets, up over 50% year-to-date, driven by ETF inflows and central bank demand.
📊 Technical Outlook (H1–H4)
Gold has staged a notable rebound from the 3,947$–3,969$ demand zone, reclaiming short-term structure and approaching the 3,990$–4,000$ liquidity pocket.
This area aligns with the 0.618 Fib retracement and descending trendline resistance — making it the next decision point for intraday traders.
Key Technical Zones:
• 💎 Support: 3,947$ – 3,969$ (Liquidity Base / Re-accumulation)
• 🎯 Resistance: 3,992$ – 4,024$ (Fibo 0.618 + Trendline Confluence)
• ⚙️ Extended Bull Target: 4,028$ – 4,033$ (1.272–1.618 Fibo Expansion)
• ⚠️ Invalidation: Below 3,940$ → shifts bias toward 3,905$ liquidity pool.
🎯 MMFLOW View
Smart money continues to accumulate within the re-accumulation pocket near 3,950$, hinting at latent bullish intent.
If price holds above 3,970$ after today’s consolidation, an extension toward 4,020$–4,033$ remains highly probable.
However, failure to maintain intraday demand could invite another liquidity sweep before a larger push higher.
⚜️ MMFLOW Insight:
“Liquidity reveals intention — structure only confirms it.”

XAUUSD – INTRADAY BULLISH SCENARIO – TARGET 4050💛 XAUUSD – INTRADAY BULLISH SCENARIO – TARGET 4050 🎯
🌤 1. Overview
Hello everyone 💬
Although the larger timeframe for gold still leans towards a bearish trend, today in the short term, I prioritise a bullish scenario.
On the M30 timeframe, the price structure is gradually increasing, indicating that short-term capital is shifting to the buying side.
Zone 3990 is a very important area – where a Break of Structure (BOS) has just appeared and is also a strong resistance that has reacted multiple times before.
Price needs to confirm breaking this zone to continue expanding the bullish trend.
💹 2. Technical Analysis (ICT Perspective)
📈 An ascending structure (BOS) has formed on M30.
🟣 Buy Zone 3977–3979 coincides with the support trendline – a beautiful confluence point for buyers.
🔹 Resistance zone 3990–4000 is the area to confirm the main direction.
💫 Higher target: Fibonacci Extension 1.618 around 4049–4050, coinciding with the psychological resistance 4050.
🎯 3. Trading Plan Reference
💖 MAIN BUY (priority)
Entry: 3977–3979 | SL: 3970
TP: 3988 – 4000 – 4022 – 4040 – 4050
💢 SHORT SELL (when price reacts strongly at resistance)
Entry: 4012–4014 | SL: 4020
TP: 4002 – 3988 – 3965
⚠️ 4. Important Notes
Price needs to confirm through zone 3990 to reinforce the bullish trend.
If it breaks below 3970, the ascending structure is temporarily invalidated.
Today, prioritise buying according to the capital flow, sell only when there is a clear signal at the resistance zone.
🌷 5. Conclusion & Interaction with LanaM2
Gold is showing positive signals 💛
Patiently wait for reactions at the Buy Zone 3977–3979, this could be the starting point for a new upward move towards 4050.
This is not investment advice, just a personal perspective according to the ICT method.
If you find it useful, please 💛 like – 💬 comment – 🔔 follow LanaM2 to update gold analysis with me every day ✨

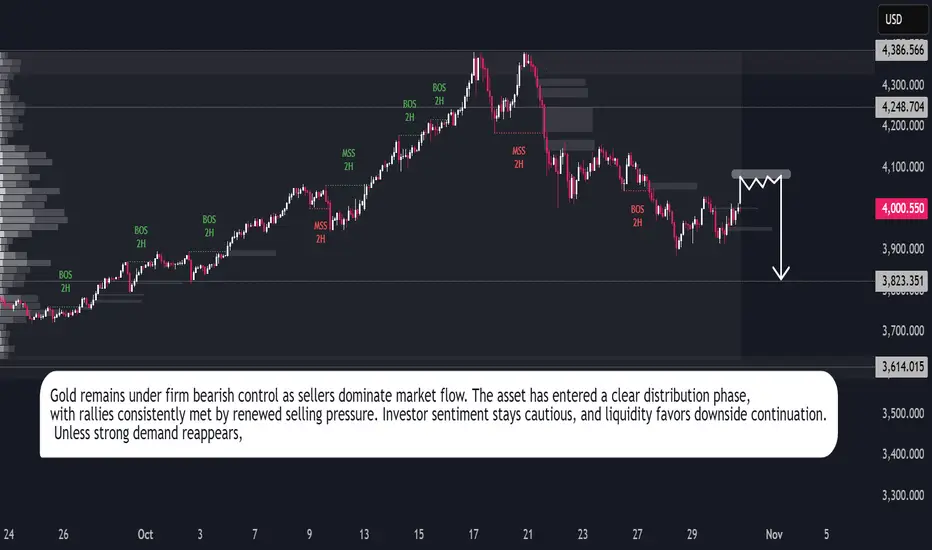
Gold Outlook: Bears Stay in ControlGold continues to operate within a bearish market environment characterized by persistent liquidation and declining momentum. The recent structural shift reflects an ongoing reallocation of capital away from defensive metals toward higher-yield instruments, signaling a broader change in market positioning.
Trading activity indicates that each upward movement is being met with renewed selling interest, suggesting limited participation from institutional buyers. This behavior aligns with the prevailing sentiment of caution, as investors prioritize stability over speculative exposure.
The broader outlook remains subdued, with market conditions favoring continued downside until clearer evidence of renewed demand emerges. Gold’s performance reflects a phase of market adjustment, where declining liquidity and moderate volatility reinforce the persistence of bearish sentiment across the short-term horizon.
XAUUSD – PRIORITISE BUYING, TARGET 4040XAUUSD – PRIORITISE BUYING, TARGET 4040 🎯
🌤 1. Overview
Hello everyone 💬
My perspective on gold today remains to prioritise buying, as there hasn't been a clear deep decline.
The price is currently consolidating in a narrow range, needing more time to build momentum before breaking out.
I will wait to buy back at the OB area – where there is high liquidity, this is a region likely to see strong price reactions.
The best scenario today: the price may sell lightly at FVG, then drop to OB to trigger the buy setup.
💹 2. Technical Analysis (ICT Perspective)
💜 Price Structure: Gold still maintains a short-term uptrend, the main trend hasn't been broken.
💎 Liquidity: Liquidity is concentrated below the 3940 area – potential buying OB.
💫 FVG: The 3975–3980 area is where a slight decline reaction may occur.
⚙️ Order Block (OB): 3938–3945 is a crucial support area, with potential for a strong price rebound from here.
📈 Main Target: 4040 – high liquidity area, coinciding with the large frame FVG.
🎯 3. Reference Trading Scenario
💢 Short SELL (scalping)
Entry: 3980 | SL: 3988
TP: 3972 – 3960 – 3940
💖 Main BUY (priority)
Entry: 3940 | SL: 3932
TP: 3952 – 3968 – 3990 – 4012 – 4035
✨ 4. Important Notes
🔹 Observe price reactions at FVG and OB before taking action.
🔹 If the price exceeds 3988, the decline scenario is temporarily invalidated.
🔹 The main direction remains to buy following the Smart Money trend – only look for short sells with confirmation.
🌷 5. Conclusion & Interaction with LanaM2
Gold is still on the right track of the Smart Money Flow,
patiently wait for the price to reach a favourable area to act 💪
This is not investment advice, just a personal perspective based on the ICT method.
If you find it useful, please 💛 like – 💬 comment – 🔔 follow LanaM2
to stay updated with the latest gold insights every day.

GOLD PULLBACK BEFORE FINAL LEG DOWN🧭 DAILY TRADING PLAN – GOLD (XAU/USD)
📅 Date: Nov 04, 2025
📊 Main timeframe: H2 confirmation + M30 execution
🎯 Strategy: SMC + Liquidity Grab + OB Rejection
MARKET CONTEXT
Gold is currently trading around the 3970 zone after a clear Break of Structure (BOS) on the M30 timeframe, confirming short-term bearish pressure. On the H2 chart, price remains in a descending channel, forming lower highs since 4128 → 4006, aligning with overall bearish sentiment.
Recent CHoCH signals on M30 indicate that buyers tried to defend the 3980–3970 area twice but failed to sustain momentum. Liquidity was swept below minor lows, suggesting a potential continuation toward deeper liquidity pools near 3960–3955.
KEY LEVELS
SELL ZONE 1: 4025–4027
SELL ZONE 2: 4011–4013
BUY ZONE 1: 3980–3978
BUY ZONE 2: 3970–3968
TRADING IDEA
Current bias: Bearish, expecting a pullback before continuation.
If price retraces to 4011–4027, watch for rejection and BOS on M5/M15 to enter short.
TP1: 3978, TP2: 3960
SL: above 4027 (≈6 points)
Alternatively, if price sweeps liquidity below 3968 and shows strong CHoCH upward, consider scalp long back to 3980–3990, with SL below 3962 (≈6 points).
CONFIRMATION
M30: BOS down confirmed after CHoCH
H2: Resistance zone rejection aligning with trendline + EMA confluence
RSI showing mild bearish momentum, not yet oversold → room for downside continuation
OUTLOOK
As long as price remains below 4027, the bearish structure holds. Watch for liquidity grabs at support zone 3960–3970 before a potential short-term retracement. A clean break above 4030 would invalidate this plan and flip bias to neutral.
📌 Plan Summary
🎯 Sell the pullback at 4011–4027
🎯 TP: 3978 / 3960
🛑 SL: 4027 (6 points)

Gold Pauses Below $4,000 as Markets Digest Hawkish Fed Tone🔍 Market Context
Gold struggles to find direction in early Asia, hovering just below the $4,000 psychological level after the Fed’s hawkish remarks dampened bullish momentum.
Chair Jerome Powell reaffirmed that another rate cut this year is “not a given”, keeping yields supported and safe-haven demand balanced.
Meanwhile, ISM Manufacturing PMI fell to 48.7, signalling cooling momentum but not enough to alter the Fed’s cautious stance.
With odds of a December rate cut near 70%, gold remains trapped between policy uncertainty and soft macro sentiment.
📊 Technical Outlook (H1–H4)
Price is consolidating within a tight structure between 3,963$ and 4,024$, showing compression before a potential expansion move.
The 3,984$–3,963$ zone acts as short-term liquidity support, aligning with the rising intraday trendline.
Key Levels
• 💎 Liquidity Support: 3,963$ – 3,984$
• 🎯 Immediate Resistance: 4,024$
• ⚙️ Bullish Target: 4,046$ (liquidity sweep + expansion zone)
• ⚠️ Invalidation: Below 3,923$, bias shifts to neutral
A clean breakout above 4,024$ could trigger a move toward 4,046$, while failure to hold above 3,963$ may invite another liquidity grab before buyers re-enter.
🎯 MMFLOW View
Smart money remains patient.
As long as 3,963$ holds, dips are seen as accumulation rather than weakness.
But conviction only returns when liquidity confirms above 4,024$ — that’s where momentum aligns with intent.
⚜️ MMFLOW Insight:
“Liquidity doesn’t chase price — it creates the path for it.”

LiamTrading - $XAUUSD$: Second Scenario – BUY UP Priority ...LiamTrading - OANDA:XAUUSD $: Second Scenario – BUY UP Priority After BREAKING RESISTANCE $4002$
With the Support of the US Treasury Secretary
Hello traders community, LiamTrading is back with detailed OANDA:XAUUSD $ analysis for the start of the week!
The Gold market is receiving strong support from policy: US Treasury Secretary Scott Bessent calls on the Fed to continue cutting interest rates as the PCE inflation is currently at $2.7\%$.
This call, aimed at reducing mortgage rates and supporting the housing market, strengthens the long-term outlook for Gold.
Technical Analysis: We prioritize continuing to buy up following the main trend. The best strategy is to enter orders at strong resistance/support zones to ensure the lowest risk.
📰 MACRO FUNDAMENTALS: CALL FOR RATE CUT
Impact: The Treasury Secretary's statement on cutting interest rates to support the "transitioning" economy increases expectations of policy easing, which is a strong support factor for Gold (although not yet an official decision).
Suitable Strategy: Market sentiment is being driven by expectations of easing policy, reinforcing the priority for a BUY (Long) position.
📊 TECHNICAL ANALYSIS: IMPORTANT PIVOT POINT
Resistance Zone $4002$: This area acts as an important pivot point.
Buy Entry will be triggered after the price breaks resistance $4002$ and retests.
Sell Entry: Look for short-term scalping at the resistance zone $4030$ to secure profits. Highlighted Zone: Prioritize entering orders at confirmed Trendline zones.
🎯 DETAILED TRADING PLAN (ACTION PLAN)
We will wait for Gold to break structure and create a BUY setup.
🟢 Main BUY Scenario (BUY Break & Retest)
Logic: Buy at $4002$ after breaking resistance and retesting, leveraging new upward momentum.
Entry (BUY): $4002$
SL: $3995$ (tight SL)
TP1/TP2: $4020$ | $4035$
TP3: $4070$
🔴 SELL Scalping Scenario
Logic: Short-term scalping at the strong resistance zone $4030$ (near Sell Liquidity zone).
Entry (SELL): $4030$
SL: $4038$
TP1/TP2: $4015$ | $4004$
TP3: $3990$
📌 SUMMARY & DISCIPLINE (Liam's Note)
Our BUY strategy is reinforced by policy outlook and technical break at $4002$. Strictly adhere to SL $3995$ to manage risk before the upward structure is confirmed.
Are you ready for Gold's movement at $4002$? Please LIKE and COMMENT!

LiamTrading - $XAUUSD$: NEW WEEK TRADING SCENARIO...LiamTrading - OANDA:XAUUSD $: NEW WEEK TRADING SCENARIO – PRIORITISE SELLING After BREAKING THE TRENDLINE
Hello traders community,
The new week opens with a clear strategy: Prioritise SELLING after Gold has broken the previous upward trendline.
Although fundamental economic news (like interest rate policies and politics) supports Gold potentially reaching the $5,000$ USD mark, we must trade according to the current Price Action. The technical selling pressure is strong. We will SELL at key resistance zones and continue SELLING as the price breaks the downward structure.
📰 FUNDAMENTALS & LONG-TERM OUTLOOK
$5,000$ Prospect: Fundamental and political factors continue to support the scenario of Gold reaching $5,000$ USD in the long term (due to geopolitical risks and potential loss of Fed independence).
Short Term 🔴: Gold is under technical selling pressure after breaking through the $4,000$ USD mark.
📊 TECHNICAL ANALYSIS: TRENDLINE BREAK
Structure: Gold has exited the upward price channel and is retesting the broken trendline.
Priority: SELL at the retest resistance zone $4024$.
🎯 DETAILED TRADING PLAN (ACTION PLAN)
🔴 SELL Scenario (SELL Primary) - Preemptive Resistance
Entry 1: $4024$ (Sell retest trendline zone)
SL: $4032$
TP1/TP2: $4012$ | $4000$
TP3: $3989$
Entry 2 (Continuation SELL): When price breaks the next trendline at $3992$
SL: $4000$
TP: $3940$
🟢 BUY Scenario (BUY Reversal) - Buy at Strong Support
Logic: Only buy when price hits strong liquidity support, potential for a short-term rebound.
Entry (BUY): Around $3960$ (Buy Scalping Zone)
SL: $3954$
TP1/TP2: $3972$ | $3988 FWB:TP3 : $4000$
📌 SUMMARY & DISCIPLINE (Liam's Note) Don't let the $5,000$ USD prospect affect short-term risk management. Trade according to Price Action. Adhere to SL and prioritise SELL positions at resistance zones.
Are you ready for the SELL strategy at the start of this week?

XAU/USD – Gold Maintains Short-Term Uptrend, Target $4,108🔍 Market Context
Gold continues to uphold a short-term uptrend structure after forming a clear Change of Character (ChoCH) around the 3,926 USD zone.
Buyers are in control as prices consistently create higher lows and react positively at the Order Block + Supporting Trendline zone.
As long as prices remain above the 3,940–3,926 USD area, the uptrend structure is preserved.
💎 Key Technical Zones
• Order Block Bullish: 3,926 USD → main support zone, confluence with rising trendline.
• Fair Value Gap (FVG): 3,942 – 3,972 USD → potential liquidity absorption zone.
• Resistance Zone: 4,032 USD → short-term resistance, needs to be broken to confirm continued uptrend.
• Liquidity Zone: 4,108 USD → expansion target if the above resistance is breached.
🎯 Trading Scenarios
1️⃣ BUY Setup – Prioritise catching the retracement from support zone
• Entry: 3,942 – 3,926 USD
• Stop Loss: 3,910 USD
• Take Profit:
– TP1: 3,972
– TP2: 4,032
– TP3: 4,064
– TP4: 4,108
✳️ “Buy the discount” – Prioritise orders in the confluence zone of OB + FVG to follow Smart Money flow.
2️⃣ SELL Scalp – Short-term at resistance zone
• Entry: 4,032 – 4,048 USD
• Stop Loss: 4,060 USD
• Take Profit:
– TP1: 4,010
– TP2: 3,972
– TP3: 3,942
✳️ “Sell the premium” – Activate only if clear price rejection signals appear at resistance.
💬 Summary
The current structure still leans towards bullish short-term with the 3,926 USD zone as the key invalidation zone .
As long as prices stay above the trendline, the immediate target is the 4,108 USD liquidity zone.
Optimal strategy: Buy on dip – Sell on reaction.
“Smart Money buys fear, sells greed — follow the footprints, not the noise.”
⏰ Timeframe: 1H
📅 Update: 31/10/2025
✍️ Analysis by: Captain Vincent

LiamTrading - XAUUSD: Outlook $5,000 USD and Priority BUY... LiamTrading - XAUUSD: Outlook $5,000 USD and Priority BUY Strategy at POC $3973
Hello traders community,
Gold is positioned between an extremely optimistic long-term outlook (forecast $5,000 USD in the next 12-18 months by Bank of America) and short-term technical adjustments.
Although Gold has broken the upward trendline, a sustainable downward trend has not been confirmed.
BUY positions are still prioritised!
🔥 LONG-TERM CONTEXT & INFLATION
Long-Term Push: Gold prices adjusted for inflation have DOUBLED in the past 4 years.
Highlight: Gold reinforces its role as an anti-inflation asset as real prices soar to all-time highs.
📊 DETAILED TRADING PLAN (ACTION PLAN)
Strategy: Buy at POC Zone to leverage liquidity advantage.
🟢 BUY Scenario (BUY Primary) - Buy at High Value Zone
Logic: The $3973 - 3975$ zone is right above the Buy POC (highest value zone).
Entry (BUY): $3973 - 3975$
SL: $3968$
TP1: $3988$ | TP2: $4000
Buy Up Target 2: Buy when price retests the trendline around $4002$.
🔴 SELL Scenario (SELL Scalping) - Preemptive strike at resistance zone
Entry (SELL): $4032 - 4034$
SL: $4040$
TP1: $4022$ | TP2: $4015
📌 SUMMARY & DISCIPLINE (Liam's Note)With the $5,000 USD forecast and inflation factors, the risk of SELL is increasing.
Focus on BUY at POC $3973$ and absolute SL.
Trade responsibly and with discipline!

🇺🇸 IMPACT OF FED AFTER FOMC DECISION🇺🇸 IMPACT OF FED AFTER FOMC DECISION
Hello traders,
The latest Federal Reserve rate decision shook global markets — pushing Gold (XAUUSD) and Bitcoin lower while the US Dollar strengthened sharply.
The Fed cut interest rates for the second time this year, bringing them down to 3.75%–4%, but the announcement to end Quantitative Tightening (QT) by 1st Dec 2025 was the real game changer.
This is the moment to stay calm, read the market structure, and act according to your plan.
📰 MACRO ANALYSIS – THE FED’S DOUBLE IMPACT
Rate Cut (Normally Bullish for Gold):
The second rate cut should, in theory, support Gold prices. However, much of this was already priced in before the announcement.
QT Ending (USD Strength Booster):
Ending QT signals that the Fed is trying to rebalance its monetary stance. This boosted the US Dollar Index (DXY), putting heavy selling pressure on both Gold and BTC.
Market Reaction:
Gold saw a sharp drop right after the announcement, then moved sideways in a wide range. During today’s Asian session, Gold fluctuated nearly $70 before retracing slightly.
📊 TECHNICAL OUTLOOK – WIDE RANGE, BUILDING BULLISH STRUCTURE
Looking at the current XAUUSD market structure:
Structure: Gold is currently consolidating in a wide range. However, a bullish structure seems to be forming with higher lows — a sustainable Dow-style uptrend pattern.
Trading Plan: Stay flexible and trade both sides —
🔴 Sell (Short) near liquidity resistance zones.
🟢 Buy (Long) from deep liquidity supports.
🎯 TRADING ACTION PLAN
🔴 SELL CONTINUATION – Short from Resistance
Entry Zone: 4005
Stop Loss: 4013
Targets:
TP1: 3990
TP2: 3975
TP3: 3960
TP4: 3943
🟢 BUY RECOVERY – Long from Support
Entry Zone: 3907–3909
Stop Loss: 3902
Targets:
TP1: 3933
TP2: 3954
TP3: 3970
TP4: 3999
⚖️ FINAL THOUGHTS
The Fed’s decision has reshaped the short-term outlook.
A $70 volatility range shows Gold’s high liquidity — but also high risk.
📌 LiamTrading’s Note:
A strong bullish structure is building up on the lower timeframes. Patience is key — wait for the ideal Buy zone near 3907 to catch the next recovery leg.
Always maintain strict risk and capital management, especially during post-FOMC volatility.
Are you ready to ride this 70-dollar range?
👉 Tap LIKE 👍 and COMMENT your setup!

Gold Extends Decline Below $4,000 as Risk Appetite Returns🔍 Market Context
Gold continues to weaken as renewed optimism over US–China trade relations reduces safe-haven demand.
Despite the Fed’s dovish tone after the latest FOMC meeting, the Dollar remains relatively capped, offering limited support to bullion.
However, the technical landscape remains bearish — the decisive break below the $4,000 handle signals a continuation of the downside structure that’s been unfolding since early in the week.
📊 Technical Analysis
• Structure: Clear downtrend across H1–H4, with consistent lower highs and controlled liquidity sweeps.
• Key Resistance: 3,985 – 4,000 (former support now turned supply).
• Short-Term Targets:
– 3,925 – 3,930 → initial liquidity pocket.
– 3,880 – 3,860 → extended bearish target aligned with Fibo 1.618 extension.
• Invalidation: Only a confirmed break & hold above 4,020 – 4,030 would shift bias neutral-to-bullish.
🎯 Trading Outlook
If gold retests the 3,985–4,000 zone and fails to reclaim it, sellers are likely to extend control toward 3,920 or lower ahead of the FOMC-driven volatility.
Momentum remains bearish as long as the market trades below the 4,000 pivot — liquidity below 3,900 may attract smart money before any meaningful rebound.
⚜️ Summary
This decline isn’t random — it’s a structural reset.
The market is rebalancing after months of overextended bullish sentiment.
Watch how price reacts between 3,920–3,880 — this zone could define the next shift in gold’s short-term direction.
📊 MMFLOW TRADING Insight:
“Smart money doesn’t chase candles — it waits for liquidity to shift.”
GOLD | Is This the FINAL Short Setup Before the Next Move? Welcome Traders!
Forget the noise — focus on structure and sentiment. Gold is holding firm near $3,950, but the macro backdrop just got tighter.
The question now: Can demand strength beat Powell’s new hawkish tone?
1. Market Insight – Powell vs. Demand
Two forces are pulling Gold in opposite directions:
🐻 Bearish Catalyst:
Powell hinted that another rate cut in December is unlikely, and the Fed plans to continue balance sheet reduction — strengthening the USD and weighing on non-yielding assets like Gold.
🐂 Bullish Support:
Persistent central bank demand and ETF inflows continue to provide a safety net, tightening overall Gold supply.
🎯 Outlook:
Expect sideways compression before a potential breakout. We’re stalking the strategic Sell Zone to align with the bearish fundamentals.
📊 2. Structure Check – Where Bears Wait
The market is approaching a major confluence zone:
SELL LIMIT Zone: $4,057 — intersection of the descending trendline and key horizontal resistance.
Immediate Support: $4,005 — target for the first leg down.
3. Action Plan – The Short Sniper Setup
Entry: SELL LIMIT $4,057
Stop-Loss: just above the descending trendline
TP1: $4,005 (short-term support retest)
Extended Target: $3,938 if breakdown accelerat
Powell’s hawkish tone is clear — but will bears finally take control from $4,057$, or will central bank demand defend the rally?

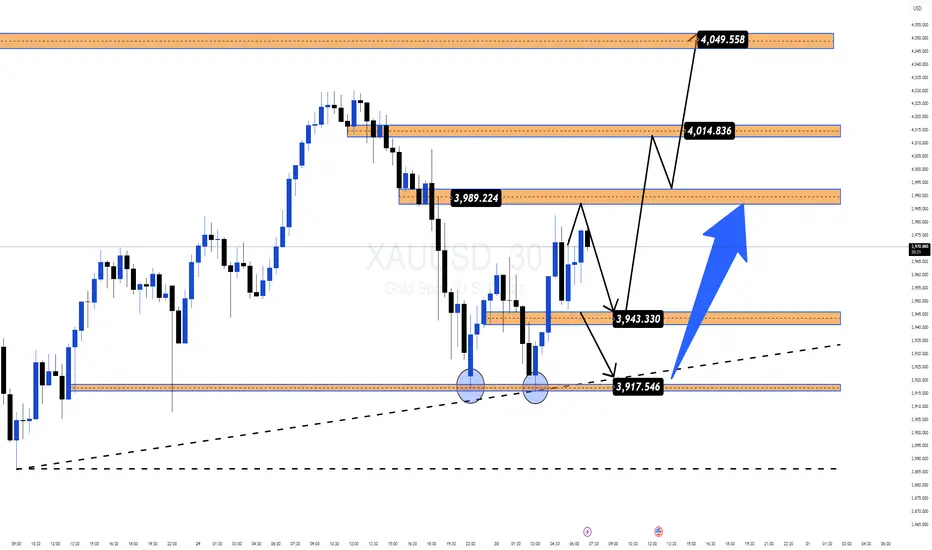
Gold Recovers 1000 Pips Ahead of FOMC: Key Levels in Focus📊 Market Overview
After a sharp selloff that shook long positions, Gold has rebounded nearly 1000 pips, recovering from the 388x area toward 398x ahead of the upcoming FOMC meeting.
Despite the short-term recovery, Gold remains down around 3.5% this week, showing caution as traders reposition before the Fed decision and amid easing U.S.–China trade tensions.
Currently, the price is trading near $3,980–3,990 during the Asian session, consolidating below the psychological $4,000 mark.
💎 Technical Outlook (H1–M15)
Gold continues trading in a short-term ascending channel, showing a corrective recovery inside a larger downtrend.
Immediate Support Zones:
• 3,961 – 3,937 → Trendline retest & OBS Buy Zone
• 3,918 → Structural invalidation area
Resistance & Key Reaction Levels:
• 4,018 – 4,085 → Mid-term resistance
• 4,094 – 4,102 → Major Sell Zone (Fibo 1.5–1.618 confluence)
📍If Gold breaks and holds above 4,018, momentum could extend toward 4,085–4,102.
📍If it rejects near 4,094–4,102, a correction toward 3,961–3,937 is likely.
🌍 Macro Context – FOMC Ahead
Markets expect a 25bps rate cut. A hawkish tone from Powell may pressure Gold, while a dovish one could send it above $4,100.
🧭 Summary
Gold keeps a short-term bullish bias but remains fragile ahead of FOMC.
Expect volatility around 4,000–4,100; key reactions near 4,094–4,102 will decide the next move.
🛡 Stay patient — liquidity builds before clarity.
GOLD (XAU/USD) — Calm Before the FOMC Storm Gold is currently consolidating above $3,950, signaling a pause in volatility as traders await the FOMC decision for the next directional move.
1️⃣ Macro Outlook & Core Bias – FOMC in Focus 🔑
Market Pause: After rebounding during the Asian session, Gold’s upside momentum remains limited. Market participants are cautious ahead of the Fed’s policy update.
Headwinds: Renewed optimism on US–China trade and a slightly stronger USD are capping Gold’s advances.
Game Plan: Stay tactical — identify scalp zones and prepare for a major breakout once the FOMC event unfolds.
2️⃣ Technical Setup – Descending Channel in Play 📉
Structure: Price action is holding above $3,950, but movement remains confined within a descending channel/flag.
Bias: Short-term demand persists, yet the broader structure still favors bears.
Preferred Setup: Watch for BUY scalps from lower demand zones toward the Fibo/channel resistance area.
3️⃣ Trading Plan – Precision & Patience 💰
🟩 BUY Scenario (Long Scalp)
Buy Zone: $3,939.468
Strategy: Look for long scalps targeting the Fibo 0.5 resistance.
Stop-Loss: Tight SL just below the $3,939 level.
🟥 SELL Scenario (Short Setup)
Scalp Sell Zone: $4,015.646 (Fibo 0.5)
→ Short scalps targeting a retest of the channel midline.
Main Sell Zone: $4,046.448 (Fibo 0.618 / Channel Ceiling)
→ Ideal entry for a continuation short, aligning with the overall bearish channel.
4️⃣ Trader’s Take 🚀
The FOMC decision will set the tone —
Are you eyeing a bounce from $3,939, or waiting for the $4,046 rejection to ride the next wave down?

Gold Extends Decline Below $4,000 as Risk Appetite Returns🔍 Market Context
Gold continues to struggle amid renewed optimism around US–China trade talks.
The shift in sentiment has reduced safe-haven demand, while softer expectations of further Fed rate cuts keep the US Dollar capped — offering limited downside support for XAUUSD.
However, the technical landscape remains clearly bearish.
The break below the ₹4,000 handle confirms continuation of the downtrend first outlined in early-week plans.
📊 Technical Analysis
Structure: Gold maintains a clean bearish channel on the H1–H4 frame.
Immediate resistance: ₹3,985 – ₹4,000 (former support, now supply zone).
Target zones:
• Short-term liquidity area near ₹3,925–₹3,930
• Extended target sits around ₹3,880–₹3,860, aligning with Fibo 1.618.
Invalidation: Only a sustained break and hold above ₹4,020–₹4,030 would neutralize this short-term bearish bias.
🎯 Trading Outlook
If gold retests the broken ₹4,000 zone and fails to regain it,
expect sellers to extend control toward ₹3,920 or lower ahead of the FOMC meeting.
That event may later define the next recovery point — but for now, momentum remains firmly on the downside.
⚜️ Summary
Gold’s recent slide isn’t random — it’s structural.
The market is rebalancing after excessive bullish sentiment,
and liquidity below ₹3,900 is likely to attract attention before any significant rebound.
Watch the reaction near ₹3,920–₹3,880 —
that’s where the next meaningful decision for gold may emerge.
📊 MMFLOW TRADING Insight:
Smart money doesn’t chase candles — it waits for liquidity to shift.

GOLD DIP ALERT! Sniping the $3,89x FIBO Floor Ahead of FOMC!FranCi$$_FiboMatrix Quick Insight (H1/M30 Focus)
Welcome Traders! Gold paused its sell-off near $4,065 as safe-haven demand returned pre-FOMC. Dovish Fed expectations are weakening the USD, setting the stage for a major rally. This is the final BUY ON DIPS setup!
🧠 INSIGHT & LOGIC
Fundamental Anchor: Weak US inflation and strong expectations for a Fed rate cut are the key drivers limiting downside. Long-term bias is Bullish.
Technical Focus: We are tracking the final deep correction to the $3,89x zone (Fibo 1.5 - 1.618 Extension). This is the ultimate technical floor for the ATH rally.
Action Plan: WAIT for the price to hit this extreme zone and confirm reversal (H1/M30).
🎯 KEY ACTION ZONES
🔥 CRITICAL BUY: $3,89x region ($3,881.435$).
Strategy: BUY on confirmation here.
TP TARGET 1: $4,037.647 (Immediate Resistance).
TP TARGET 2: $4,232.374 (Major Structural Resistance).
SL MANDATE: Place SL safely below the 1.618 Fibo zone.
Patience is key. Do NOT rush the entry! Is the $3,89x$ floor strong enough for the ATH rally? 👇

GOLD DIVE—Sniping the $405x Dip Before FOMC!Welcome Traders! Gold (XAU/USD) is correcting sharply, dropping 1.10% towards $4,065. This weakness is driven by trade optimism, but the underlying Fed rate cut expectation keeps our BUY ON DIPS strategy highly profitable!
🧠 MARKET PSYCHOLOGY (MIND)
Bears' Power: Trade optimism is pushing safe-haven assets down. Sellers are targeting the recent uptrend structure.
Bulls' Anchor: Weak US inflation data means a Fed rate cut is almost certain (25 bps expected). This long-term USD weakness acts as a floor for Gold.
Action Bias: BUY THE DIP at critical Fibo supports, anticipating the Fed decision to fuel the next rally.
📊 KEY LEVELS & ACTION ZONES (H1)
We are using the Fibo retracement from the recent high to define our optimal entry points.
🎯 SELL TARGET / CEILING: $4,164.938 (Zone 416x). This is the immediate resistance and the ultimate target for the Long trade.
🔥 HIGH-CONVICTION BUY ZONE: $4,048.493 (Fibo 0.5 Zone 405x). The optimal entry to maximize risk/reward.
Strategy: Wait for a clean tag and H1/M30 reversal signal here.
⚡️ SCALP BUY REACT ZONE: $4,077.605 (Zone 407x). A quick bounce area for aggressive buyers.
❌ INVALIDATION: SL must be placed safely below the 0.618 Fibo level of the 405x zone.
📈 TRADING PLAN SUMMARY (DIP BUY)
Entry Focus: Prioritize the $4,048.493 (405x) Fibo Zone for a high-quality Long entry.
SL Placement: Strict SL below the 0.618 Fibo of the 405x zone.
TP Target: Aim for the recent high at $4,164.938 (416x).
💬 TRADER'S QUESTION
The drop is here! Are you buying the aggressive 407x level or patiently waiting for the optimal 405x Fibo zone before the expected Fed cut rally?

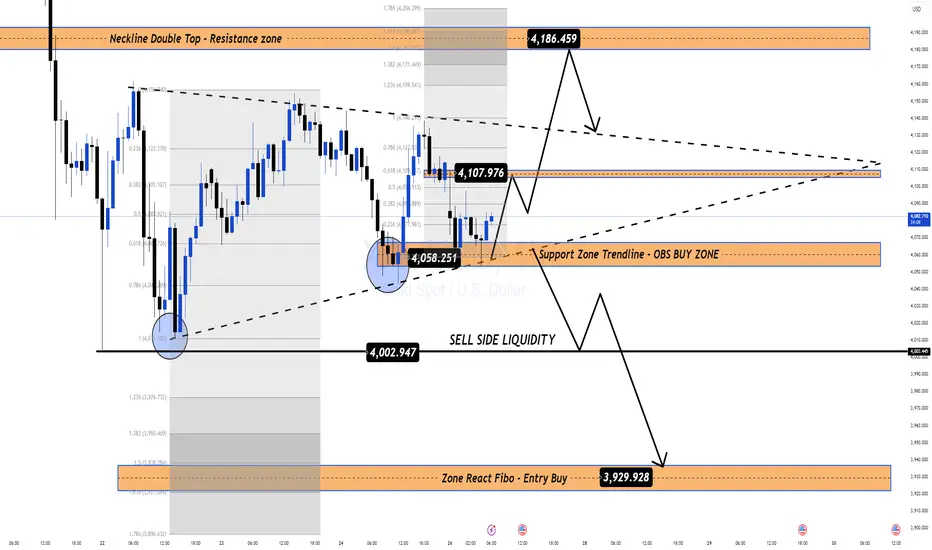
Gold Awaits FOMC Breakout While Holding Key Liquidity BaseMarket Overview:
Gold remains trapped in a tight range as traders weigh optimism from US–China trade progress against cautious expectations for the upcoming FOMC meeting.
The macro picture feels balanced: risk sentiment improves, yet the weaker USD and lingering Fed cut expectations quietly support the metal.
In essence, gold isn’t trending — it’s coiling.
Liquidity is being built, not lost.
Every test of 4,050–4,060 shows strong absorption, while short-term sellers are still defending the 4,186–4,260 region.
The market is waiting for a trigger,
and the FOMC might be the one that decides which side breaks first.
Technical Structure (H1)
Price continues to respect the ascending support trendline from 4,003 and the neckline resistance near 4,107.
This structure has the DNA of a compression model — narrowing volatility, thinning liquidity, preparing for expansion.
If the support at 4,050 holds, a retest of 4,107 → 4,186 remains likely before the next decision point.
Conversely, a liquidity sweep under 4,002 could form the last dip before a bigger rally unfolds.
Key Structural Levels:
Support / Accumulation Zone: 4,058 – 4,050
Mid-Level Pivot / Neckline: 4,107
Upper Supply Zone: 4,186 – 4,260
Deep Liquidity Pool: 4,002 – 3,930
MMFLOW Perspective:
For now, gold is accumulating energy — this is not a breakout market, it’s a build-up market.
Price action above 4,050 still favours the bulls, but conviction will only return once we see a clean break beyond 4,186.
Ahead of FOMC, patience is strategy.
The next wave won’t come from guessing policy —
it’ll come from reading the flow once volatility hits.
Summary:
Gold’s structure remains stable — liquidity is concentrated below 4,050, and compression continues within the 4,060–4,186 band.
Bias stays neutral-to-bullish as long as the liquidity base holds.
📊 What’s your take?
Will the FOMC spark the breakout, or is gold just reloading for the next wave?
👉 Follow MMFLOW TRADING for institutional flow analysis and smart money structure updates.
How Smart Money Moves Gold (XAUUSD)Every spike, every fake breakout, every sharp reversal… it’s all part of a bigger plan by smart money (institutions) to trap emotional traders and collect liquidity.
Let’s break it down 👇
⚡ 1️⃣ Liquidity Grab (The Trap Phase)
Before any real move, gold sweeps stop-losses above highs or below lows.
Retail traders think it’s a breakout — but it’s actually a liquidity hunt.
Smart money fills large positions here while emotions run high.
⚡ 2️⃣ Market Structure Shift (The Clue)
After collecting liquidity, watch for a BOS (Break of Structure) or CHoCH (Change of Character) — these reveal when the real move is starting.
⚡ 3️⃣ Smart Money Entry (The Real Move)
Once the trap is set, gold often makes a strong impulsive push.
This is where institutions enter — and where smart traders follow with confirmation, not emotion.
⚡ 4️⃣ Emotional Traders Lose, Logical Traders Win
The market doesn’t hate you — it simply feeds on emotional reactions.
Be patient, wait for liquidity sweep ➜ structure shift ➜ confirmation entry.
🧭 Pro Tip:
👉 Stop chasing candles.
👉 Study liquidity and market structure.
👉 Let the chart show who’s trapped — and then trade against them.
💬 Remember:
“The market rewards patience, not panic.”
💎 Gold (XAUUSD) moves on liquidity — not luck.
#TradeSmart #ThinkLikeInstitutions #XAUUSD

$4,005 BROKEN! GOLD READY FOR CPI COLLAPSEFranCi$$_FiboMatrix Emergency Action Plan (H1 Focus)
Welcome Traders! Gold (XAU/USD) has attracted sellers and is now trading below $4,100. With the US CPI release looming, the DOWNSIDE BREAKDOWN is our highest conviction scenario!
1. Market Snapshot
Current State: Gold is consolidating in a Sideway Zone between $4,159 (Resistance) and $4,005 (Critical Support).
Pressure: The recent break below $4,100$ and the recovering USD are key bearish factors.
The Catalyst: US CPI today. A hot inflation print will fuel the USD and shatter the $4,005$ floor.
Dominant Risk: Break below $4,005.438$ confirms the major bearish trend targeting $3,889$.
2. MAIN TRADING PLAN: Breakdown Scenario (SHORT) 💰
We are setting the trap to execute the SELL trade immediately upon the decisive breach of the $4,005$ Support.
Activate SHORT: Breakdown below $4,005.438$. (Wait for H1 close confirmation).
STOP-LOSS (SL): $4,159.686$. Placed safely above the Sideway Resistance.
TAKE-PROFIT 1 (TP1): $3,938.128 (Fibo Target).
TAKE-PROFIT 2 (TP2): $3,889.330 (Ultimate Structural Target).
3. Contingency Scenario (LONG) ⬆️
Activate LONG: Only if Gold decisively breaks $4,159.686$ (Breakout Zone) and targets $4,237.334.
Note: High-risk counter-trend trade, likely requiring a major negative surprise from the CPI report.
Community Interaction 🚀
The CPI is coming! Will the data be hot enough to smash $4,005$? Or is the Sideway Zone here to stay?
Drop your priority scenario NOW! 👇

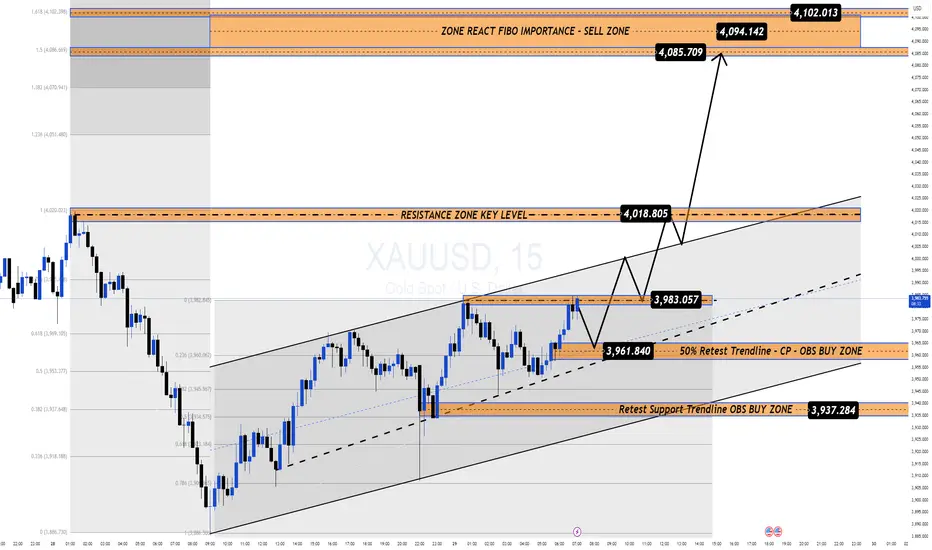
XAUUSD – Awaiting a Breakout to Confirm the Next Bullish WaveGold remains under pressure, trading slightly below 4,100 USD/oz despite ongoing geopolitical tensions and weak global sentiment.
On the higher timeframe, the structure still respects its ascending channel, showing no signs of a deep breakdown yet.
During the early Asian session, renewed buying interest has started to emerge, supported by a stable inflow of safe-haven demand.
Technically, price is attempting to form a bullish continuation structure (Dow wave) around the 4,110 zone.
If a breakout above this key level occurs, gold could accelerate toward 4,155, and potentially extend into a corrective bullish wave targeting 4,220–4,260, aligning with the Fibonacci retracement confluence and the CP/OBS sell zone on the chart.
Technical Outlook (M30):
Price action suggests a potential wave recovery structure forming after last week’s steep decline.
The 4,155 level acts as a key inflection point — it will decide whether bulls regain control or bears push for another correction.
Key Levels:
CP Zone Up / Breakout Base: 4,053 – 4,055
Short-Term Key Level: 4,110 – 4,115
Mid-Level Resistance: 4,155 (structure pivot)
Fibo Sell Zone / Wave End Target: 4,220 – 4,263
Trading Plan:
🔹BUY Setup #1
💥Entry: 4,020 – 4,018
❌Stop Loss: 4,010
✔️Take Profit: 4,030 → 4,035 → 4,040 → 4,050 → 4,060 → 4,100
⏸Bias: Reaccumulation Phase (structure support)
🔹BUY Setup #2 (Scalp Play)
🔔Entry: 4,053 – 4,051
❌Stop Loss: 4,043
✔️Take Profit: 4,060 → 4,070 → 4,080 → 4,090 → 4,100 → 4,150
⏸Note: Ideal for intraday traders watching the breakout base.
🔹SELL ZONE (Liquidity Reaction Zone)
📊Entry: 4,263 – 4,265
❌Stop Loss: 4,273
✔️Take Profit: 4,255 → 4,250 → 4,240 → 4,230 → 4,220 → 4,210 → 4,200
⭐️Summary:
Gold continues to consolidate above 4,050, showing signs of early recovery after the recent 3,000-pip correction.
The 4,155 level remains the key pivot for short-term direction — a breakout here could confirm a Wave 3–5 recovery structure, while rejection could bring one more pullback.
Macro and geopolitical uncertainty still favour safe-haven flows, keeping the bullish scenario valid as long as 4,000–4,020 holds.
📊What’s your take — will gold break above 4,155 to start a new bullish wave, or reject and extend the correction further?
