GOLD PULLBACK: $4330 SLIDE! Sniping the Fibo BUY Zone🎯 Macro Summary & Bias: USD Stability Triggers Profit-Taking
Gold is extending its corrective slide from the all-time high zone, hitting around $4,331 - $4,330.
Primary Headwind: The US Dollar (USD) attracted buyers for three consecutive days, causing stability which triggered profit-taking in the overbought Gold market.
Long-Term Support: DXY trades slightly negatively due to the US government shutdown and trade tensions, keeping the long-term bullish outlook intact.
Technical Bias: The market is in a deep correction/profit-taking phase. Our focus is strictly on finding the FIBO BUY REACT ZONES to join the underlying bullish trend. DO NOT CHASE THE SELL MOVE.
📊 In-Depth Technical Analysis (H1): Pinpointing the FIBO Reaction Levels
Based on the current corrective structure and the Fibo/Volume zones defined on image_ddd575.png, we have our strategic levels:
1. Strategic SELL Zones (FIBO SELL REACT ZONES):
These are current resistance areas for short-term rejection or supply zone testing:
REACTION FIBO SELL ZONE 4340 - 4320: Current resistance. Look for a SCALP SELL opportunity if the price rejects this zone.
REACTION SELL ZONE - Big Volume for Sell Side 435x: Major supply/liquidity zone if price attempts a deeper retracement.
2. Strategic BUY Zones (FIBO BUY REACT ZONE):
These are the most critical Fibo support zones for initiating Long entries:
REACTION FIBO BUY ZONE 4270 - 4265: The first crucial Fibo Retracement support.
REACTION BUY ZONE - Big Volume For Buy Side 4230 - 4220: The high-volume demand zone and optimal entry point for the major Long trade.
📈 TODAY'S ACTION PLAN
Primary Action (Prioritize BUY): Wait for the price to correct to the REACTION FIBO BUY ZONE 4270 - 4265 or 4230 - 4220.
Long Entry: Execute the BUY entry only upon confirmed reversal candles (H1/M30/M15).
Scalp SELL Action: If the price strongly rejects the 4340 - 4320 zone, a quick SCALP SELL targeting the nearest BUY ZONE can be considered.
Targets (TP): Aim for the highs and the 435x Sell Zone for the Longs.
⚠️ Risk Warning
Risk Management: Always place a safe Stop Loss (SL) below the nearest active BUY ZONE. DO NOT OVERLEVERAGE in this corrective phase.
Wishing all FranCi$$_FiboMatrix traders a disciplined and victorious day!
Goldtrading

GOLD Accumulates Above $4200 Which Fibo React Zone Fires First ?🎯 Macro Summary & Bias: The Calm Before the Geopolitical Storm
Gold is trading above the psychological $4,200 mark but struggled to gain meaningful traction on Monday due to mixed forces.
Driving Forces: Increased geopolitical tensions and trade uncertainty act as tailwinds for the safe-haven asset.
USD Weakness: Expectations for more Fed rate cuts and the US government shutdown weaken the USD, providing support for XAU/USD. Traders have fully priced in two more rate cuts this year, which continues to pressure the US Dollar.
Technical Outlook: Gold is currently consolidating above $4,200, signaling that the bullish structure remains intact. We are now watching for confirmation at key Fibo levels before the next breakout.
📊 In-Depth Technical Analysis (H1): Pinpointing the FIBO Reaction Levels
Our core strategy is to BUY ON DIPS at the identified Fibo Reaction Zones and look for short-term Sells only as resistance tests (Referencing image_58f686.png).
1. Strategic BUY Zones (FIBO BUY REACT ZONE):
These are the crucial support zones for initiating Long entries:
Reaction Fibo Buy Zone 4230 - 422x. This is the immediate, primary support zone where we anticipate the first bounce.
Big Volume For The BUY Side 4205 - 4200. This is the major demand zone and the ultimate pullback point to catch the large growth wave.
2. Strategic SELL Zones (FIBO SELL REACT ZONES):
These are high-volume resistance areas for potential Take Profit (TP) or short-term Scalp Sells:
Reaction Fibo Sell Zone 4280 - 4285. The first key resistance level where the price may encounter selling pressure.
Reaction Fibo Sell Zone 4315 - 4320. The next significant resistance and TP level.
Big Volume For The Sell Side 4356 - 4360. The major supply and long-term TP target.
📈 TODAY'S ACTION PLAN
Primary Action (Prioritize CHỜ ĐỢI BUY): The market is consolidating. Do NOT FOMO. Patiently wait for the price to correct to the Reaction Fibo Buy Zone 4230 - 422x.
Long Entry: Upon confirmation (H1/M30/M15 reversal candles) at the BUY Zones, confidently activate the Long (BUY) entry.
Targets (TP): Aim for the successive SELL Zones: 428x, 431x, and the ultimate target at 4356 - 4360.
⚠️ Risk Warning
Risk Management: Always place a safe Stop Loss (SL) below the nearest active BUY ZONE. Monitor trade talks closely as they could trigger sharp volatility.
Wishing all FranCi$$_FiboMatrix traders a disciplined and victorious week!

Gold Price Outlook | Buyers Stay in Full ControlGold remains firmly positioned within its broader bullish trajectory, supported by consistent demand from both institutional and retail investors. The market has shown strong resilience, forming a well-defined higher-low structure, which reflects continued accumulation. Price action indicates that buyers are confidently stepping in after each controlled pullback, maintaining upward momentum.
The current market tone favors continuation toward the 4,180–4,250 range if momentum persists. Short-term retracements into the 4,070–4,090 area may offer new buying opportunities for position traders aligning with the prevailing trend. Macroeconomic factors such as ongoing inflation concerns, geopolitical instability, and cautious monetary policy stance continue to underpin gold’s strength.
Fibo BUY Zone Mandatory for Trend Continuation.🎯 Macro Summary & Bias: The Bulls Are Unstoppable!
Gold is the most sought-after asset as XAU/USD aims directly for the $4,300 mark and further.
Primary Catalyst: Financial markets remain cautious amidst the ongoing US government shutdown.
Driving Force: Widespread USD weakness—fueled by the funding battle in the US government—strengthens the bullish case for Gold.
Record Strength: XAU/USD is maintaining positive upward momentum despite extreme overbought conditions.
Technical Focus: In this continuous Bull market, FIBO is the paramount tool for identifying the critical pullback points to initiate BUY entries.
📊 In-Depth Technical Analysis (H1): Pinpointing the FIBO Reaction Levels
Our core strategy remains BUY ON DIPS at the most precise Fibo levels, leveraging the strong Parabolic structure.
1. Strategic BUY Zone (FIBO BUY REACT ZONE):
This is the most crucial Fibo support zone where we anticipate a high-probability pullback:
4,321.332 The REACTION FIBO BUY ZONE 0.5.
This is the most vital retracement point to catch the next growth wave.
2. Sell/Take-Profit Targets (FIBO SELL TARGETS):
These are the Fibo extension targets where the Longs are aiming:
TP Target 1 (Extension) 4,436.179 The REACTION FIBO SELL ZONE 1.5 - 1.618. The next immediate target for the rally.
TP Target 2 (Deep Extension) 4,538.394 The REACTION FIBO SELL ZONE 2.5 - 2.618. The long-term target if momentum remains unchecked.
📈 TODAY'S ACTION PLAN
Primary Action (Prioritize BUY): Patiently wait for the price to correct to the REACTION FIBO BUY ZONE 0.5 at 4,321.332.
Upon confirmation (H1/M30/M15 reversal candles), confidently activate the Long (BUY) entry.
Targets (TP): Aim for TP Target 1 (4,436.179) and further to TP Target 2 (4,538.394).
⚠️ Risk Warning
Risk Warning: Given the extreme overbought conditions, always place a safe Stop Loss (SL) below the Fibo BUY ZONE and maintain stringent risk management!
Wishing all FranCi$$_FiboMatrix traders a disciplined and victorious day!

Gold Plan | Where will gold drop today?🔍 Market Context
Gold continues to maintain a short-term upward trend following a series of Break of Structure (BoS) , confirming active buying from lower zones.
Currently, the price is approaching the ATH GOLD zone and heading towards the Liquidity Sell Zone 4,281 USD – a densely liquid area where short-term sell reactions from major players may occur.
After a hot rise, technical correction risks are starting to increase. Lower zones like 4,186 – 4,152 – 4,130 USD will be potential “accumulation zones” for institutional buyers in the upcoming pullback.
💎 Technical Analysis
ATH GOLD: 4,275 – 4,280 USD
Liquidity Sell Zone: 4,281 – 4,285 USD → high liquidity resistance area, may trigger short-term reversal reactions.
Liquidity Zone $$$: 4,186 – 4,152 USD → crucial support area in the uptrend, where technical reactions are expected.
FVG – BoS Zone: 4,152 – 4,148 USD → “price balance” zone yet to be filled, likely to be retested.
OB Deep Zone: 4,130 – 4,120 USD → deep demand zone converging with Fibo 0.786 – ideal area for large capital to re-accumulate.
Overall structure remains bullish , but in the premium zone – an area where institutions typically distribute orders to gain liquidity before adjusting.
📈 Trading Scenarios
1️⃣ Main Scenario – Sell reaction at Liquidity Zone 4,281 USD
When the price hits the 4,275 – 4,281 USD zone and clear reversal signals appear (rejection candles, bearish engulfing, or minor structure break),
→ open short-term sell orders (scalp/intraday).
Target: 4,186 → 4,152 USD.
Stop Loss: above 4,285 USD.
➡️ This is a typical “liquidity sweep – technical reaction” scenario, capitalising on short-term sell-offs at high liquidity peaks.
2️⃣ Secondary Scenario – Buy back following the main trend after correction
When the price corrects to the 4,186 – 4,152 USD zone or deeper to OB Deep 4,130 USD ,
and clear upward confirmation signals appear (strong rejection or minor BoS increasing again),
→ open buy orders in line with the main trend.
Target: 4,230 → 4,275 USD.
Stop Loss: below 4,120 USD.
➡️ Trend-following scenario – waiting for price correction to discount zones to accumulate in line with the larger trend.
⚠️ Risk Management
Do not FOMO buy when the price is hitting the 4,275 – 4,281 USD zone.
Prioritise short-term sells with clear confirmations or buys at lower OB zones.
Keep light volume when trading against the main trend.
Observe reactions at the 4,186 zone – this is the key level of the day.
💬 Conclusion
Gold is at the peak of the current rise , short-term profit-taking pressure may appear around the 4,281 USD zone.
If strong reactions occur, a correction to the 4,186 – 4,152 USD zone is reasonable for market rebalancing.
The larger trend remains upward , so lower OB zones will be reasonable buy opportunities for the next wave.
👉 Reasonable Strategy:
Sell reaction at 4,281 USD when reversal signals appear.
Buy back at 4,186 – 4,152 – 4,130 USD when confirmation signals appear.

GOLD: 419x FIBO! READY FOR 426x TARGET.Gold is surging near $4,210, backed by Fed rate cut expectations and ongoing trade tensions. The long-term structure is rock-solid Bullish. Our plan is simple: WAIT and BUY the intelligent pullback!
🎯 THE BUY REACT ZONES (H1)
We are prioritizing Longs and patiently waiting for the price to hit the exact FIBO RETRACE levels.
1. PRIME BUY ENTRY (The Sweet Spot):
Zone: 4194 - 4190 (Our key Fibo Retrace Buy Zone).
Action: Look for the price to correct here. Execute a BUY (Long) upon confirmed H1/M30 candle reversal signals.
2. DEEPER STRATEGIC BUY:
Zone: 4,145.676 (Our major Order BUY zone).
Zone 2: 4124 - 4120 (Fibo Extension Buy Zone).
Action: If the first zone fails, be ready to load up at these deeper accumulation points.
3. TAKE PROFIT TARGET:
Target: 4264 - 4268 (The Fibo Extension Sell Zone).
AD Note: Sells are only for quick scalps; we wait for the major Fibo reaction at 426x.
⚠️ Immediate Focus: WAIT for the 419x retest. Discipline is key to catching this trend continuation!

XAU/USD – Buyers Reclaim Structure, Targeting Liquidity Zone🔍 Market Context
After a strong Liquidity Sweep yesterday, gold has rebounded and formed consecutive Break of Structure (BoS) , confirming buyers have regained control.
The price has now filled the Fair Value Gap (FVG 4,191 – 4,202) and is heading towards the Sell Liquidity Zone 4,237 – 4,240 USD — a concentration of pending sell orders and stop-losses from previous short positions.
The current structure shows strong bullish momentum , however, the possibility of a correction from this high liquidity area is noteworthy.
💎 Technical Analysis
Liquidity Sweep: Completed, clearing liquidity below 4,070.
FVG (Fair Value Gap): 4,191 – 4,202 → filled, confirming price balance.
Sell Liquidity Zone: 4,237 – 4,240 → potential resistance zone, likely strong reaction.
OB Zone | Buy: 4,143 – 4,145 → nearby support, expected first reaction when price corrects.
OB Deep | Buy: 4,110 – 4,115 → deep demand zone, confluence with Premium Zone 4,156 – 4,118.
Overall Structure: The main trend remains bullish , with strong upward momentum but requires a technical correction for re-accumulation.
📈 Trading Scenarios
1️⃣ Main Scenario – Sell reaction at liquidity zone
When the price approaches the Sell Liquidity Zone 4,237 – 4,240 USD , observe candlestick reaction (rejection, bearish engulfing).
If confirmation signals appear, open a short-term sell order .
Target: OB Buy Zone 4,145 → 4,110 USD.
Stop Loss: above 4,245 USD.
➡️ This is a liquidity reaction setup, high probability when the market encounters resistance confluence with Fibonacci zone 0.786–1.0.
2️⃣ Alternative Scenario – Buy with trend from OB
If the price corrects to the OB Zone 4,143 – 4,145 USD and shows a clear reaction (strong rejection or minor structure break),
→ a buy with the main trend can be opened.
Target: return to 4,200 → 4,235 USD.
Stop Loss: below 4,130 USD.
If the price drops further, the OB Deep Buy 4,110 – 4,115 USD will be the final “liquidity attraction” zone for a new upward bounce.
⚠️ Risk Management
Avoid FOMO buying at 4,200+ as it is near the liquidity resistance zone.
Prioritise short-term sell at 4,237 if clear signals are present.
When price corrects to OB, wait for reaction before buying, do not bottom fish early.
💬 Conclusion
After completing the liquidity sweep, gold has confirmed a return to bullish structure with multiple consecutive BoS.
Currently, the price is approaching the liquidity zone 4,237 USD – a short-term correction is highly likely.
The 4,145 – 4,110 USD zone will be where buyers await reaction to accumulate orders and continue the medium-term uptrend.
👉 Reasonable Strategy:
Short sell at 4,237 USD if reversal signals are present.
Wait to buy at OB zone 4,145 – 4,110 USD when clear reaction occurs.

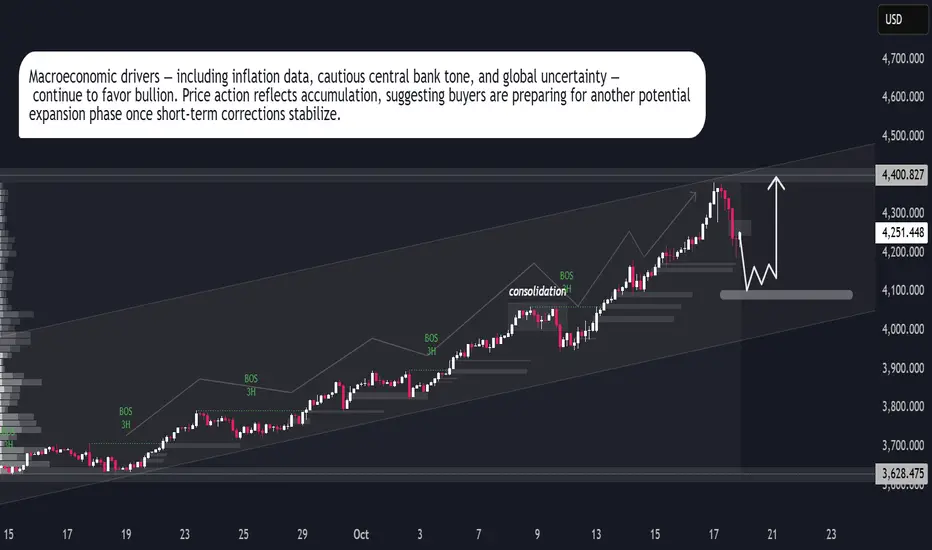
Gold → Ready for the Next Bullish WaveGold (XAUUSD) continues to gain momentum as shifting global conditions drive investors toward safer assets. The ongoing uncertainty in financial markets, coupled with renewed concerns over U.S. fiscal policy and interest rate adjustments, has strengthened gold’s long-term appeal.
Recent market behavior reflects consistent institutional demand, with traders positioning ahead of potential monetary easing cycles. As confidence in traditional currencies weakens, gold remains a preferred store of value for both investors and central banks.
Structurally, the market is maintaining a healthy uptrend, showing controlled corrections within a broader bullish framework. The latest price movements suggest that momentum is building for another upward phase, possibly targeting new historical zones if global instability persists.
In summary, gold’s outlook stays constructive — supported by both macroeconomic sentiment and steady technical momentum.
How do you see the XAUUSD trajectory evolving — continuation of growth or a major pause ahead?

GOLD CRASH ALERT: +60 PRICES DUMP! Waiting for the Ultimate Fibo React BUY Zone.
FranCi$$_FiboMatrix Emergency Action Plan
Gold just suffered a brutal 60-point plunge from 416x to 411x, triggered by mounting geopolitical tensions. The market is volatile, and deep correction is highly likely. We must trade smart, not emotionally.
🎯 EMERGENCY ACTION ZONES (H1/M30)
Avoid chasing! We only trade when price hits our calculated FIBO REACTION ZONES.
1. SCALP SELL RETRACEMENT:
Zone 1 (High): Watch the 407x area (4,077.605).
Zone 2 (Key Fibo Resistance): The 405x area (4,048.493).
Action: If price bounces back into either zone, look for strong bearish rejection to execute a SCALP SELL.
2. CRITICAL BUY REACT ZONE (The Lifeline):
Zone: We are waiting for the AD's updated FIBO REACTION zones that conform to the new deep trend.
Action: DO NOT BUY BLINDLY. Only enter a Long when the price reaches these deeper support levels and gives a strong, confirmed BUY REACT signal.
⚠️ Immediate Focus: OBSERVE & WAIT. The AD will provide continuous updates. Manage risk strictly—this volatility demands discipline!

XAU/USD – Liquidity Cleared, Gold Reloads for the Next Breakout🔍 Market Context
This morning, gold price (XAU/USD) experienced a classic liquidity sweep :
The price surpassed the previous high of 4058 , touched 4060 , wicked strongly , and short-term corrected – a textbook “liquidity hunt” by major funds.
After this drop, the price recovered back to the old ATH zone (4055 – 4060) .
This indicates that short-term sellers have weakened , and buyers are reclaiming the crucial structure zone .
Therefore, selling strategy is no longer optimal , instead, the market is preparing for a re-accumulation – next breakout.
💎 Technical Analysis
Current ATH: 4060 USD
Previous High: 4058 USD
This morning's liquidity sweep “cleared out” liquidity above, paving the way for a re-accumulation phase before the next rise.
The zone 4048 – 4052 is acting as a retest zone – if it holds, this could be the “launchpad” for a breakout to higher price zones.
Overall Structure: still bullish , no signs of medium-term reversal.
⚙️ Key Price Zones
Retest Zone: 4048 – 4052 → support zone after the sweep, where the price might bounce back.
Breakout Zone: 4065 – 4070 → zone confirming buyers regain dominance.
Extended Target: 4090 – 4100 USD.
Invalidation Zone: below 4040 USD → if breached, the short-term bullish structure will weaken.
📈 Trading Scenarios
1️⃣ Buy Continuation Scenario – Buy with the main trend
Wait for the price to retest the 4048 – 4052 zone , observe bullish candle reactions or confirmation signals (Engulfing, Rejection).
Open a buy order upon confirmation of holding the support zone.
Target: 4065 → 4090 USD.
Stop Loss: below 4040 USD.
➡️ This is a trend-following scenario, with the highest probability when the market has completed the liquidity sweep and is re-accumulating.
2️⃣ Buy Breakout Scenario – Buy on confirmed breakout
If the price breaks and closes above 4065 , it signals that major funds have returned.
Open buy stop or limit retest breakout around 4065 – 4070.
Extended Target: 4090 → 4100 USD.
Stop Loss: below 4050 USD.
➡️ This scenario suits momentum traders, avoiding the risk of “fake breakout” by waiting for clear confirmation.
⚠️ Risk Management
Do not sell against the trend at the ATH zone, as liquidity above has been taken.
Maintain reasonable volume when trading around the peak zone.
Prioritize buying when there is confirmation of the bullish structure holding the 4050 zone .
💬 Conclusion
This morning's liquidity sweep has shaken out weak hands , while helping gold pave the way for the next rise .
Currently, the price is re-accumulating around the old peak zone 4055 – 4060 , and if the zone 4048 – 4052 continues to hold, there is a high possibility that gold will break out to the 4090 – 4100 USD zone in the upcoming sessions.
👉 Reasonable Strategy:
Wait to buy at the support zone or buy when the price breaks above 4065.
Avoid selling against the trend now – the risk is very high as major funds have shifted to the accumulation phase.

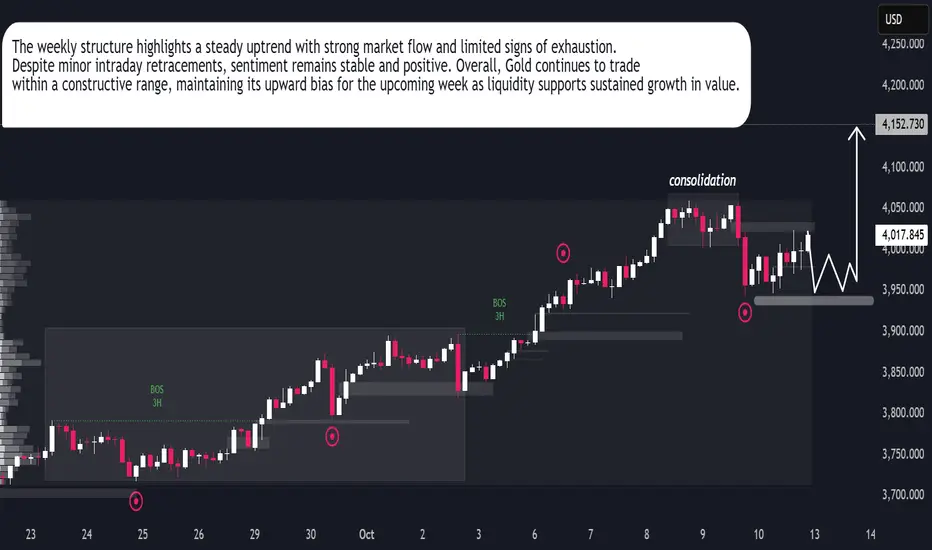
XAUUSD | Bulls Maintain Weekly ControlGold continues to display firm momentum as investor confidence remains stable despite short-term fluctuations. The latest weekly candle structure shows price holding within a steady consolidation range, signaling accumulation rather than weakness. Market behavior suggests large participants are preparing for another expansion phase after absorbing liquidity in the lower zones.
Institutional interest remains evident, with consistent buying pressure observed on dips, indicating sustained optimism for further growth. The current behavior aligns with broader market sentiment favoring safe-haven assets amid global uncertainty. Overall, Gold retains its dominance as capital flows stay supportive of the uptrend, positioning the metal for renewed strength in the upcoming sessions.
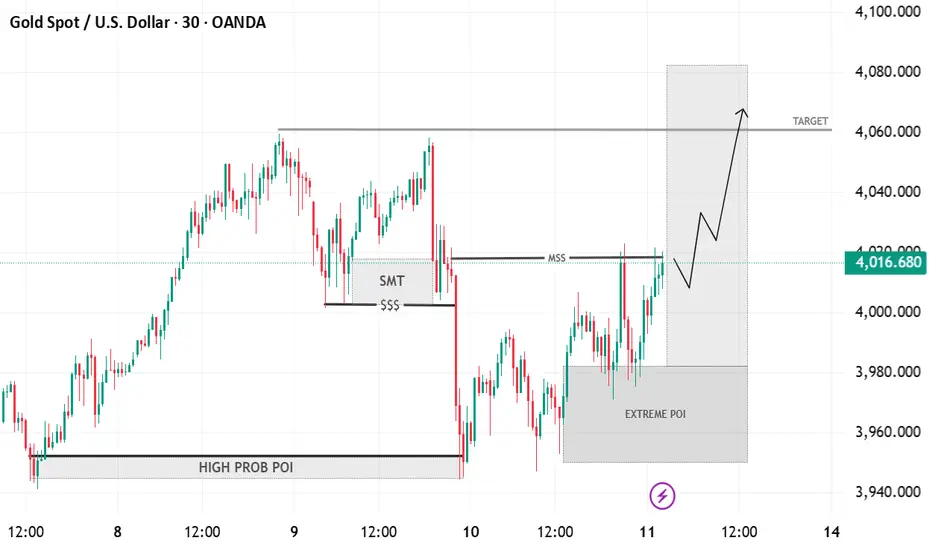
Gold–Bullish Reversal Setup from Extreme POI Toward 4060 TargetTimeframe: 30-minute chart (XAU/USD – Gold Spot vs U.S. Dollar)
Market Structure:
Price made a structural low (SMT) around the $$$ liquidity zone.
A Market Structure Shift (MSS) occurred as price broke above short-term highs.
POI (Point of Interest) Zones:
High Probability POI: Previous accumulation zone that caused a bullish impulse.
Extreme POI: Current demand zone (around 3960–3980), where price is rebounding.
Current Price Action:
Price has reacted bullishly from the Extreme POI.
The breakout above MSS signals possible continuation to the upside.
Target Zone:
The shaded grey target area (~4060–4080) aligns with previous liquidity highs.
Bias:
Bullish short-term bias toward 4060–4080 zone, assuming the demand zone holds.
Break below Extreme POI would invalidate the setup and suggest deeper retracement.
Sniping the Next BUY Zone for Maximum Gains.The sentiment is clear: Bulls are running the show, preparing for potentially an eighth consecutive weekly gain. Our strategy is simple—wait for the intelligent retest to join the momentum.
🎯 THE TARGET ZONES (M30/H1)
We're focusing on the two most crucial zones derived from Fibo React Logic:
1. PRIME BUY ENTRY (The Sweet Spot):
Zone: 4018 - 4014 (Our key Fibo Retest Zone).
Action: Wait for Gold to pull back to this area. Execute a BUY (Long) only upon confirmed M30/H1 candle rejection (e.g., Bullish Engulfing/Pin Bar).
2. TAKE PROFIT TARGET (The Next Peak):
Zone: 4094 - 4098 (Fibo Extension/SELL React Zone).
Action: This is the primary TP for our Long entries, representing the next major target for the buyers.
📈 TRADING SCENARIO
Strategy: Patience is key. Let the market retrace to 4018 - 4014. Once confirmation hits, ride the wave up to 4094 - 4098.
🚨 Risk Alert:
Be disciplined with your Stop Loss. Maintain strict risk management, especially if the price fails to hold the 4018 - 4014 zone.
Let's trade with precision today!

XAUUSD – Safe-Haven Demand Keeps Gold StrongMarket Overview:
Gold stays firm as fresh US–China trade tensions and ongoing geopolitical concerns push investors toward safe assets.
Expectations of another Fed rate cut are putting pressure on the USD, giving extra strength to gold.
Even though short-term indicators show some overbought signs, overall sentiment still favours the bulls.
Near-Term Outlook:
As long as price remains inside the rising channel, we expect a possible move toward the 4,090–4,100 liquidity zone.
A rejection from 4,092–4,095 could lead to a short-term pullback before continuation.
Important Levels:
Liquidity Buy Zone 1: 4,039 – 4,037
Liquidity Buy Zone 2: 4,017 – 4,015
Liquidity Sell Zone: 4,092 – 4,095
Support: 4,010 – 4,000
Resistance: 4,110 – 4,126
Trading Plan:
🔹 Buy Setup #1
Entry: 4,039 – 4,037
Stop Loss: 4,032
Targets: 4,044 → 4,048 → 4,052 → 4,056 → 4,060 → 4,070
🔹 Buy Setup #2
Entry: 4,017 – 4,015
Stop Loss: 4,010
Targets: 4,022 → 4,026 → 4,030 → 4,040 → 4,050 → 4,060
🔹 Sell Setup (Scalp Opportunity)
Entry: 4,092 – 4,095
Stop Loss: 4,100
Targets: 4,090 → 4,085 → 4,080 → 4,070 → 4,060
Summary:
Bias stays bullish while gold holds above 4,015 – 4,020.
Safe-haven demand and softer USD outlook continue to support the upside move.
Look out for a liquidity sweep around 4,092 before further continuation upward.
📊 What do you think — will gold break higher or reject from 4,090?
👉 Follow MMFLOW TRADING for daily market structure updates and precise trade plans.
🟣 Chart: XAUUSD H1 – Smart Money Flow structure highlighting liquidity areas and OB zones.

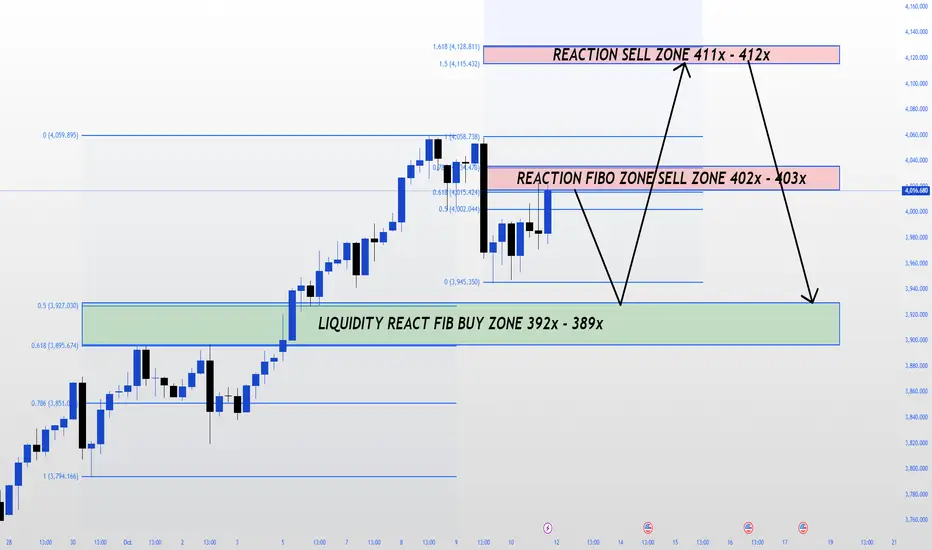
$4,000 RECLAIMED! Targeting Fibo Extremes on H4.The big picture is clear: Gold has strongly pushed past the $4,000 mark, driven by major safe-haven demand amidst US-China tensions. Buyers are pushing for an eighth straight weekly gain!
But where are the high-probability zones?
🔑 THE FRANCI$$_FIBOMATRIX PLAN (H4)
We're keying in on two critical Fibo Reaction Zones for the perfect entry:
1. SELL ZONE (Correction/Reversal Focus):
Zone 1 (FIBO): 402x - 403x (4,025.424 - 4,032.844). Action: Look for H1/H4 candle rejection here to initiate a corrective short trade.
Zone 2 (Extension): 411x - 412x (4,115.422 - 4,128.811). Action: The ultimate target if momentum holds; watch this for the major supply zone.
2. BUY ZONE (Trend Continuation):
The Sweet Spot: 392x - 389x (3,907.030 - 3,895.674). This is our key Liquidity React Fibo Buy Zone. Action: Wait for the deep pullback here, confirm with bullish signals, and join the main trend with a target back to the 402x/411x range.
🚨 Critical Risk Alert:
A decisive weekly close below $3,962 signals a high risk of deep correction towards $3,900. Manage your Longs tightly below this level!
GOLD: The Dollar Blinks! Time to 'Pay' at the 0.618 Fibo (4018) The Macro Play: USD Retreat Sets the Stage for Gold's Counter-Attack
The precious metal is catching a bid as the US Dollar softens after hitting its recent highs. The fundamental backdrop is keeping Gold buoyant:
Fed Pivot Narrative: Despite the hawkish undertones in the last FOMC meeting minutes, the market's conviction in two potential Fed rate cuts by year-end remains a powerful tailwind, making non-yielding Gold more attractive.
Geopolitical Fog: While the short-term truce news caused a minor retreat, the overarching safe-haven demand driven by global tensions and the looming US government funding crisis provides critical floor support.
Bottom Line: Gold is navigating a choppy consolidation phase. Short-term pressure exists, but the Long-Term Macro Thesis favors a cautious recovery.
📊 The MatrixFibo PTKT: SCALP Zones Are Active!
Price action shows clear reaction points within the recent sharp move lower. Our plan is to Trade the Reactions at these high-probability confluence zones.
1️⃣ The Aggressive SELL Zone (SELL SCALP Setup)
We are looking for the market to exhaust its short-term recovery rally at major resistance levels.
Primary SELL ZONE: 3997 - 4000 (0.5 Fibo Level):
This area is critical psychological resistance and the 50% retracement of the latest impulse down.
PLAN: Await a failed breakout or clear bearish rejection signal (Pinbar, Bearish Engulfing) at 3997 - 4000.
TARGET: The move should aim to clear the lows, heading straight for 3915 - 3910.
The Ultimate SELL Reversal: 4014 - 4018 (0.618 Fibo Downtrend Zone):
This is the REACTION FIBO 0.618 DOWNTREND H1 ZONE. This level is our strongest strategic SELL point if the bounce extends deeper.
2️⃣ The Key BUY Zone (BUY SCALP Setup)
We treat this area as the final line of defense for the current uptrend structure.
Key Support & BUY SCALP REACT ZONE: 3915 - 3910:
This zone is a Major Confluence point: Key Support, the 0.786 Fibo, and the Uptrend Channel Bottom.
PLAN: Look for strong buying pressure to emerge as price tests 3915 - 3910. Requires a solid Bullish Price Action Confirmation.
TARGET: A successful bounce targets the liquidity back at 3997 - 4000.
🛑 FranCis MatrixFibo Risk Policy
Volatility Alert: Expect large swings around US data and Fed commentary. NEVER TRADE WITHOUT A HARD STOP LOSS (SL) on SCALPS.
Strategy Focus: The market is range-bound. Stick to a Two-Sided Scalping Plan defined by the identified price levels.
Discipline: Only enter trades at or with clear confirmation from the React Zones.

GOLD (XAUUSD) 1H CHART ANALYSIS – BEARISH SETUP AHEADGOLD (XAUUSD) 1H CHART ANALYSIS – BEARISH SETUP AHEAD
🔍 Technical Overview
Current Price: Around $4,036 – $4,040
Trendline: A key uptrend line (blue) has been broken, signaling weakening bullish momentum.
Resistance Zone: Between $4,058 – $4,062, marked by red arrows 🚫
Support Zone: Near $3,930 – $3,940, highlighted by the purple box 🟪
📊 Market Structure
The market recently made a lower high formation after failing to break above $4,062, indicating bearish divergence.
Multiple rejection candles at the resistance zone confirm selling pressure 💣.
The blue projection lines suggest a potential bearish retracement back toward the support zone around $3,930.
🧭 Key Levels
Type Price Level Notes
🔺 Resistance 4,058 – 4,062 Double top zone, strong sellers present
⚖️ Mid-Level 4,000 Psychological round number, interim support
🟣 Support 3,930 – 3,940 Major buying interest, possible reversal zone
📉 Expected Price Action
🔻 Scenario 1 (Primary):
Price may retest $4,050 – $4,060 resistance area, form another rejection, and drop toward $3,940 support.
Potential short entry near $4,050 – $4,060
Target $3,940
Stop loss above $4,070
🔄 Scenario 2 (Alternative):
If the price holds above $4,060, a breakout could trigger a bullish continuation toward $4,100+.
🧠 Trader’s Insight
⚠️ Bearish bias remains valid while below $4,060.
🕒 Watch for price reaction around the trendline retest and confirmation candles (bearish engulfing or pin bars).
📈 Smart traders might wait for confirmation below $4,000 before adding short positions.
💬 Summary
➡️ Bias: Bearish below $4,060
➡️ Target: $3,940
➡️ Invalidation: Break and close above $4,070
📍 “Trendlines break fast, but support zones hold stronger — trade smart, not fast.”

GOLD UPDATE – Bulls Defend $4,000 Ahead of Powell’s SpeechGold continues to hold firm above the key $4,000 psychological level, even after a sharp correction from the all-time high near $4,059. The market’s focus now shifts to Fed Chair Jerome Powell’s speech, which could set the tone for the next directional move.
Despite the recent dip, the overall structure remains bullish, and the FiboMatrix setup still signals that buyers are not out of the game yet.
Technical Structure (H1 – FiboMatrix View)
Support Zone (BUY Setup):
4010 – 4012 → Retest of breakout trendline + Fibo 0.618 reaction zone.
Strong intraday base where liquidity may reload for another bullish leg.
Reaction Buy Zone:
402x → Potential confirmation area if price reacts positively.
Resistance Zone (ATH):
4060 → Previous intraday top, acting as the first major barrier before retesting 408x.
SELL Reaction Zone:
4084 – 4086 → Fibo 1.5 – 1.618 expansion zone, potential scalp short zone with tight stop above 4090.
🎯 Trading Plan (Francis Strategy)
✅ BUY Setup:
Entry: 4010 – 402x (wait for confirmation).
TP1: 4060
TP2: 4084
SL: Below 3996
⚠️ SELL Setup (Short-term scalp):
Entry: 4084 – 4086 (if rejection forms).
Target: 4040 → 4020
SL: Above 4096
🔑 Francis Outlook
Gold’s short-term correction looks more like a controlled retracement than a trend reversal.
As long as the price holds above the $4,000 handle, the bullish bias stays intact.
👉 Expect potential consolidation before Powell’s remarks, followed by a sharp reaction depending on the tone of his speech.
A clean breakout above 4060 – 4086 will open the path toward $4,100+ and new ATH targets.
🚀 Trend Bias: Bullish above 4010 – Buy the Dip, Sell only at Fibo extremes with confirmation.

Trading Gold and Cryptocurrency in the Indian Market1. Overview of Gold Trading in India
Gold has deep cultural and economic significance in India. It is widely used in jewelry, savings, and investment, making India one of the largest consumers of gold globally.
1.1 Forms of Gold Investment
In India, gold trading occurs in several forms:
Physical Gold – Jewelry, coins, and bars.
Gold ETFs (Exchange-Traded Funds) – Allow investors to buy units representing gold without physically holding it.
Sovereign Gold Bonds (SGBs) – Issued by the Reserve Bank of India (RBI), providing interest along with appreciation in gold price.
Futures and Options – Traded on the Multi Commodity Exchange (MCX), providing leveraged exposure.
1.2 Gold Trading Mechanics
Gold trading in India, especially in the futures market, involves contracts with standard weights (1 kg, 100 grams, etc.). Prices fluctuate based on domestic demand, international gold prices, USD/INR exchange rates, and geopolitical tensions. Traders can go long (buy) or short (sell), using leverage to maximize returns, though this increases risk.
1.3 Strategies in Gold Trading
Trend Trading: Identifying upward or downward trends in international or domestic gold prices and trading accordingly.
Hedging: Using gold futures to protect portfolios from inflation or currency depreciation.
Arbitrage: Exploiting price differences between spot markets, ETFs, and futures.
1.4 Risks and Considerations
Gold is influenced by global market volatility.
Leverage can magnify losses.
Liquidity in physical gold is higher, but online platforms provide faster execution.
2. Overview of Cryptocurrency Trading in India
Cryptocurrency trading in India is still evolving. Cryptos are digital or virtual currencies that operate on blockchain technology. The most popular are Bitcoin (BTC), Ethereum (ETH), Ripple (XRP), and several altcoins.
2.1 Cryptocurrency Market in India
India has seen explosive growth in cryptocurrency adoption over the last few years. Exchanges like WazirX, CoinDCX, and ZebPay provide platforms for trading Bitcoin and other digital assets. Trading can occur in:
Spot Market: Buying and selling cryptocurrencies at current market prices.
Futures Market: Contracts allowing traders to speculate on future prices.
Margin Trading: Trading using borrowed funds to amplify gains (and risks).
2.2 Regulatory Landscape
Cryptocurrency regulations in India remain in flux:
RBI Restrictions: Previously, banks were restricted from providing services to crypto exchanges, but this has eased after Supreme Court intervention.
Taxation: Cryptocurrency gains are taxed at 30%, with a 1% TDS on transactions above a certain threshold.
Legal Status: Cryptos are legal to trade but not recognized as legal tender.
2.3 Strategies for Crypto Trading
Day Trading: Taking advantage of intraday volatility to make profits.
Swing Trading: Capitalizing on medium-term trends lasting days or weeks.
HODLing: Long-term holding based on belief in price appreciation.
Arbitrage: Exploiting price differences across exchanges.
2.4 Risks and Considerations
Cryptocurrencies are highly volatile; prices can swing 10-20% within hours.
Exchanges may face liquidity or security issues.
Regulatory changes can significantly impact prices.
3. Trading Platforms in India
3.1 Gold Trading Platforms
MCX (Multi Commodity Exchange): Futures and options.
Stock Broker Platforms: Zerodha, Upstox, ICICI Direct provide access to ETFs and SGBs.
Banks and Post Offices: For Sovereign Gold Bonds and physical gold.
3.2 Crypto Trading Platforms
WazirX: Popular for beginners with simple UI.
CoinDCX: Offers derivatives trading and margin facilities.
ZebPay: Secure platform with various coins available.
International Platforms: Binance and Kraken for Indian residents (with caution on regulations).
4. Technical and Fundamental Analysis
4.1 Gold
Technical Analysis: Uses price charts, trendlines, moving averages, and RSI to predict price movements.
Fundamental Analysis: Considers inflation rates, global demand, central bank policies, and geopolitical events.
4.2 Cryptocurrency
Technical Analysis: Chart patterns, candlestick formations, MACD, Bollinger Bands, and volume analysis.
Fundamental Analysis: Blockchain adoption, regulatory news, network updates, and market sentiment.
5. Risk Management
5.1 Gold
Diversify between physical gold, ETFs, and futures.
Limit leverage to avoid margin calls.
Monitor global gold prices and USD/INR movements.
5.2 Cryptocurrency
Trade only with capital you can afford to lose.
Use stop-loss orders to minimize losses.
Keep funds in secure wallets rather than exchanges for long-term holding.
Diversify across coins to spread risk.
6. Future Outlook
6.1 Gold
Gold will remain a core part of Indian investment due to cultural affinity and inflation hedging.
Global uncertainties, such as currency devaluation or geopolitical tensions, can drive prices higher.
6.2 Cryptocurrency
Adoption is expected to rise as digital literacy grows.
Regulations will play a pivotal role in shaping market stability.
Potential for blockchain-based applications beyond trading, including NFTs, DeFi, and metaverse assets.
Conclusion
Trading gold and cryptocurrencies in India offers unique opportunities for portfolio diversification. Gold provides stability and hedging against inflation, while cryptocurrencies offer potential high returns at higher risk. Success in both markets requires understanding the instruments, staying updated with global and domestic trends, employing technical and fundamental analysis, and practicing disciplined risk management.
Indian traders now have access to sophisticated platforms and instruments that enable both short-term speculation and long-term investment. Combining gold and cryptocurrencies strategically can help investors achieve a balance of security, growth, and speculative gains, ensuring a resilient and profitable portfolio in a rapidly evolving financial landscape.

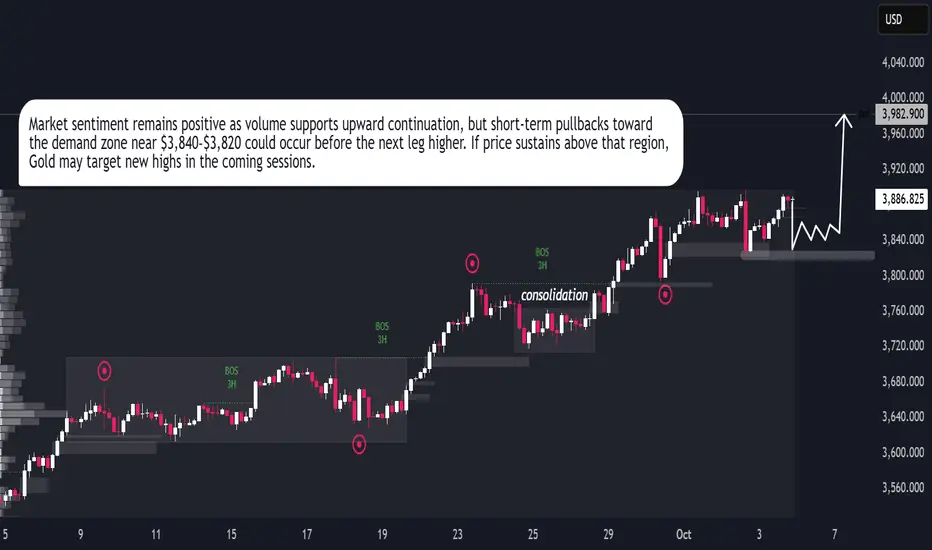
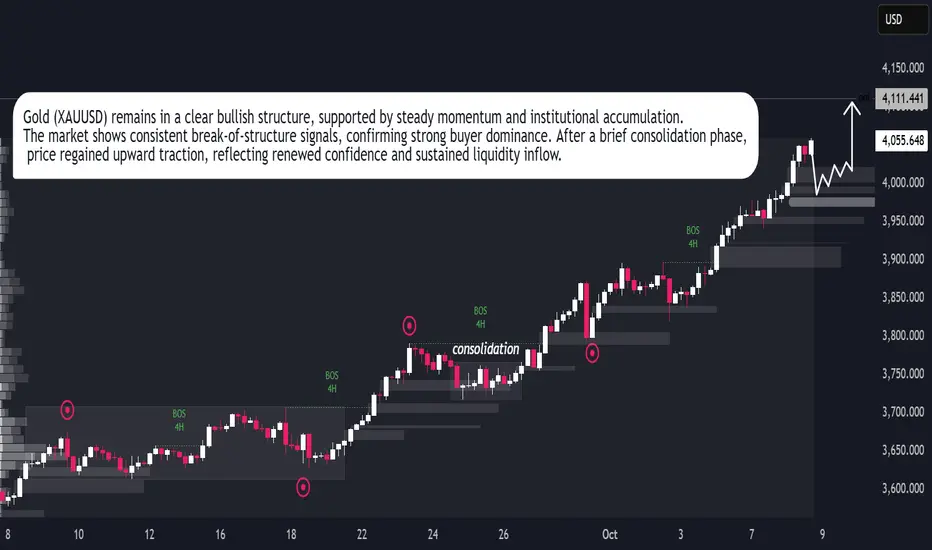
Gold Price Rally Sustains – Market Eyes Next Breakout PointGold (XAUUSD) continues to follow a strong bullish trajectory, confirming consistent market confidence and institutional participation. The chart structure reveals clear liquidity shifts and a steady series of bullish break-of-structure (BOS) points, suggesting that buyers remain in firm control. After a brief consolidation phase, gold resumed upward momentum, supported by sustained volume and steady market sentiment.
The current trend indicates controlled buying pressure rather than speculative spikes, showing the market’s preference for stability as price builds toward higher levels. If momentum maintains its present pace, gold could extend gains in the short term while maintaining its established bullish rhythm across the higher timeframe outlook.
GOLD M30 – Bulls Defend $4,000, Eyes on 4,100+Gold’s historic surge above the $4,000 psychological barrier is now consolidating, with buyers defending the 3996$ support (Fibo 0.618 reaction). The structure remains bullish, while intraday traders are eyeing the next reaction zones for both continuation and scalp opportunities.
📊 Technical Levels to Watch (Fibo Matrix – M30)
3996$ Support Zone: Breakout retest + Fibo 0.618 → must-hold for bulls.
4018 – 4020: First intraday resistance, potential short-term reaction.
4043$: Expansion-based psychological barrier.
406x – 407x: Key SELL Reaction Zone (Fibo 1.5 – 1.618) → scalp rejection likely.
4095$+: Upper liquidity expansion, next major target if momentum extends.
🎯 Francis Trade Plan
✅ BUY Setup:
Entry: 3996 – 4000 zone.
Targets: 4018 → 4043 → 406x.
SL: Below 3984.
⚠️ SELL Setup (Short-term scalp only):
Entry: 406x – 407x reaction.
Targets: 4020 → 4000.
SL: Above 4096.
🔑 Francis View
The breakout at $4,000 signals strength, and bulls still dominate.
👉 Dips into 3996 support remain attractive BUY opportunities.
👉 Short-term scalpers can prepare for reaction SELLs around 406x – 407x.
📌 Bias: Bullish above $3996 – 4,100 zone remains the next liquidity magnet.

Sustainable Price Rise: Where’s the Next Optimal Entry?Hello TradingView community! 🚀
Gold (XAU/USD) is in an extremely sustainable upward structure. Instead of lengthy analysis, let's dive straight into the action plan: What is the optimal entry point and what target is Gold aiming for? Check out the details below.
1. Market Structure Analysis: The Strength of the Bulls 🐂
Looking at the chart, the first thing that catches our eye is a series of "BoS" (Break of Structure).
Every time Gold breaks an old peak, it not only creates a Higher High but also confirms that the upward trend is very strong and sustainable. This indicates that buying power is completely overwhelming and shows no sign of weakening. Smart Money is continuously pushing the price higher, and our job is to ride this "wave."
2. Potential Buying Zones - Where to Catch the Wave? 🧐
To optimize profits and minimize risks, finding a beautiful entry point after a price correction is extremely important. Based on the chart, we have 2 noteworthy potential buying zones:
Buying Zone 1 - Fibonacci Confluence ($3885): This is an extremely ideal "Buy Zone," coinciding with the golden Fibonacci ratio of 0.618. In technical analysis, this is a very strong support level, where prices often tend to reverse and continue the main trend. Professional traders always hunt for pullbacks to this zone.
Buying Zone 2 - Exploiting FVG ($3914 - $3933): Slightly higher, we have the FVG (Fair Value Gap) area at $3914 and the "Buy Scalping" zone at $3933. These are "price gaps" created by supply-demand imbalances when prices rise too quickly. The market tends to return to fill these gaps before continuing its journey. This could be an opportunity for those wanting to catch an earlier wave.
3. Target Conquest - What’s Gold’s Next Destination? 🎯
Once we have a buying position, where will our target be?
Short-term target: The "Sell Scalping FVG" zone around $3969 could be a minor resistance point where some traders will take profits.
Main target: The ultimate destination this structure is aiming for is the "Sell Gold Liquidity" zone at $3998. This is an important "liquidity" area, concentrating many stop-loss orders of the Sellers. Prices are often attracted to these zones like a "magnet" to sweep liquidity before making further moves.
Summary & Advice
Main trend: UP.
Primary strategy: Buy on dip when prices correct to important support zones.
Potential buying zones: $3885 (Fibonacci) and $3914 - $3933 (FVG).
Price targets: $3969 (short-term) and $3998 (main target).
Always remember, risk management is the key to surviving in the market. Set reasonable Stop-loss for all your trades.
WHAT DO YOU THINK ABOUT THIS PLAN?
Will Gold retrace to the Fibonacci zone $3885 or react right at the FVG zone $3914? Leave your opinions and perspectives in the comments below. We will discuss together to find the best opportunities!
👇 Don't forget to Like 👍 and Follow my TradingView channel to not miss daily Gold analyses!

GOLD → Structural Rebalance Before Next Bullish LegGOLD → Structural Rebalance Before Next Bullish Leg
Gold remains in a strong bullish structure, showing consistent higher highs and steady momentum after each correction. The market has been consolidating above the $3,800 zone, where buyers continue to absorb liquidity and prevent deeper declines. This zone acts as a solid base for potential upward expansion. Current market behavior indicates controlled accumulation, suggesting that institutional buyers are maintaining dominance. If gold holds above $3,840–$3,820, the next bullish leg may target the $3,960–$4,000 region. A short-term retracement could occur, but overall momentum favors continuation. The price structure and volume behavior both support further upside, reflecting strong buyer control and stable sentiment in the market.