LiamTrading – XAUUSD H1 | Gold breaks bullish structure...LiamTrading – XAUUSD H1 | Gold breaks bullish structure, short-term downside takes control
Gold has dropped sharply by more than $20 in a short time, losing over 1% on the day and moving close to the lower 4,030 area. The previous bullish structure has officially been broken, 4040 failed to hold, and today’s focus continues to be selling with the trend until the 4000–398x support zone shows clear reactions.
Macro Analysis
Gold prices declined as expectations for a December rate cut weakened: JPMorgan no longer forecasts a Fed rate cut in December, opposite to their earlier 25 bps cut scenario.
Some institutions still believe rising unemployment and weaker economic data may force the Fed to cut 25 bps at the upcoming meeting.
The market is currently pricing the probability of a December rate cut at nearly “50–50,” creating strong uncertainty and putting short-term pressure on gold, even though the metal still benefits in the long term if the rate-cut cycle begins.
Technical Analysis H1 – Bearish structure, price channel, and support zones
After breaking below 4040, price formed a series of Lower Highs – Lower Lows, confirming a Dow-theory bearish structure on H1.
A falling channel is forming; the channel’s upper boundary aligns with the short-term resistance zone at 4050–4060.
4000 zone: a key psychological support. If broken decisively, the medium-term structure may shift into a deeper corrective phase.
Buy Zone 3987–3989
Strong support confluence + Fibonacci extensions (1.618/2.272) of the current bearish swing
Optimal area for catching a corrective bounce if clear reversal signals appear
Key Resistance Levels Today
4052–4054: retest of former support + upper boundary of falling channel → ideal area for a pullback-sell setup.
Trading Scenarios Today (LiamTrading)
Scenario 1 – SELL with the prevailing downtrend (priority)
Entry: 4052–4054
SL: 4060
TP: 4030 → 4015 → 3990
Logic: Price retraces to resistance + channel top, suitable for trend-continuation selling. Prefer setups where M15 shows rejection candles (pin bar/bearish engulfing) around 405x.
Scenario 2 – BUY at strong support 398x (counter-trend bounce)
Entry: 3987–3989
SL: 3980
TP: 3999 → 4014 → 4040 → 4080
Logic: 398x is a high-confluence support zone; trigger only when clear price reaction appears (long lower wicks or reversal patterns on M15–H1).
This is counter-trend, so use smaller position sizes and take partial profits.
Risk Notes & Invalidation
H1 closes above 4060: short-term bearish structure weakens → pause all sell setups and reassess.
H1 closes below 3980: buy zone fails → downside could extend further; only sell setups preferred.
Always keep risk per trade at 0.5–1%, and once reaching +1R, move SL to break-even.
Are you leaning towards continuing to sell with the trend, or waiting to buy the dip at 398x?
Follow LiamTrading on TradingView for daily XAUUSD updates
Goldtradingview

LiamTrading – XAUUSD H1 | Gold breaks bullish structure...LiamTrading – XAUUSD H1 | Gold breaks bullish structure, short-term downside takes control
Gold has dropped sharply by more than $20 in a short time, losing over 1% on the day and moving close to the lower 4,030 area. The previous bullish structure has officially been broken, 4040 failed to hold, and today’s focus continues to be selling with the trend until the 4000–398x support zone shows clear reactions.
Macro Analysis
Gold prices declined as expectations for a December rate cut weakened: JPMorgan no longer forecasts a Fed rate cut in December, opposite to their earlier 25 bps cut scenario.
Some institutions still believe rising unemployment and weaker economic data may force the Fed to cut 25 bps at the upcoming meeting.
The market is currently pricing the probability of a December rate cut at nearly “50–50,” creating strong uncertainty and putting short-term pressure on gold, even though the metal still benefits in the long term if the rate-cut cycle begins.
Technical Analysis H1 – Bearish structure, price channel, and support zones
After breaking below 4040, price formed a series of Lower Highs – Lower Lows, confirming a Dow-theory bearish structure on H1.
A falling channel is forming; the channel’s upper boundary aligns with the short-term resistance zone at 4050–4060.
4000 zone: a key psychological support. If broken decisively, the medium-term structure may shift into a deeper corrective phase.
Buy Zone 3987–3989
Strong support confluence + Fibonacci extensions (1.618/2.272) of the current bearish swing
Optimal area for catching a corrective bounce if clear reversal signals appear
Key Resistance Levels Today
4052–4054: retest of former support + upper boundary of falling channel → ideal area for a pullback-sell setup.
Trading Scenarios Today (LiamTrading)
Scenario 1 – SELL with the prevailing downtrend (priority)
Entry: 4052–4054
SL: 4060
TP: 4030 → 4015 → 3990
Logic: Price retraces to resistance + channel top, suitable for trend-continuation selling. Prefer setups where M15 shows rejection candles (pin bar/bearish engulfing) around 405x.
Scenario 2 – BUY at strong support 398x (counter-trend bounce)
Entry: 3987–3989
SL: 3980
TP: 3999 → 4014 → 4040 → 4080
Logic: 398x is a high-confluence support zone; trigger only when clear price reaction appears (long lower wicks or reversal patterns on M15–H1).
This is counter-trend, so use smaller position sizes and take partial profits.
Risk Notes & Invalidation
H1 closes above 4060: short-term bearish structure weakens → pause all sell setups and reassess.
H1 closes below 3980: buy zone fails → downside could extend further; only sell setups preferred.
Always keep risk per trade at 0.5–1%, and once reaching +1R, move SL to break-even.
Are you leaning towards continuing to sell with the trend, or waiting to buy the dip at 398x?
Follow LiamTrading on TradingView for daily XAUUSD updates

LiamTrading – XAUUSD H1 | A bearish structure has formed...LiamTrading – XAUUSD H1 | A bearish structure has formed, waiting for confirmation during the European session
Overall, gold is in a corrective downtrend after the previous bullish move. On the H1 timeframe, a clear Dow bearish structure (lower highs, lower lows) has formed. However, the support zone around 4,030 and the lower Fibonacci cluster are still potential areas where buying pressure may appear. Today’s European session will be crucial to confirm whether price continues to drop deeper or bounces back, aligning with the inverse head-and-shoulders pattern developing on H4.
Macro – Short Fundamental Outlook
The minutes from the Fed’s October meeting revealed a strong internal division:
One group opposed rate cuts and wanted to maintain current levels.
The other group supported cutting rates and even suggested further reductions in December.
This lack of consensus shows high uncertainty in monetary policy, encouraging defensive flows to continue favouring gold. In the long run, gold only surges when confidence in the financial system weakens — a gold price peak is not a sign of prosperity but a warning signal.
Technical Analysis – H1 (trendline, Fibonacci, liquidity)
Price is trading below the short-term descending trendline, confirming that the bearish phase remains active.
The 4,082–4,090 zone is an important liquidity zone — repeatedly tested and now acting as near-term resistance.
The 4,029–4,031 cluster is a key support area:
Overlaps with technical support + Fibonacci retracement.
Beginning of the large FVG that extends down to 3,985 (Fibo 1.618 + psychological support).
Above current price, the 4,129–4,130 zone is strong resistance. If price breaks and holds above this area, the bearish Dow structure will weaken significantly.
Suggested Trading Scenarios
BUY Scenario – Buying at Support / Fibonacci
Logic: Price holds above the support–Fibonacci zone, showing bottom-fishing demand.
Entry BUY: 4,029–4,031
SL: 4,022
TP: 4,040 → 4,065 → 4,090 → 4,120
Only consider buying if price shows strong reaction at 4,029–4,031 (long wick rejection or clear reversal candle on M15–H1).
Cancel this BUY plan if H1 closes below 4,022.
SELL Scenario – Following the current bearish structure (preferred if trendline remains intact)
Logic: Price retraces to resistance + descending trendline and gets rejected.
Entry SELL: 4,098–4,100
SL: 4,105
TP: 4,088 → 4,070 → 4,035 → 4,000–3,985
Only sell if price touches 4,098–4,100 with clear rejection (bearish pin bar/engulfing).
If H1 closes above 4,105 and breaks the trendline strongly, stop all sell setups and reassess.
Key Levels for Scalping
4,082 – 4,060 – 3,985 – 4,129
These levels can be used for quick intraday trades, but reduce position size and take profit fast.
Important Notes
If price closes firmly above the descending trendline and holds above 4,090–4,100, bias will gradually shift toward BUY setups, as an inverse head-and-shoulders pattern is forming on H4.
If the 4,029–4,022 support breaks decisively, gold is likely to drop toward the FVG and Fibonacci 1.618 zone around 3,985.
What scenario are you leaning toward for gold today — a pullback for another sell, or holding the bottom for a rebound? Leave your view in the comments and follow LiamTrading for daily XAUUSD updates on TradingView.

XAUUSD – CLEAR INVERSE HEAD & SHOULDERS FORMATION, CONTINUE ...💛 XAUUSD – CLEAR INVERSE HEAD & SHOULDERS FORMATION, CONTINUE TO PRIORITISE BUY SETUPS 🎯
🌤 1. Overview – Today’s Market Picture
Hello everyone, Lana here again 💬
During the Asian session this morning, gold completed the right shoulder of a very clear Inverse Head & Shoulders pattern on the H3/H4 timeframe. Those who bought following the previous setup are now in a favourable position, and in my view, this is still a good time to hold Buy positions and prepare for additional entries once the market confirms the trend.
On the macro side, according to the CME FedWatch tool, the probability of the Fed cutting rates by 25bp in December has dropped to around 30–33%, while the likelihood of keeping rates unchanged remains dominant.
This means the USD is not weak enough to push gold sharply higher, but also not strong enough to suppress it—creating a volatile range-bound environment, which is ideal for technical-pattern trading.
💹 2. Technical Analysis – Inverse Head & Shoulders & Market Structure
The Inverse Head & Shoulders pattern has formed quite cleanly:
Left shoulder → Head → Right shoulder, all supported by the long-term ascending trendline.
The demand zone around 4040–4050 is acting as a liquidity box supporting the entire structure.
The neckline is currently around 4089–4090:
Once price breaks above and closes above 4089, we can consider a confirmed bullish trend.
After the breakout, gold may extend toward 4145 → 4200, which aligns with higher liquidity zones + upper FVGs.
Zone 4130–4132:
A major liquidity cluster—where many take-profit orders & short-term sell orders may appear.
If this zone is broken decisively, price may accelerate quickly toward 4200.
Zone 4040:
This is both the bottom of the pattern and a key support.
The bullish structure fails if gold closes below 4040 on H4, which would invalidate the Inverse H&S pattern.
Overall, price is currently compressing right below the neckline, and just one strong breakout could trigger the next bullish wave.
🎯 3. Reference Trading Plan (For Study Purposes Only)
💖 Primary BUY Scenario – Following the Pattern
1️⃣ Buy on retracement to support
Entry: 4060–4063
SL: 4055
TP: 4088 → 4108 → 4130 → 4143 → 4200
2️⃣ Buy the neckline breakout
Condition: Price breaks the descending trendline & neckline, and closes above 4089.
Entry: around 4089–4092
SL: 4080
TP: 4132 → 4145 → 4200
💢 Notes on SELL Setups
Selling now is counter-trend against the pattern and not the priority.
Consider only short-term sells if:
Price reacts strongly at 4132–4145, and
Clear bearish signals appear on M15–M30 (pin bar, bearish engulfing, rising sell volume).
⚠️ 4. Fundamental Factors to Watch
High probability that the Fed keeps rates unchanged → market may stay flat before data releases, then spike in volatility.
Gold remains sensitive to data: employment, inflation, and speeches from Fed officials.
🌷 In summary
The Inverse Head & Shoulders on XAUUSD supports the bullish scenario as long as price stays above 4040 💛
Strategy:
Prioritise Buy setups: first at 4060–4063, then on the breakout above 4089.
Watch the 4132–4145 zone closely—if broken, the move toward 4200 becomes highly probable.
If you found this analysis helpful, don’t forget to 💛 Like – 💬 Comment – 🔔 Follow LanaM2 for daily gold updates!

LiamTrading – XAUUSD H1 | Gold Holds 0.618, Bullish Scenario...💛 LiamTrading – XAUUSD H1 | Gold Holds 0.618, Bullish Scenario Preferred for Wednesday 🎯
Gold continues to recover after the previous decline and is currently sitting right at the 0.618 Fibonacci level on the H1 timeframe — indicating buyers still have the upper hand. Price is also holding above the rising trendline and the thick Volume Profile area around 407x, so for today’s session, I continue to prioritise BUY setups in line with the trend.
📰 Macro – News Context
After the U.S. government reopened, the market is preparing for a series of economic data today and tomorrow → both USD and Gold may experience strong volatility.
President Trump attacked Fed Chair Powell, calling him “stupid and incompetent,” saying he once wanted to fire him immediately but was stopped by advisors.
👉 Because of this, market sentiment is very sensitive: if data leans towards a rate-cut scenario, Gold could gain additional support.
📊 Technical – H1 with Fibonacci, Trendline & Volume Profile
Fibonacci 0.618: Price is holding at the 0.618 level of the latest downswing; if this level holds, the natural target will be the upper FVG + resistance zone 4120–4150.
H1 Uptrend Line: The trendline from the recent low is supporting price very well; each retest generates a bullish reaction → an ideal area to wait for BUY entries.
Volume Profile & Liquidity:
The 4075–4080 zone is Buy Liquidity — thick volume, lots of order flow → suitable as an entry point if price retests.
VAL ~4040 and the Support + FVG area around 4020 are the next defence zones if the market sweeps deeper.
Upside liquidity:
Past H1 FVG remains unfilled up to at least 4150, so if the bullish scenario plays out, Gold can easily extend into this zone.
🎯 Trading Scenarios (LiamTrading)
1️⃣ Primary Setup – BUY with Trend
Entry: 4078–4080 (trendline retest + strong volume cluster)
SL: 4073
TP: 4094 → 4120 → 4140 → 4175
💡 Notes:
Wait for a clean M5–M15 bullish reaction (long lower wick, pin bar, or bullish engulfing) around 4078–4080 before entering.
Once price moves ~1R in profit, move SL to breakeven for account protection.
2️⃣ Short-term Scalping Zones
Support – quick buys: 4048–4023 (VAL + lower FVG zone).
Resistance – quick sells: 4121–4151 (FVG + upper liquidity zone).
These are only for scalping, so:
Enter on smaller timeframes (M5–M15).
Take profits quickly, avoid holding through major news.
✅ Summary
Short-term trend: Bullish bias as long as price holds above the H1 trendline and the 0.618 zone.
Main plan: Wait for BUY at 4078–4080, targeting 4120 → 4140 → 4175.
So, what do you think — will Gold push straight to 4150, or will it sweep down toward 404x first?
👉 Share your view in the comments & Follow LiamTrading to get daily XAUUSD plans on TradingView.

XAUUSD – Head & Shoulders Pattern Forming on H4 💛 XAUUSD – Head & Shoulders Pattern Forming on H4 🎯
🌤 Overview
Hello everyone, Lana here again 💬
After a strong drop, Gold is forming a clear Head & Shoulders structure on the H4 timeframe, aligned with the long-term ascending trendline. This pattern suggests the possibility of a bullish move back toward previous highs — but price may still dip lower to complete the structure first.
💹 Technical Analysis (ICT Perspective)
The Left Shoulder – Head – Right Shoulder is gradually shaping around the trendline + supporting FVG.
The upper 50% Fibonacci area is a reasonable zone for the right shoulder to form. If price breaks above the neckline, it may head toward the major liquidity zone around 4200.
In the short term, the 4118–4120 zone serves as resistance + neckline, making it suitable for a technical Sell setup.
The 4040–4042 area aligns with the trendline + Order Block, forming a strong support zone for potential Buy entries if price makes a deeper correction.
🎯 Trading Plan (For Reference Only)
💢 SELL Scenario (scalping at resistance)
Sell: 4118–4120
Stop Loss: 4125
Take Profit: 4105 → 4086 → 4060 → 4040
💖 BUY Scenario (preferred with the main pattern)
Buy: 4042–4040
Stop Loss: 4034
Take Profit: 4075 → 4090 → 4100 → 4140 → 4200
⚠️ Important Notes
Trading based on patterns is always expectation-driven, so combine it with candlestick confirmation on smaller timeframes (M15–M30) before entering.
Upcoming FOMC Meeting and NFP report, especially after the long U.S. government shutdown period, may cause unpredictable volatility.
Reduce position size and avoid holding large trades during major news events.
🌷 Final Thoughts from LanaM2
The H4 Head & Shoulders pattern on Gold is offering attractive opportunities for both short-term Sells and trend-aligned Buys 💛
Stay patient, wait for price to reach the marked zones, follow your stop-loss rules, and avoid FOMO during high-impact news.
If you found this helpful, please 💛 Like – 💬 Comment – 🔔 Follow LanaM2 for daily Gold insights!

LiamTrading – XAUUSD H1 | Gold on a downward trend, hitting ...💛 LiamTrading – XAUUSD H1 | Gold on a downward trend, hitting strong support around 4005 🎯
Gold has plunged from its peak, currently “visiting” the 4005–3990 zone, where trendline + POC/OB + high liquidity converge. This is a zone where a technical rebound might occur, but the short-term trend remains bearish, so any BUY orders need to wait for clear confirmation.
🔍 Fundamental Analysis
Goldman Sachs forecasts that during 2025–2026, central banks will purchase an average of ~80 tons of gold per month, a significant driver that could push gold towards 4,900 USD/oz by the end of 2026.
This keeps the long-term trend of gold bullish, but in the short term, deep corrections like the current one are normal to “shake off” positions before big money returns.
📊 Technical Analysis
Current trend:
H1 is still in a short-term downtrend phase (lower high – lower low), with prices below the 4080–4100 resistance zone and below the nearest descending trendline.
Main support zones:
4005–3990: intersection of long-term rising trendline, POC – OB, old VAH/VAL zone → crucial support, potential for bottom-fishing buying force.
3975–3977: deeper support, coinciding with liquidity zone & recent low.
Key resistance zones:
4098–4100: confluence of resistance + trendline test → ideal zone to watch for SELL retracement.
Above is the cluster 4011 – 4053 – 4077 – 4098–4100 acting like “steps” for scalping orders.
Volume Profile:
Heavy trading volume around the 4000–4020 zone → prices tend to revisit this area multiple times before moving away.
🎯 Reference Trading Scenarios
SELL – following the downtrend (priority)
Entry: 4098–4100
SL: 4105
TP: 4082 → 4060 → 4035 → 4012
Price retraces to resistance + descending trendline.
Only trigger when M15–H1 shows clear rejection candles (pin bar/bearish engulfing) around 4098–4100.
BUY – catching the rebound at strong support
Entry: 3975–3977
SL: 3970
TP: 3995 → 4025 → 4050 → 4080
Confluence support zone at channel bottom + POC/OB + liquidity.
Only BUY when there is strong rejection or a clear reversal pattern (M15–H1).
⚠️ Price zones to watch for scalping
4011 – 4053 – 4077 – 3939
These zones are suitable for short scalps, prioritising the main trend (currently bearish), quick exits – do not hold positions too long.
🧠 Risks & Invalidations
H1 closes above 4105 → reduces SELL priority, wait for new structure.
H1 closes below 3970 → bad structure for BUY side, potential for further decline to lower zones.
Are you watching to BUY or SELL gold in this zone?
👉 Comment your perspective & Follow LiamTrading channel for daily XAUUSD plans.

XAUUSD – TWO MAIN SCENARIOS FOR THE DAY: MONITOR REACTION AT...💛 XAUUSD – TWO MAIN SCENARIOS FOR THE DAY: MONITOR REACTION AT TRENDLINE 🎯
🌤 1. Overview
Hello everyone 💬
Gold is currently waiting at the H4 trendline, indicating the market is lacking volume to decide the next direction.
Although the price is adjusting after the drop from the 4,400 USD zone, the larger trend is still supported by strong buying flows from central banks.
💹 Market Context
According to Goldman Sachs, the current decline is only temporary, as the demand for gold as a safe haven asset remains strong:
US bond yields are falling
USD is weakening
The US economy is under pressure from unemployment and inflation
In September alone, central banks purchased 64 tonnes of gold, and forecasts suggest that November may continue this strong accumulation trend.
💹 Technical Analysis
📉 If Gold breaks below the trendline → the market will trigger strong selling pressure, pulling back to the 395x zone, where there is low liquidity and important support.
📈 Conversely, if the price holds the trendline and volume pushes up, a short-term upward structure will form.
📌 The 4068 zone is a key level — if the price retests this area and falls back, Buy will only activate when it reaches 4034.
🎯 Reference Trading Scenarios
🔻 SELL – When breaking the trendline (priority if volume is strong)
Sell 4036–4038 │ SL: 4044
TP: 4010 → 3995 → 3970 → 3945
🔹 BUY – Strong support 395x
Buy 3952–3954 │ SL: 3957
TP: 3975 → 3995 → 4030
🔸 BUY maintaining trend (if price rebounds at 4068)
Buy at 4034 after confirmation signal
⚠️ Important Note
Volume is currently low, making the market prone to stop sweeps, so enter orders with small volume.
The larger trend is still supported by flows from central banks, but in the short term, Gold may fluctuate strongly around the trendline.
Prioritize trading based on price reactions at key zones rather than predicting direction in advance.
🌷Gold is in a sensitive phase at the H4 trendline 💛
If you find this useful, please 💛 Like – 💬 Comment – 🔔 Follow LanaM2 to receive daily gold analysis ✨

LiamTrading – XAUUSD H1 | Continue to watch for SELL at the ...LiamTrading – XAUUSD H1 | Continue to watch for SELL at the start of the week – wait for price to retrace to the trendline & resistance for a perfect entry
Gold is experiencing a sharp decline amidst global market liquidity pressures. The simultaneous drop in gold, stocks, and Bitcoin indicates that capital is being withdrawn from risky assets and even safe havens, similar to tense periods like the 2008 crisis or the early 2020 pandemic. Investors are selling profitable assets to cover losses elsewhere.
In the long run, gold usually recovers sooner, but in the short term, the downtrend still prevails.
On H1, the price is below the descending trendline, under the 4100 resistance, and is moving in a clear Lower High – Lower Low structure. This is a good signal to continue prioritising SELL orders retracing to resistance.
🔍 Technical Analysis (Trendline • S/R • Fibonacci • Liquidity)
The descending trendline is the biggest barrier; each time the price hits the trendline, it is strongly rejected.
Main Resistance:
4098–4100: resistance area + confluence with the trendline.
4120–4130: stronger area if the price retraces deeply (close to Fibo 0.382).
Target Support:
4065: intermediate support – where the price has bounced slightly several times before.
4040 – 4025: large liquidity area – confluence with the H1 FVG bottom.
3985–3995: the end zone of the down wave if the selling force expands.
Liquidity Zone:
Many liquidity sweep bottoms continuously → indicates that the selling force still prevails.
The lower FVG area (around 4025–4040) is highly likely to be filled within the week.
📉 Trading Scenario (prioritise SELL retracement)
Scenario – SELL retracement to trendline + resistance (priority)
Entry: 4098–4100
SL: 4106
TP: 4088 → 4065 → 4040 → 4025
💡 Suggestion: Wait for M5–M15 to form a rejection candle (pin bar / bearish engulfing) before executing the order.
When to BUY?
Only BUY if:
H1 closes above 4120, breaking the descending trendline → short-term trend phase change.
If this signal is not present → do not rush to buy against the trend.
⚠️ Important Note
The phenomenon of “selling everything to hold cash” may continue → gold may remain under pressure in the short term.
Which price range are you watching for today's session?
Comment below & Follow LiamTrading channel for the fastest updates!

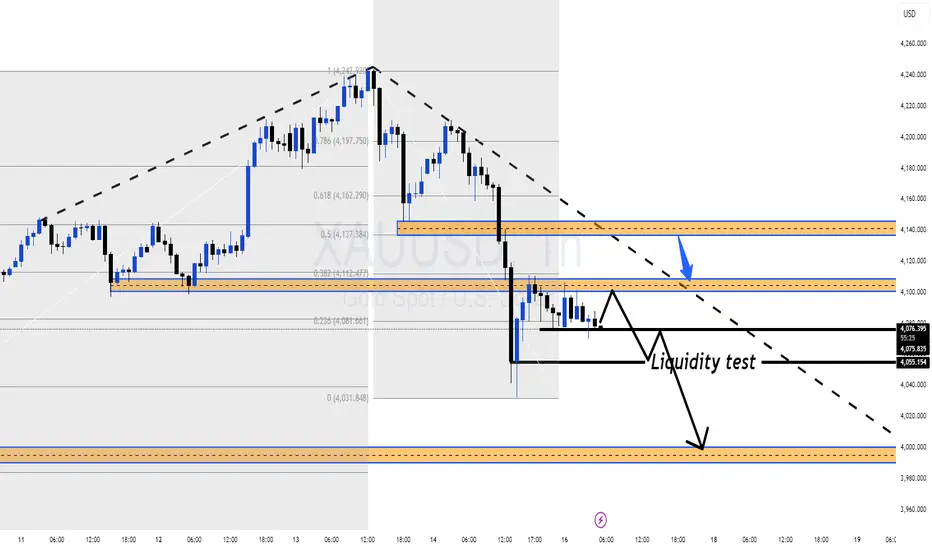
Gold Still in Distribution, FOCUS ON SELL Setups at 4,10x–4,14x 🔍 Market Context
Risk sentiment remains fragile as investors reassess the global rate and stimulus story.
Goldman Sachs notes that rising worries about the size of Japan’s fiscal stimulus are bringing financial risk premia back, putting pressure on long-term JGBs and the JPY. Capital tends to rotate into USD and yield-bearing assets in this environment, which limits the upside for gold in the short term.
📊 XAU/USD Technical Structure (H1)
After topping around 4,242 USD, gold broke its short-term uptrend and is now moving in a descending structure.
Price is currently capped below the 0.5–0.382 Fibonacci area around 4,11x, which overlaps with a strong supply / Sell Liquidity zone on the chart.
Below price, we have a series of liquidity / support pockets:
4,098 – 4,077 – 4,048 USD: short-term downside liquidity levels.
OBS BUY ZONE around 4,00x: major demand zone where price previously launched a strong rally.
Current price action shows sellers still in control – every bounce into 4,10x–4,14x is being rejected quickly, which fits a “sell the rally” approach.
🎯 Trend-Following Trade Ideas (for reference)
Zones below are technical areas to watch, not signals or financial advice.
Scenario 1 – Shallow Pullback Sell
Sell Zone 1: 4,102 – 4,104
SL: 4,110
TP levels:
TP1: 4,098
TP2: 4,077
TP3: 4,048
Idea: Price makes a minor intraday pullback into local supply, then resumes selling pressure toward lower liquidity pockets.
Scenario 2 – Deeper Pullback into Fib/Trendline Confluence
Sell Zone 2: 4,142 – 4,144
(confluence of descending trendline + Fibonacci combo)
SL: 4,150
TP levels:
TP1: 4,133
TP2: 4,105
TP3: 4,088
TP4: 4,060
Idea: If the market grabs more upside liquidity first, the 4,14x zone offers a better R:R area to align with the H1 downtrend.
⚜️ MMFLOW TRADING View
As long as price stays below 4,14x and H1 structure keeps printing lower highs, gold remains in a distribution phase.
Pullbacks into the 4,10x–4,14x liquidity band are treated as opportunities to optimize SELL entries, while the 4,00x OBS BUY ZONE is the key area to reassess any potential larger bottoming process.
“In a downtrend, our job isn’t to call the bottom – it’s to use every weak bounce to sell from a better position.”
XAUUSD – H1: PRIORITISE BUY ACCORDING TO PRICE CHANNEL...💛 XAUUSD – H1: PRIORITISE BUY ACCORDING TO PRICE CHANNEL, WATCH FOR ADJUSTMENT MOVES 🎯
🌤 Overview
Gold is maintaining its upward channel on H1 → main mindset: hold Buy longer than Sell.
Asian–European sessions present multiple liquidity clusters suitable for scalping and optimising entry points.
Fundamentals: DXY retreats around 99.15, market reduces expectations of Fed rate cut in December; Fed's Collins hints rates may remain unchanged longer → gold's range may experience short-term fluctuations.
💹 Technical (ICT view)
H1 upward channel maintains a structure of higher lows; the lower trendline is the main support.
4163–4165: confluence of trendline + liquidity (ideal Buy entry point).
4130–4133: deeper support; below that is the 4100–4080 zone (medium-term support; around Fibo ext 1.618 ≈ 4114 and 2.618 ≈ 4054).
Nearby resistance: 4215–4225; a decisive break opens up to 4260.
🎯 Trading Plan Reference
Buy #1 (priority): 4163–4165 │ SL 4157 │ TP 4180 → 4195 → 4220 → 4260
Buy #2 (deeper support): 4130–4133 │ SL 4125 │ TP 4150 → 4175 → 4190 → 4220
Sell (only with confirmation):
Scenario A: M15/M30 gives strong rejection signal at 4215–4225 → SL 4230 │ TP 4200 → 4188 → 4165.
Scenario B: H1 closes below 4157 (breaks structure) then fails retest → target 4135 → 4115 → 4100.
⚠️ Risk Management Notes
Prioritise Buy according to trend; Sell orders are only short-term reactions.
Use M15/M5 to time entries at the specified zones.
If H1 closes below 4125, consider narrowing buy positions, wait for the 4100–4080 zone.
🌷 Conclusion
H1 upward channel still guides the flow 💛. Patiently wait for adjustments to 4163–4165 or 4130–4133 to buy according to trend, manage orders tightly as price approaches 4215–4225.
If useful, please 💛 like – 💬 comment – 🔔 follow LanaM2 for daily gold updates ✨

LiamTrading – XAUUSD M45 | Fibonacci perspective on the ...LiamTrading – XAUUSD M45 | Fibonacci perspective on the upward wave: watch for sell at 2.618 @ 4229–4231, wait to buy at FVG 4174–4172
Quick context: News of the US government reopening eases tensions, but gold prices in the Asian session this morning only rose slightly before moving sideways – accumulating. On M45, the triangle has broken upwards but buying momentum hasn't truly exploded; the market may test the price gap areas (FVG) before choosing the next direction.
Technical Analysis
Trendline & M45 structure: The rise after breakout is running along the short-term upward trendline; the old triangle peak becomes resistance near 4215.
Fibonacci Extension:
2.272 ≈ 4215: pivot point; staying above this opens the path for higher levels.
2.618 ≈ 4229–4231: extended resistance – a zone prone to rejection/short reversal.
FVG & Liquidity Zones:
FVG #1: 4195–4198 – likely to fill before continuing upwards.
Liquidity: 4184–4188 – volume attraction zone between FVG and trendline.
Fibo 0.618 + FVG: 4172–4174 – strong confluence for the buyback scenario in line with the trend.
Invalidation point: breaking 4166 weakens the M45 upward structure, risking a pullback to lower zones.
Trading Scenarios
Scenario 1 – Trend-following Buy (priority)
Entry: 4172–4174 (Fibo 0.618 + FVG)
SL: 4166
TP: 4190 → 4215 → 4240 → 4280
Note: Prioritise when a clear rejection candle/lower wick appears at 417x.
Scenario 2 – Counter-trend Sell scalp at extended resistance
Entry: 4229–4231 (Fibo 2.618)
SL: 4236 (above the nearest peak)
TP: 4215 → 4196 → 4186 → 4175
Note: Quick scalp; abandon if M45 closes strongly above 4231–4233.
Scenario 3 – Buy on break & hold of 4215 (break & retest)
Condition: M45 closes above 4215, retests holding 4212–4216
Entry: 4216–4218
SL: 4207
TP: 4229–4231 → 4260 → 4285–4300
Which price zone do you find noteworthy today? Comment below & hit Follow on LiamTrading channel for the latest updates.

XAUUSD – REFERENCE SCENARIO FOR 13/11 – TRACKING ELLIOTT WAVE 5💛 XAUUSD – REFERENCE SCENARIO FOR 13/11 – TRACKING ELLIOTT WAVE 5 🎯
🌤 Overview
Hello everyone 💬
Gold is currently trading around the 4210 region, indicating that the upward momentum has slowed after two strong days of gains.
According to Elliott wave, wave 5 may not have ended yet, and this region is becoming a strong resistance – where prices can accumulate or adjust at any moment.
Besides technical factors, political news from the US President's administration is causing significant USD fluctuations, leading to a wide range of gold movements in the short term. Therefore, today it is crucial to prioritise risk management and monitor price reactions in the 4210–4260 region.
💹 Technical Analysis
📈 On the H4 chart, gold is approaching the resistance area of 4210–4260, which also coincides with the 0.236 Fibonacci and the previous FVG zone.
🟣 The bearish view (ABC correction) will be confirmed when the price breaks below 4180 – targeting an adjustment to 4120–4050.
🔹 The bullish view remains valid if the price closes the H4 candle above 4212, in which case the trend could extend to 4250–4280.
🎯 Reference Trading Plan
💖 BUY Scenario (on breakout)
Entry: 4230–4232 | SL: 4225
TP: 4165 – 4190 – 4250
💢 SELL Scenario (reaction at resistance)
Entry: 4265–4267 | SL: 4273
TP: 4249 – 4215 – 4200
⚠️ Important Note
Closely monitor reactions at the levels: 4246 – 4212 – 4260 – 4280.
USD is highly volatile due to political factors, which may cause rapid fluctuations in gold.
🌷 Gold is at a crucial transition zone – Elliott wave 5 may soon end or expand further 💛
Be patient for clear confirmation, as at this stage, even a small deviation can change the entire price structure.
If you find this useful, please 💛 like – 💬 comment – 🔔 follow LanaM2 to keep updated with daily gold insights with me ✨

LiamTrading – XAUUSD H2 | USD strengthens again, gold ...LiamTrading – XAUUSD H2 | USD strengthens again, gold consolidates in an upward channel; await correction to 4090/4041 – break 4145 to confirm further rise
Quick context: USD recovery causes gold to move sideways during the Asian session. Price is moving within an upward channel, hitting the upper trendline and reacting around 4100, not forming a lower low yet. To confirm the continuation of the uptrend, a break of 4145 is needed; otherwise, prioritise the technical correction scenario towards liquidity zones.
Technical Analysis (Volume Profile • Trendline • S/R • Fibonacci)
Channel & Trendline: Channel top coincides with 4135–4145 → likely to see profit-taking pressure. Holding the lower edge of the channel ~4085–4090 keeps the upward structure valid.
Liquidity & FVG:
Liquidity 4090: price pull/volume attraction zone before choosing direction.
Fibonacci Retracement + old resistance ~4041–4043: strong confluence for a bounce if deep correction occurs.
Main resistance: 4130–4135 (retest of channel top), 4145 (pivot confirming rise), 4200 (sell scalp area if clear rejection appears).
Main support: 4084–4086 (channel edge/liq), 4041–4043 (Fib + S/R), deeper 4020 is a defensive point for buyers.
Trading Scenarios (optimised for mobile reading)
Scenario 1 – Buy shallow pullback (trend-following priority)
Entry: 4084–4086
SL: 4078
TP: 4098 → 4112 → 4135 → 4160
Suggestion: Wait for rejection candle at 4090 or M15 reversal signal before entry.
Scenario 2 – Buy deep (Fib + S/R)
Entry: 4041–4043
SL: 4036
TP: 4056 → 4072 → 4095 → 4120
Suggestion: Prioritise when price fills the gap and leaves a clear lower wick.
Scenario 3 – Sell scalp at resistance (counter-trend)
Entry: 4130–4132
SL: 4138
TP: 4112 → 4100 → 4088 → 4060
Note: Quick scalp only; abandon if H1/H2 closes strongly above 4145.
Bonus – Sell scalp 4200
Condition: Clear rejection on smaller timeframe.
SL: above the nearest recent high.
Reference TP: 4185 → 4166 → 4145.
Risk Management & Invalidation
Short-term bullish bias remains valid if price holds above 4085–4090.
H2 closes above 4145 → prioritise buying on breakout, limit all sell orders.
H2 closes below 4036 → risk of deeper test around 4020.
Risk per trade 0.5–1%, move SL to breakeven at +1R, do not average against the trend.
Which price zone do you find noteworthy today? Comment below & hit Follow on LiamTrading channel for the earliest updates.

XAUUSD – PRIORITISE BUYING WHEN PRICE ADJUSTS💛 XAUUSD – PRIORITISE BUYING WHEN PRICE ADJUSTS 🎯
🌤Overview
Good morning traders 💬
Gold is experiencing a slight adjustment after encountering resistance at the VAH zone on the Volume Profile. This is a natural reaction in the current uptrend.
The price observation zone for today's adjustment is around the H4 trendline at 4078, deeper is the VAH zone 4020, where there is good liquidity for buyers.
Although there might be a short-term adjustment, the main trend remains upward. Therefore, I prioritise waiting to Buy at the support zone, rather than entering a trade against the trend.
💹 Technical Analysis (ICT Perspective)
📈 The price is maintaining a medium-term upward structure, with no reversal signals yet.
🟣 The 4075–4078 zone coincides with the trendline + liquidity zone – a potential buying area for short trades.
🔹 VAH around 4020 is strong support, suitable for long-term Buy if the price adjusts deeply.
💫 The 4200–4203 zone remains a major resistance (Sell Zone) – expect a downward reaction when the price approaches.
🎯 Reference Trading Plan
💖 Buy scalping (short-term)
Entry: 4075–4078 | SL: 4070
TP: 4095 – 4105
💖 Buy zone (main priority)
Entry: 4018–4021 | SL: 4011
TP: 4035 – 4042 – 4075 – 4095
💢 Sell zone (short reaction)
Entry: 4200–4203 | SL: 4210
TP: 4186 – 4165 – 4140
💢 Sell scalping (short-term)
Entry: 4122–4124 | SL: 4130
TP: 4105 – 4086 – 4060 – 4040
⚠️ Important Note
The 4048 zone is strong resistance – closely observe price reactions here.
Prioritise Buy according to the main trend, Sell should only be considered as a short-term reaction.
🌷Be patient and wait for the price to adjust to the support zone to buy according to Smart Money flow.
If you find this useful, please 💛 like – 💬 comment – 🔔 follow LanaM2 for daily gold insights ✨

LiamTrading – XAUUSD H2 | A corrective phase might occur todayLiamTrading – XAUUSD H2 | A corrective phase might occur today
Follow Liquidity 4090, FVG 4053–4069 & VAH ~4025
Quick glance: Gold remains in an uptrend but shows signs of stalling at the upper boundary of the rising channel. With the USD potentially volatile as the US nears “reopening”, a technical correction towards liquidity zones is a scenario to prepare for.
Technical Analysis
Trendline/Price Channel: Price is moving within an ascending channel; the channel top around 4130–4140 is prone to profit-taking/stalling.
Liquidity: 4085–4092 – a price pull/volume attraction point before choosing the next direction.
FVG #1: 4053–4069 – a price gap likely to fill and rebound.
VAH (Volume Profile): 4023–4028 – volume value peak; strong confluence support during deep corrections.
POC: ~3985–3990 – a magnetic level if the market weakens more than expected.
Resistance: 4135–4140 (near channel top + short-term offer), further 4166 (Fibo/channel top extension).
Fibonacci: The latest upward wave shows the expansion area around 4135–4166 as a “liquidity pocket” – suitable for scalp sell upon clear rejection; retracement levels 0.382–0.5 converge around 406x–402x, matching FVG & VAH → priority buy point if price corrects.
Trading Scenarios
Buy shallow pullback (trend-following)
Entry: 4083–4085
SL: 4077
TP: 4098 → 4112 → 4140 → 4166
Note: Require rejection/wick at Liquidity 4090; move SL to breakeven at +1R.
Buy deep at VAH/Volume Profile
Entry: 4025–4028
SL: 4020
TP: 4040 → 4065 → 4100 → 4112
Note: Prioritize when FVG 4053–4069 fills and rebounds; exercise caution with volume.
Sell scalp at channel resistance (counter-trend)
Entry: 4135–4140
SL: 4148
TP: 4122 → 4105 → 4090
Note: Only a scalp trade; abandon if H1/H2 closes strongly above 4140.
H1/H2 closes below 4077 → risk of testing 4053–4069; breaking further 4020 might drag to POC ~3990.
Each trade risks 0.5–1%, do not average against the trend; adhere to Dow (enter only when support/resistance is confirmed broken on entry timeframe).
Which level are you watching for gold today? Comment below & hit Follow on LiamTrading channel for the fastest updates.

XAUUSD – PRIORITISE BUYING ON TUESDAY💛 XAUUSD – PRIORITISE BUYING ON TUESDAY 🎯
🌤 Overview
Hello everyone 💬
Gold continues its upward momentum in the first two days of the week, supported by the cash distribution policy for low-income individuals and the reopening moves by the US government under President Trump.
These factors are putting downward pressure on the USD, helping gold prices maintain a short-term upward trend.
💹 Technical Analysis
🟣 Currently, the price is touching the VAH area according to the Volume Profile and showing a slight reaction – however, the support trendline around 4110–4113 remains an ideal buying zone to continue following the trend.
🔹 The 4200–4203 area (Fibonacci Extension 2.618) coincides with the strong resistance of H4, likely to see a short adjustment reaction before continuing to extend to the 43xx area.
🎯 Trading Plan Reference
💖 BUY Scenario (priority trend-following)
Entry: 4110–4113 | SL: 4106
TP: 4132 – 4150 – 4175 – 4200 – 4250
💢 SELL Scenario (short-term reaction)
Entry: 4200–4203 | SL: 4207
TP: 4188 – 4165 – 4148
⚠️ Important Notes
Prioritise buying according to the main upward trend, especially when the price reacts at the H4 trendline.
Sell orders are only for short-term reactions, and profits should be secured early when the first TP is reached.
USD volatility remains a key factor to closely monitor this week.
🌷 Conclusion
The upward trend of gold is still maintained 💛
Be patient and wait for the price to react at the 4110–4113 area to buy according to the trend, and take advantage of pullbacks at resistance to manage orders effectively.
If you find this useful, don't forget to 💛 like – 💬 comment – 🔔 follow LanaM2 for daily gold insights ✨

XAUUSD – PRICE STRUCTURE UPDATE: MAINTAINING THE TRADING ...💛 XAUUSD – PRICE STRUCTURE UPDATE: MAINTAINING THE TRADING SCENARIO 🎯
🌤 Overview
Hello everyone 💬
The price structure of gold is still on track as per the previous scenario — those who have bought according to the prior plan might have already profited and should continue to hold their ground.
The price in the Asian session at the start of the week has risen steadily, breaking through the 4021 zone, confirming a short-term uptrend and aiming to retest the upper edge of the H4 price channel.
This is a positive signal before the market might enter a deeper correction in the mid-week sessions.
In terms of news, the latest statement from US President Trump indicates that the government shutdown might soon end — this is a factor that could cause significant USD volatility, thereby having a short-term impact on gold prices.
💹 Technical Analysis
📈 On the H4 frame, the price remains within the medium-term upward channel, maintaining the structure of “higher lows”.
🟣 Breaking the 4021 zone confirms that upward momentum is prevailing, and the Sell Zone Liquidity 4090–4100 continues to be the short-term target for testing.
🔹 After hitting this zone, a correction is expected towards the 3920 – 3785 zone (Buy Zone Fibonacci) – where buyers might return strongly.
💫 The current price signal is entirely in line with the previous technical scenario, with no need to change the trading plan.
🎯 Reference Trading Plan
💢 SHORT scenario (short-term)
Entry: 4098–4102 | SL: 4112
TP: 4078 – 4025 – 3998 – 3920 – 3875 – 3785
💖 LONG scenario (long-term strategy)
Entry: 3785–3789 | SL: 3777
TP: 3810 – 3865 – 3925 – 3988
🌷 Conclusion
Gold prices are moving exactly as predicted in the structure 💛
Be patient, maintain discipline, and stick to the key price zones – this is the time when perseverance will yield the greatest advantage.

LiamTrading – XAUUSD | Early Week Bullish Scenario...LiamTrading – XAUUSD | Early Week Bullish Scenario: Successful Box Breakout, Watch for Retest at 4056 & Deep Buy at 3998–4000
The price has just broken out of the accumulation box and accelerated as per the weekend scenario. Bullish inclination for the day, with a near-term target of 4080 → 4110; the 4110–4112 zone is a suitable psychological resistance for scalping. Prioritise buying at the 4056 retest or deep buying at 3998–4000 when the price sweeps liquidity and then rebounds.
The US Senate takes further procedural steps to end the shutdown. Expectation of systemic risk cooling → pressure on USD decreases, supporting gold in the short term.
The process still has a few steps, fluctuations around news hours might be volatile → adhere to technicals, manage risks tightly.
Technical Analysis (H1/H2) – Volume Profile • Trendline • S/R • Fibonacci
Structure & Trendline: Box breakout upwards, trend-following capital dominates. Short-term uptrend when the price holds above 4056 (retest point of breakout zone).
Support/Resistance (S/R):
Support: 4056 (retest), 4025–4038 (FVG liquidity fill), 3998–4000 (Buy Zone Liquidity).
Resistance: 4110–4112 (psychological + short-term supply cluster), 4160–4165 (Fibo extension).
Fibonacci Extension:
1.618 coincides with 4110–4112 → likely reaction/scalp sell.
2.272 targets ~4160 → extended target/final profit exit.
Today's Trading Scenario
Continuation Buy (priority)
Entry: 4056–4060 (retest of breakout zone)
SL: 4048
TP: 4080 → 4110 → 4160
Management: Move SL to breakeven at +1R; partial close at 4080/4110.
Deep Liquidity Buy (cautious volume)
Entry: 3998–4000
SL: 3992
TP: 4020 → 4045 → 4080 → 4110
Note: Enter only with clear rejection candle (long lower wick, M1–M15 reversal) or after FVG fill and rebound.
Scalp Sell at Psychological Resistance (counter-trend)
Entry: 4110–4112
SL: 4118
TP: 4100 → 4080 → 4065
Note: Abandon trade if H1 closes strongly above 4112 or if the uptrend is too strong (breakout with volume).
Invalidation & Notes
Short-term bullish bias invalidated if H1 closes below 4048 → may test deeper at 4025–4038 or 3998–4000.
Avoid entering trades close to news hours about the US government reopening process.
Risk per trade: 0.5–1%, adhere to discipline of moving SL at +1R.
If you find this useful, comment on the price levels you're watching and hit Follow on LiamTrading to receive daily updates.

$4,005 BROKEN! GOLD READY FOR CPI COLLAPSEFranCi$$_FiboMatrix Emergency Action Plan (H1 Focus)
Welcome Traders! Gold (XAU/USD) has attracted sellers and is now trading below $4,100. With the US CPI release looming, the DOWNSIDE BREAKDOWN is our highest conviction scenario!
1. Market Snapshot
Current State: Gold is consolidating in a Sideway Zone between $4,159 (Resistance) and $4,005 (Critical Support).
Pressure: The recent break below $4,100$ and the recovering USD are key bearish factors.
The Catalyst: US CPI today. A hot inflation print will fuel the USD and shatter the $4,005$ floor.
Dominant Risk: Break below $4,005.438$ confirms the major bearish trend targeting $3,889$.
2. MAIN TRADING PLAN: Breakdown Scenario (SHORT) 💰
We are setting the trap to execute the SELL trade immediately upon the decisive breach of the $4,005$ Support.
Activate SHORT: Breakdown below $4,005.438$. (Wait for H1 close confirmation).
STOP-LOSS (SL): $4,159.686$. Placed safely above the Sideway Resistance.
TAKE-PROFIT 1 (TP1): $3,938.128 (Fibo Target).
TAKE-PROFIT 2 (TP2): $3,889.330 (Ultimate Structural Target).
3. Contingency Scenario (LONG) ⬆️
Activate LONG: Only if Gold decisively breaks $4,159.686$ (Breakout Zone) and targets $4,237.334.
Note: High-risk counter-trend trade, likely requiring a major negative surprise from the CPI report.
Community Interaction 🚀
The CPI is coming! Will the data be hot enough to smash $4,005$? Or is the Sideway Zone here to stay?
Drop your priority scenario NOW! 👇

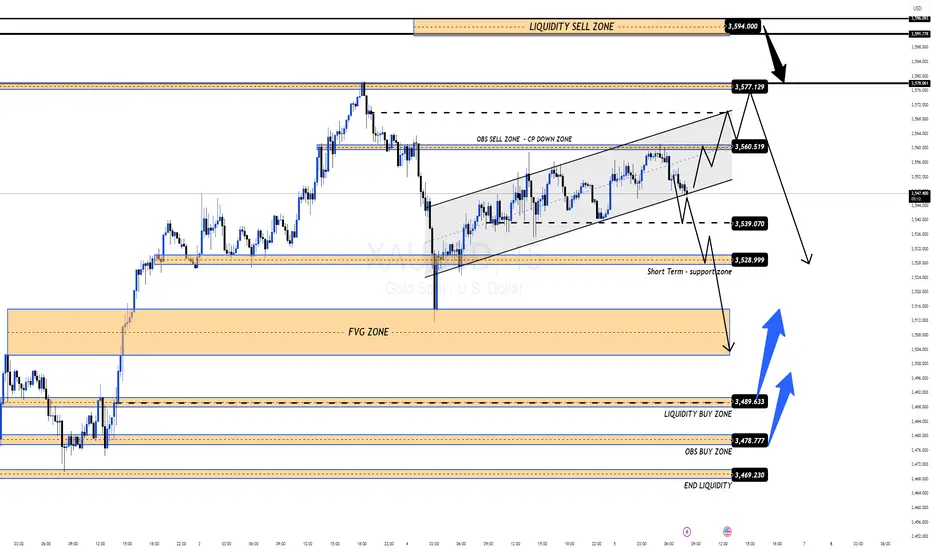
XAUUSD Daily Trading Plan Ahead of NFP | MMFLOW TRADINGGold (XAUUSD) has slowed down after a strong bullish rally and is now consolidating in a sideways range 355x – 354x, waiting for today’s Non-Farm Payrolls (NFP) data to set the next major move.
📊 Macro View:
If NFP comes out better than expected, USD strength could push Gold lower into 352x – 350x zones, filling liquidity gaps before buyers step in.
If NFP is worse than forecast, Gold may break above ATH 357x and test higher liquidity zones near 3594+.
🔑 Key Resistance Levels
3560 – 3576
3594
🔑 Key Support Levels
3540
3528 – 3514
3502 – 3488 – 3478
📌 Trade Setups (MMFLOW Trading View)
🔵 BUY Zone: 3488 – 3486
🔴 SL: 3480
✔️ TP: 3492 – 3496 – 3500 – 3510 – 3520 – 3530 – 3540 – ????
🔵 BUY Scalp: 3528 – 3526
🔴 SL: 3520
✔️ TP: 3532 – 3536 – 3540 – 3550 – 3560 – ????
🔴 SELL Scalp: 3574 – 3576
🔴 SL: 3580
✔️ TP: 3570 – 3565 – 3560 – 3550 – 3540 – 3530 – ????
🔴 SELL Zone: 3593 – 3595
🔴 SL: 3600
✔️ TP: 3588 – 3584 – 3580 – 3570 – 3560 – 3550 – ????
📊 MMFLOW Trading View:
Gold is building momentum inside the 3540 – 3565 range.
Break below 3540 → correction towards 352x – 350x.
Break above 3565 → retest of 357x – 3595 supply zone.
Best setups are waiting for price reaction near 3515 – 3528 (Buy Zone) or 3576 – 3595 (Sell Zone).
Bearish Pressure Builds: Gold Poised for More RetreatGold retreated sharply today as expected, and directly hit my expected retracement target of 3520-3510 area; the lowest point happened to be around 3511. We added a lot of short positions around 3575 and 3578 overnight, which helped us to make considerable profits during the gold retreat. All short positions made a total profit of 1830pips after being closed.
Since gold has begun to retreat from 3578, and the retracement has reached 670 pips in the short term, a retracement that is rare in recent times, as gold has shown obvious signs of retreat, once large funds begin to withdraw, it may trigger serious selling sentiment in the market. Taking this opportunity, the gold market may usher in a round of sharp correction. Moreover, after gold retreats, 3578 is expected to become the interim peak, which will limit the room for gold to rebound while being conducive to the downward pressure on gold.
In addition, gold rose sharply before the NFP market, probably to reserve room for the NFP market to fall, so I think gold still has the demand and space to continue to retreat, so the current decline has not ended yet, and I think the current short-term rebound provides us with good conditions for entering the short market.
According to the current structure, gold still needs to retreat after fluctuating at high levels. Therefore, in trading, we can still look for suitable opportunities to short gold during the gold rebound. First of all, we need to pay attention to the short-term resistance area of 3545-3555. Once gold cannot effectively stand in this area during the rebound, gold will also test the 3510-3500 area. After falling below this area, it is expected to continue to the 3490-3480 area.

Gold on it’s target - Next Move BullishOur yesterday analysis went TRUE . As expected after reaching high gold came down for correction. As you all know today there is PMI news today, so market will come down and after that take upward momentum. So do wait for it and after that execute the trade.
Key point.
Support - 3348, 3335, 3329
Resistance - 3354, 3362, 3371
Any Query Reach Us or comment down
Rudra Vasaikar Wishes You A Great And Very Amazing Trading Life. Trade Safe, Trade Right.
RISK WARNING 🔴 🔴 🔴
There is high risk of loss in Trading Forex, Crypto, Indices, CFDs, Features and Stocks. Choose your trade wisely and confidently, please see if such trading is appropriate for you or not. Past performance is not indicative of future results. Highly recommended - Information provided by Pro Trading Point are for Educational purpose only. Do your investment according to your own risk. Any type of loss is not our responsibility.
HAPPY TRADING.
#gold #xauusd #xauusdtrading #goldtrading #goldanalysis #forextrading #forex #trendline #goldsignals #goldnews goldlatestanalysis #xauusdtradesetup #forextradingguide #fxgold
