GOLD WEEKPLAN: UP FIRST DOWN AFTEROANDA:XAUUSD Footprint Analysis
The Footprint chart provides a more detailed view of the order flow. Here are some key points:
Price Pullback: The recent candles show a decrease in buying pressure (green) and an increase in selling pressure (red).
Volume Footprint: The trading volume (Total) and Delta (the difference between buying and selling pressure) on each candle show the order distribution.
The candle on the 19th has a negative Delta (~ -5.96 K), indicating that selling pressure is dominant, which aligns with the corrective pullback.
However, there's no major volume divergence, suggesting that this may only be a typical correction.
Detailed Footprint Analysis: The numbers within each candle show the number of buy orders (on the left) and sell orders (on the right) at each price level. When the price pulls back to the Imbalance or Strong OB zone, it's crucial to monitor the Footprint for signs of buying pressure returning (Delta turning positive or significant buying volume at key price levels), which would serve as a confirmation signal for a long entry.
OANDA:XAUUSD General Analysis
The XAUUSD market is in a strong uptrend, confirmed by the market structure:
Higher Highs (HH): Each new peak is higher than the previous one.
Higher Lows (HL): Each new trough is higher than the previous one.
Recently, the price created a Break of Structure (BOS), breaking the previous high, which indicates a continuation of the uptrend. After the BOS, the price established a new high (HH) and is now making a corrective pullback to find a strong support zone before continuing its upward momentum.
Imbalance (Fair Value Gap - FVG): This is a liquidity void created when the price moves too quickly. According to SMC theory, the market tends to return to fill this gap.
Location: The price range is from ~$3660 to ~$3670 USD.
Significance: This zone could act as a temporary support level. If the price returns to this area, it might fill the Imbalance and then continue to rise.
Strong OB (Order Block): This is a large block of orders left behind by "Smart Money" and often serves as a strong support or resistance zone.
Location: The price range is from ~$3645 to ~$3655 USD.
Significance: This is the strongest support zone to consider for a long entry. The price is likely to pull back to this area, tap into the order block, and then bounce back up to continue the trend.
Additionally, there are two important liquidity zones to note:
Buy Side Liquidity ($$$): Located above the most recent high (~$3700 USD). The price has the potential to move up to sweep this liquidity.
Sell Side Liquidity ($$$): Located below the most recent low (~$3620 USD). This zone could be swept if there is a sharp market drop, but it's highly likely that the price will respect the bullish structure and not break this low.
Goldweeklyanalysis

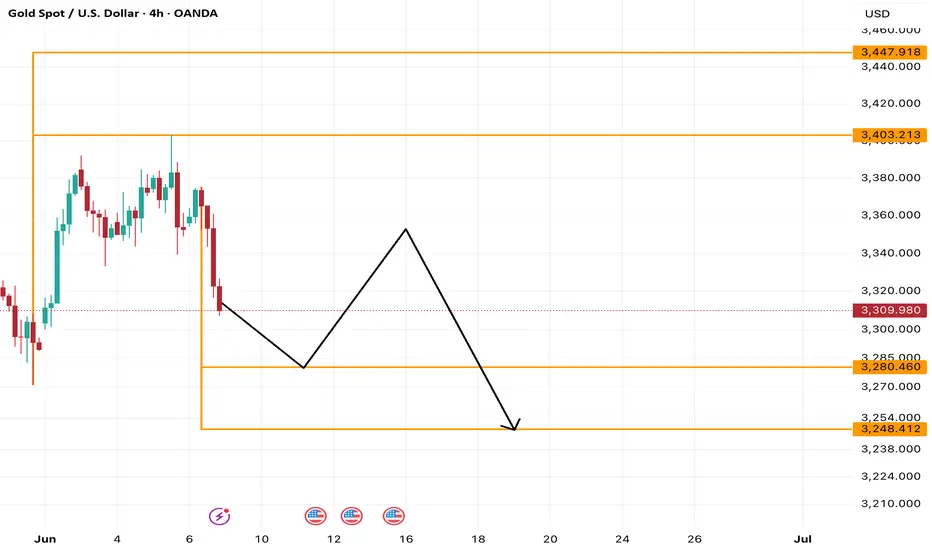
XAUUSD | Weekly Analysis for Week 9 - 13 June 2025Hi,
I am sharing my view on gold movement for coming week. It can go downside upto 3280 and 3248 levels.
Disclaimer: This is only for educational purpose.
Thanks
GOLD TRDAING POINT UPDATE >READ THE CHAPTIAN Buddy'S dear friend 👋
SMC Trading Signals Update 🗾🗺️ Gold Traders SMC-Trading Point update you on New technical analysis setup for Gold 🪙. Gold Traders Gold 🪙) weekly 1D 4H Time Frame Candle) update. Gold Gold weekly basis analysis setup. Close above. ) and close below)
Weekly Time Frame Candle close above 2887) NEXT targets 2956 ) 1D candle close below 👇 ⬇️ 2873 Next target 2788
weekly TFM
4 TFM
Key Resistance level 2888+ 2940 + 2956
Key Support level 2834 - 2788
Mr SMC Trading point
Pales support boost 🚀 analysis follow)

GOLD MCX FUTURES WEEKLY CHART ANALYSISWeekly Technical Analysis of Gold MCX Futures : -
As discuss in the previous week's Technical analysis,
Gold is following a strong bullish price action, with good volume followed by breakout on daily chart.
In last week our first 2 positional targets achieved. We are still into a bullish territory over the charts for gold.
