Granules - BreakoutGranules has give good breakout with volume and proper consolidation.
Above 520, we can see proper rally in the stock and good to hold for the long term.
Keep buying on every dip and wait for the next 3-6 months for the good returns.
GRANULES
Granules India Ltd – Breakout SetupGranules India is consolidating near a key resistance zone, trading above the 0.50 Fibonacci level . Price is holding strong and showing signs of a potential breakout with volume.
The stock remains in a clear uptrend , supported by strong financial performance in the last two quarters , which adds strength to the bullish structure.
Trade Plan:
- Buy: Around CMP ₹575 or on confirmed breakout
- Stop Loss: ₹565 (closing basis)
- Targets:
- ₹605
- ₹650
Targets are aligned with Fibonacci 0.50 & 0.61 levels.
Volume expansion will be the key trigger.

GRANULES: Hard to Ignore Trade Setup!⚡ Price Analysis:
1️⃣ Price structure is turning bullish.
2️⃣ Strong rejection candle formation near the support area, showing that the price is rejecting from lower levels.
3️⃣ Price needs to HOLD above 500 to continue the upmove
⭐ Key Observations:
➡️ Good Reversal Potential
➡️ Anticipating a strong trendline breakout to get more strength.
➡️ RRR is favourable.
⚠️ Disclaimer: This is NOT a buy/sell recommendation. For learning ONLY. Views are personal. Please, do your due diligence before investing.⚠️
🍀Cheers! 🔥

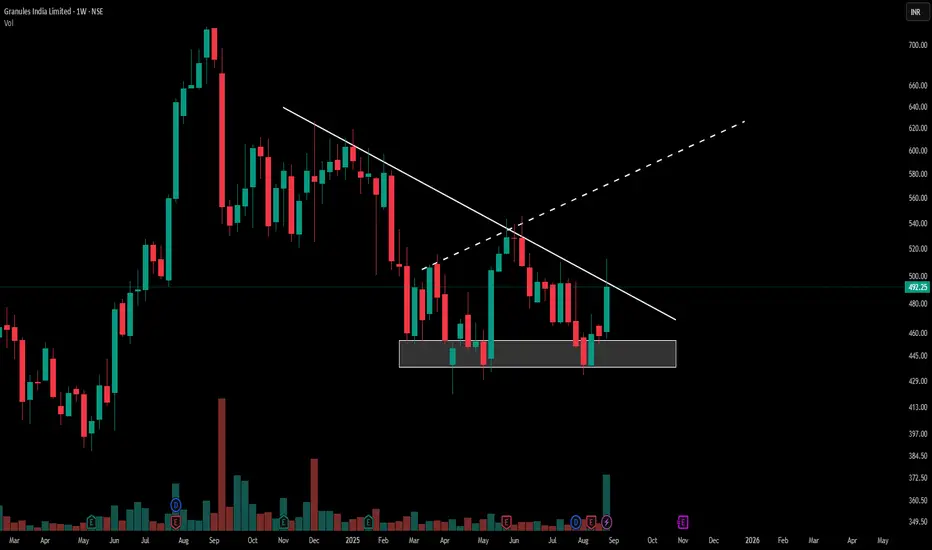
Granules India: Critical Descending TriangleGranules India Limited presents a descending triangle pattern on the weekly chart. The price has moved from the established support zone near ₹440-450 and is currently challenging the resistance trendline around ₹492.25. This movement appears with a marked increase in trading volume, highlighting the level where buyers and sellers are most active.
Pattern Character
A descending triangle pattern is identified by a series of lower highs against a stable support base. Granules India’s recent action displays persistence at support and upward momentum toward resistance. The volume expansion indicates notable participation during the current move.
Chart Observation
Price action above the triangle’s resistance can indicate a change in the prevailing sentiment if confirmed by continued volume. The current structure and market activity are being closely watched by participants for further development. No forecast or recommendation is made within this post.
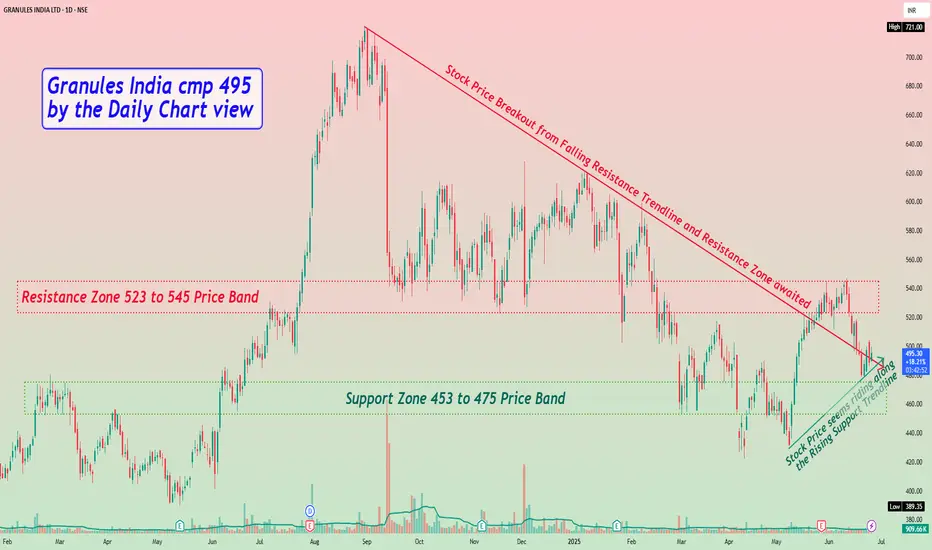
Granules India cmp 495 by the Daily Chart viewGranules India cmp 495 by the Daily Chart view
* Support Zone 453 to 475 Price Band
* Resistance Zone 523 to 545 Price Band
* Stock Price seems riding along Rising Support Trendline
* Stock Price Breakout from Falling Resistance Trendline and Resistance Zone awaited
* Stock has been attempting Breakout above Resistance Zone couple of times in June 2025 but has failed yet to make it
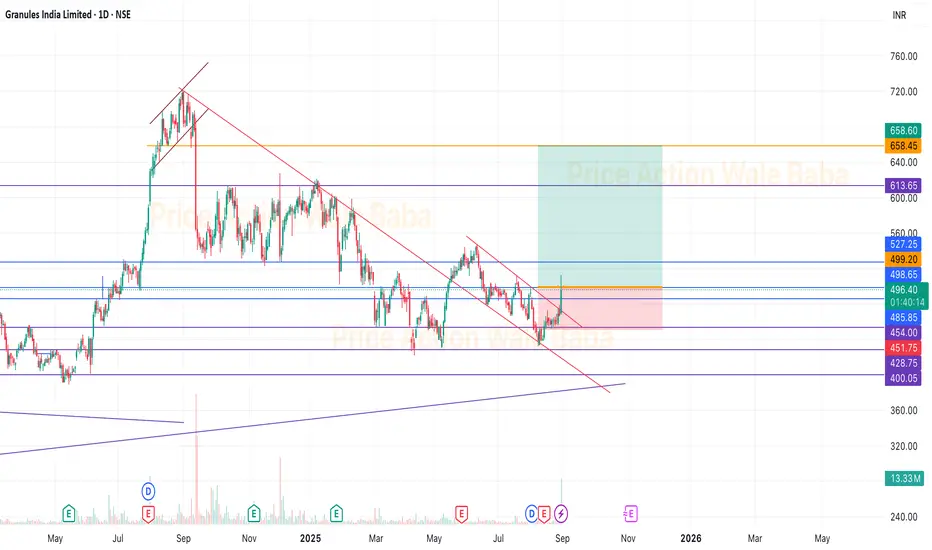
Granules - Double Bottom Breakout Double Bottom Breakout and Retest Done
Buy @ 495-497
SL 475
Target - 585
Resistance Trendline Breakout as well !!
Granules India cmp 605.00 by Daily Chart viewGranules India cmp 605.00 by Daily Chart view
- Support Zone 523 to 538 Price Band
- Stock Price seems riding along the Rising Support Trendline
- Stock seen consolidating in trading range 530 to 612 Price Band
- Stock Price below Falling Resistance Trendline awaiting a breakout
- Volumes seen subdued, below avg traded quantity, needed for a breakout

GRANULES DOUBLE BOTTOM BREAKOUTGranules breaking double bottom reversal pattern
with good volume building up
trading above 20ema
breaking 612 will give strength
#target 721,sl 530
NO BUY/SELL RECOMENDATION

Granules India for 35%+ gainsDate: 3 Oct’24
Stock: Granules
Timeframe: Daily chart
Granules India seems to have begun its up move in Wave V of 5 which could end around 810-820 (>35% from current price of 595) as seen in the chart. High volumes and strong reversal of RSI supports this stance.
This is not a trade recommendation. Please do your own analysis.
Aisa lagata hai ki Granules India ne 5 ke Wave V mein apni badhat shuroo kar dee hai, jo 810-820 (595 kee vartamaan keemat se 35%) ke aasapaas samaapt ho sakatee hai, jaisa ki chart mein dekh sakte hain. Achhi volume aur RSI ka majaboot ulataav is rukh ka samarthan karta hai.
Yeh koi vyaapaar ki rai nahin hai. Kripya apna vishleshan khud karein.

Granules, cup and handle patternGranules in perfect Cup and Handle Pattern
Volume low in cup formation and spiked on right side of the pattern.
Breakout of parallel channel is right time to enter
No buy/sell recommendation.

Short Trade setup in GranulesShort Trade Entered : Buy - GRANULES 30 May 2024 395.0 PE @ 11.15 Qty-2000
1. Today's breakdown candle confirms the break of structure.
2. The Downside range of 8 to 9% is now opened.
Disclaimer: This is my pre market analysis and my trading journal. Not a suggestion to buy or sell. Many times I do paper trades when the probability of a positive trade is less than 50%.

Breakdown of Descending Triangle Pattern. Today's Marubozu Candle confirms the breakdown of the triangle Pattern.
The next important level to consider is 365.

Granules India: Is It the Next Opportunity?- Is Granules India our next PFC contender?
- Similar move, pattern, and good strength observed.
- It's worth considering a speculative move.
- However, we must not risk everything.
- Our course of action:
1. Granules India's current market price is around 476.
2. We will Wait for today's closing, which should be above 474 to meet our bullish trade condition.
3. If the first condition is met, we'll buy above today's high, with today's low acting as a small stop loss.
- Due to the trade's riskiness, we'll manage quantity to mitigate risk.

Granules India: Breakout Confirmed, Long Opportunity EmergesAnalysis:
The chart of Granules India on TradingView suggests a promising breakout opportunity, potentially signaling a long entry chance for traders. Let's analyze the details based on the information provided on chart.
Current Price: ₹455.75, above the old year resistance level of ₹436.20 marked by the orange line.
Breakout Confirmation: The recent surge past the resistance zone, accompanied by strong volume, confirms a potential trend reversal from resistance to support.
Uptrend Momentum: The sustained price increase after the breakout indicates continuing buying pressure, hinting at further upside potential.
Trading Strategies:
Aggressive:
Enter long if the price closes and sustains above the current level (₹455.75) with continued buying volume.
Implement a stop-loss order below the breakout level (₹436.20) to manage risk.
Potential target prices could be ₹480 and ₹505 based on chart patterns and Fibonacci extensions
Conservative:
Wait for a potential pullback towards the breakout level (₹436.20) or within the previous consolidation zone (₹410-₹430) (highlighted in the image).
Enter long if the price finds support at the pullback zone and exhibits bullish reversal signs (e.g., hammer candlestick pattern).
Utilize a stop-loss order below the pullback low for effective risk management.
Additional Considerations:
The stock market is volatile, and breakouts can sometimes fail.
Conduct your own fundamental research to assess Granules India's financial health, industry outlook, and future prospects before making investment decisions.
Manage your risk effectively using stop-loss orders and appropriate position sizing.
Disclaimer: This analysis is for educational purposes only and should not be considered financial advice. Please do your own research before making any investment decisions.

GRANULES - Need to watch - wait for confirmationGRANULES -- All indicators are green, trading above all moving averages.
Reaching 439.5 - which is double top on the Weekly time frame.
If buyers step in to keep up the momentum, we should see 478 before any trend reversal. This is a 1.68 level and expects some retracement as per Elliott's wave theory.
Add to watchlist - wait for confirmation
Currently, CCI is also above 100 - note the same

GRANULES - Ichimoku Breakout📈 Stock Name - Granules India Limited
🌐 Ichimoku Cloud Setup:
1️⃣ Today's close is above the Conversion Line.
2️⃣ Future Kumo is Turning Bullish.
3️⃣ Chikou span is slanting upwards.
All these parameters are shouting BULLISH at the Current Market Price and even more bullishness anticipated AFTER crossing 432.
🚨 Disclaimer: This is not a Buy or Sell recommendation. It's for educational purposes and a guiding light to learn trading in the market.
#CloudTrading
#IchimokuCloud
#IchimokuFollowers
#Ichimokuexpert
Excited about this analysis? Share your thoughts in the comments below!
👍 Like, Share, and Subscribe for daily market insights! 🚀
#StockAnalysis #MarketWatch #TradingEducation

Granules, Short Strangle SetupToday the price has broken the support zone and Fib retracement level of 38.20%. Also, there is a good convergence in ema bands. The price could show the volatility of 5 to 6% in this range of Fib retracement levels of 330 to 315. On the breakdown of this range we got a clear short trade of 5 to 6%. If anybody wants to trade this range then the short strangle strategy will work best.
Hit the like button!!
Disclaimer: This is my pre market analysis and my trading journal. Not a suggestion to buy or sell. This material is for educational purposes.
Thanks
S. Simranjit Singh Virdi

Granules Demand ZoneThe short term group of ema's shows some contraction in ema's indicates a pause in the uptrend. The price will resume its trend on the breakout of 365. It could be a good opportunity for a fresh entry in the demand zone of 345 to 350 with a stoploss level 335.
Hit the like button!! Show some energy!!
Disclaimer: This is my pre market analysis and my trading journal. Not a suggestion to buy or sell.
Thanks
Er. Simranjit Singh Virdi

GRANULES - Bullish Momentum with VolumesNSE: GRANULES is closing with a bullish momentum candle supported with volumes.
Today's volumes and candlestick formation indicates strong demand and stock should move to previous swing highs in the coming days.
The stock has been moving along the horizontal support for the past few days which is indicating demand.
One can look for a 8% to 12% gain on deployed capital in this swing trade.
The view is to be discarded in the event of the stock breaking previous swing low.
#NSEindia #Trading #StockMarketindia #Tradingview #SwingTrade

GRANULESGRANULES:- Pole flag pattern showing wait for breakout
Hello traders,
As always, simple and neat charts so everyone can understand and not make it too complicated.
rest details mentioned in the chart.
will be posting more such ideas like this. Until that, like share and follow :)
check my other ideas to get to know about all the successful trades based on price action.
Thanks,
Ajay.
keep learning and keep earning.

Bottom Triangle has formedIn Granules after a period of uncertainty or consolidation, the price has recently hit a low point and has exhibited promising indications of a reversal. This is evident as the price has broken upwards, indicating a shift in market sentiment.
During this time, a pattern known as a Bottom Triangle has formed, characterized by two trendlines that converge. As prices reach lower highs and higher lows, it reflects a balancing act between buyers and sellers. This has resulted in a narrowing price range and diminishing trading volume, indicating market participants' uncertainty about the next direction.
However, before the triangle pattern reaches its apex (the point where the trendlines converge), there has been a notable breakthrough. The price has successfully surpassed the upper trendline with a significant increase in trading volume. This occurrence provides strong confirmation of a bullish reversal, suggesting a shift from the previous downtrend.
In summary, recent market conditions have demonstrated a potential reversal as the price has reached a bottom and subsequently broken upwards after a period of uncertainty or consolidation. This pattern is characterized by a Bottom Triangle, where two trendlines converge while the price forms lower highs and higher lows. As the price breaks above the upper trendline with increased trading volume, it signifies a bullish reversal, marking a shift from the prior downtrend.
Note for everyone who came across this reference:
This chart analysis is only for reference purpose.
This is not buying or selling recommendations.
I am not SEBI registered.
Please consult your financial advisor before taking any trade.

Buy Intraday Positional GranulesBuy Intraday Positional Granules Near 280
Sl 275 Closing Basis
Target 290 & 300

Granules || Bullish View Up TrendGranules View Looks Bullish, breaking the trend line. Setting the targets 315 to 325.
#Granules
#Uptrend
#Bullish
