GRASIM

GRASIM - Inverted bullish hammer at dynamic supportNote: This is for educational purpose only.
21 EMA seems to act as dynamic support. Moreover, 21 EMA is above 55 EMA which indicates short term bullish momentum. RSI at 58 is nearing bullish momentum. There seems to be a inverted bullish hammer at dynamic support.

Stock analysis of Grasim Ltd.Price - ₹778.35 Dt. - 31-10-2020
As discussed earlier on the weekly chart that the stock is in the continuous downtrend from a few years but recently last month the stock broke the streak and started moving upward. looking at the historical daily chart we can conclude that stock can give buy and sell signal through 50DEMA and 21DEMA. But observing carefully if we follow the 50DEMA for buy and sell then we will end up with only 2-4% profit, but if we follow the approach of buying at 50DEMA and selling the stock when it breaks the 21DEMA line then we can roughly generate the profit of 8-10%.
In the current scenario, the stock took the support of 21DEMA and started moving up but the price will face resistance at 806.40, which can generate roughly only 2-3% profit. Buy signal will only activate if the stock sustains above the 806.40 level or the price takes the support of 50DEMA, whichever is first.
RSI is neutral whereas the MACD has given the sell signal.

Grasim Short Term Trading Analysisa. Zone: Strong Bear
b. Resistance 1: 784
c. Resistance 2: 789.55
d. Support 1: 767.25
e. Support 2: 764.50
NSE:GRASIM


Grasim | big volume | Weekly Analysis Buy setup
1st target = 834.50
2nd target = 925.95
lot size = 950
LIKE & FOLLOW for more amazing idea
Don't forget to check out related ideas


Swing + Intraday Setup: Looks good above 767 for 780/790/800Swing + Intraday Setup: Looks good above 767 for 780/790/800. SL can be 760.
Note: I am not a SEBI register and view is only for educational purpose as well as personal, always consult your financial advisor before investing or trading.


GRASIM 🔻 - Still looks NegativeGrasim after a strong impulsive move from 774 -742 ,
Yesterday It is with in 38% Range formed flat irregular,
Expect another strong down move to 725-720.(approx, even more)
Note : ( ~ ) 👈 approximate value


shortShort Grasim on rise around 750 sl 766 target 725-710-698
Disc : It's not an advice to buy or sell

Grasim is standing on resistance levelGrasim is stading on a resistance level if crosses this hurdle, it will give you quick target of 800


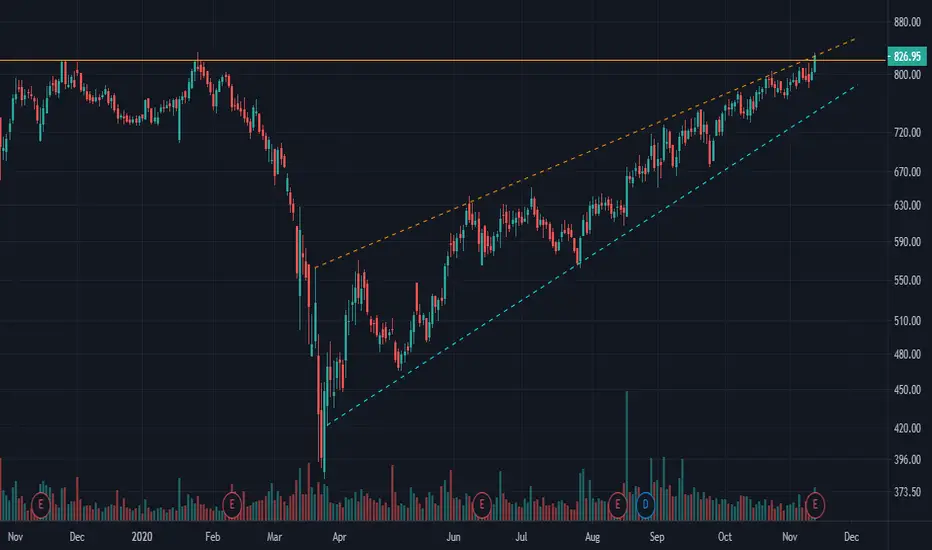
Investment Idea - GrasimChannel breakout.
Add in dips until 650.
Hold for 1+ year, targets are around 1300.
Have patiance and hold for long term. First target 1000 then 1300.


GRASIM - BREAKOUT ABOVE A STRONG RESISTANCE - BULLISHLook at the charts and make an informed decision.
Thank You
Happy Trading
Beware of risk involved in stock market and this is for educational purpose only.

GRASIM BROKE ITS VERY IMP LEVEL MORE HIGHER HIGH CAN BE SEENGrasim looking strong as it broke its long term trendline and currently trading above it. In previous day session it broke an imp level. On high time frame, it is also looking decent for long term buy. All imp levels are marked on charts.
fresh buying only is recommeded if trades above PGH and sustains.
In previous idea


GRASIM is Making Ascending Triangle Pattern (Breakout Trade)Grasim Industries Limited : Textile Industry Company ( NSE:GRASIM ) is Making Ascending Triangle Pattern (PATTERN BREAKOUT TRADE).
This can become a very good trade for INTRADAY traders.
Target + StopLoss: There is no target here. You keep the first target as much as the StopLoss you put. And the StopLoss will be the Low/High of the candle that broke this pattern. Or Low/High swing backward inside the pattern.
And as soon as you get a profit of 0.50% of your target, you will trail your StopLoss and bring it to the entry point. And as soon as your first target is hit, you will release half of your total quantity and continue to trail your StopLoss above the last swing Low/High.
Target and StopLoss are never already fixed in the chart pattern.
Thank you.
You always have to trade only by money management, position sizing, StopLoss trailing. This is the way to stay in profit.
Chart Published By Ravinder Sharma

Bought GRASIM ---- Volume & Resistance Breakout i was banned for violating house rule so i am republishing again without any alteration
Bought @ 667.90
target @ 733.25
lot size = 950
points gain = 66
