GRASIM | SHORT TERM CHANNELIt may fall up to its weekly support. Its better to short whenever it touches its high level of channel.
GRASIM

Grasim Short Term Trading Analysisa. Zone: Strong Bear
b. Resistance 1: 717.60
c. Resistance 2: 723.60
d. Support 1: 693.45
e. Support 2: 663.30
NSE:GRASIM

Grasim share to take long entryGrasim stock in all TFs are in uptrend & forming the higher highs. Now after the level of 630 we have seen good BO , Now again stock is trading in the range . Long entry can be taken above the level of 688 for the target of 710 with the SL of 672. Positive divergence has also seen in the charts. So add the stock in your chart to see the price action movement of the stock.
Always do trading as per your Reward to Risk ratio means Never risk more than you can afford to lose on a single trade. Please keep patience & wait for the levels means Sit and wait for the right opportunity. Request to like & follow for more such ideas of technical analysis learning.The idea sharing is for educational purpose only. In case any suggestion advice required feel free to ask.

InvestmentLooks good for long... as it crossed 200ema with strength, marked range is very good for long.


Grasim Breakout Swing BuyEarlier idea was shared on 06 Aug for Swing Buy if (645-650) breaks. But breakout came yesterday with good volume. Buy for swing in any dip near 655 for target 680, 730

Grasim longGrasim is forming a cup and handle pattern
Wait for closing above 650 and go long for higher targets 670/690/710

Grasim Short I hope you can now see how Grasim represents an excellent low risk profit entry setup allowing you to trade in the market.Take positions so that the risk/reward is in your favor.
Knowing why, where & when a strong reversal signal is being generated will be the only way to capitalize on your technical analysis .
Disclaimer: It should not be assumed that the methods, techniques, or indicators presented in these chart will be profitable or that they will not result in losses. There is no assurance that the strategies and methods presented will be successful for you. Past results are not necessarily indicative of future results. You should not trade with money that you cannot afford to lose. Example presented in these chart is for educational purposes only and it should not be assumed that these are indicative of ordinary trades. These setups are not solicitations of any order to buy or sell. The publisher assume no responsibility for your trading results. There is a high degree of risk in trading.

GRASIM Short at 634 , AT Resistance levelI will SHORT on GRASIM because:
1) The price is under Support/Resistance zone.
2) It has touched the resistance and may reach the support zone .
3) Target would be the Support area . Book profit when it reaches its support .
4) The price is also forming a Chanel or Rectangle Pattern .

#GRASIM - 4 hour chart bearishGRASIM - Bearish setup
4 hour chart analysis
Harmonics Pattern
Hope my Chart Helps !!!!


Grasim - ABCD + 200 DEMA A good buy at CMP (or dips) for targets of 640, 645.
A close above 646 (200 DEMA & Long term support/resistance) on Hourly chart can open higher targets too!


700 coming soon for grasimFor intraday traders, levels are given, it will reach 700 in coming days but remember there will be a small retracement or profit taking session in between but the overall sentiment is bullish. BUY ABOVE 640 WITH A TARGET OF 680 FOR WEEKLY POSITIONAL TRADES.


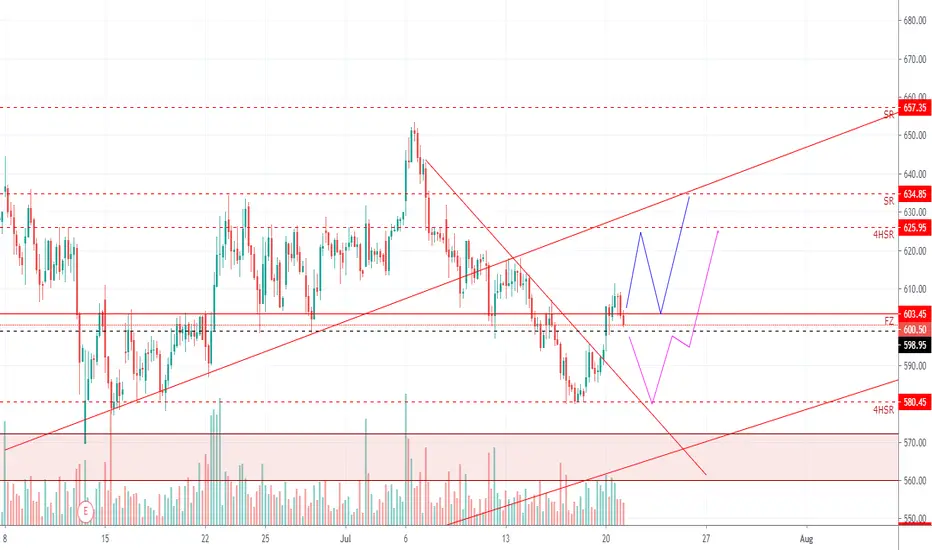
Grasim Industries - Positional buy above 598.80Grasim Industries - Positional buy above 598.80, Target - 617 & above , SL-580.

GRASIM TREND ANALYSISTrade with the trend, place your targets and stop loss according to support and resistance drawn.

Grasim share to take long entryonce again we can take the long entry above the level of 610 in Grasim stock. In daily chart the trend line has been broken & the stock trading around the 20 EMA Level & can see more strength in the stock for the target level of 630 & 645 level . So add the stock in your watch list to see the price action movement in the stock.
Always do trading as per your Reward to Risk ratio means Never risk more than you can afford to lose on a single trade. Please keep patience & wait for the levels means Sit and wait for the right opportunity. Request to like & follow for more such ideas of technical analysis learning.The idea sharing is for educational purpose only. In case any suggestion advice required feel free to ask .

GRASIM1) if opens flat , go for long ion buillish signals
2) if gap down , wait for it to take support and then go long
GRASIM BUY AND SELL LEVELSGRASIM BUY ABOVE 596
TARGET: 599, 603, 606
GRASIM SELL BELOW 590
TARGET: 587, 584, 581
Posting for Educational purpose only
If my analysis appears OK then please LIKE, FOLLOW and SHARE to get more future ideas
