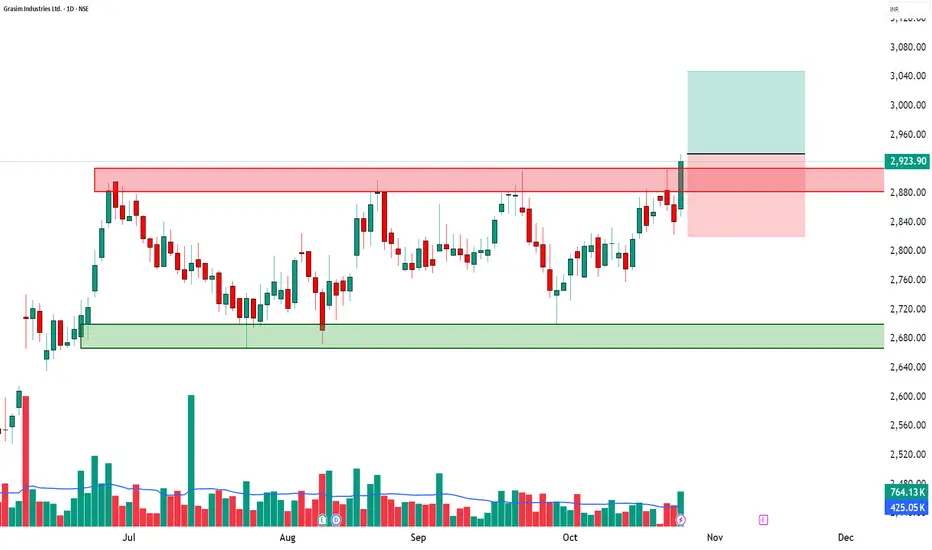
GRASIM | 52-Week Breakout + RSI Surge + High Volume📈 GRASIM | 52-Week Breakout + RSI Surge + High Volume Confirmation 🚀
🔹 Entry Zone: ₹2,923.90 – ₹2,934.00
🔹 Stop Loss: ₹2,820.45 (Risk ~113 pts)
🔹 Supports: 2,869.67 / 2,815.43 / 2,783.27
🔹 Resistances: 2,956.07 / 2,988.23 / 3,042.47
🔹 Swing Demand Zone: ₹2,787 – ₹2,764.50
🔑 Key Highlights
✅ 52-Week Breakout – strong confirmation of bullish momentum continuation
✅ RSI Breakout – trend acceleration backed by strength
✅ Bollinger Band Expansion – volatility breakout indicates fresh momentum
✅ VWAP Alignment – buyers maintaining control across sessions
✅ Volume Spike (1.8x avg) – institutional buying and strong follow-up interest
🎯 STWP Trade View
📊 Momentum favors continued bullish strength. Sustaining above ₹2,956 could extend the move toward ₹2,988–₹3,042 levels.
⚠️ The ₹2,787–₹2,764 zone acts as a key swing base where accumulation is likely to continue if prices retest.
💡 Learning Note
This setup demonstrates how a 52-week breakout with RSI and VWAP confirmation can mark a major trend continuation point. Volume expansion adds conviction, making such setups ideal for momentum-based swing trades.
Final Outlook: Momentum: Strong | Trend: Bullish | Risk: Low | Volume: High
________________________________________
________________________________________
⚠️ Disclosure & Disclaimer – Please Read Carefully
The information shared here is meant purely for learning and awareness. It is not a buy or sell recommendation and should not be taken as investment advice. I am not a SEBI-registered investment adviser, and all views expressed are based on personal study, chart patterns, and publicly available market data.
Trading—whether in stocks or options—carries risk. Markets can move unexpectedly, and losses can sometimes exceed the money you have invested. Past performance or past setups do not guarantee future results.
If you are a beginner, treat this as a guide to understand how the market works and practice on paper trades before risking real money. If you are experienced, always assess your own risk, position sizing, and strategy suitability before entering trades.
Consult a SEBI-registered financial adviser before making any real trading decision. By engaging with this content, you acknowledge full responsibility for your trades and investments.
Position Status: No active position in GRASIM at the time of analysis.
Data Source: TradingView & NSE India (Past Chart Reference) (Historical levels)
💬 Found this useful?
🔼 Give this post a Boost to help more traders discover clean, structured learning.
✍️ Drop your thoughts, questions, or setups in the comments — let’s grow together!
🔁 Share with fellow traders and beginners to spread awareness.
👉 “If you liked this breakdown, follow for more clean, structured setups with discipline at the core.”
🚀 Stay Calm. Stay Clean. Trade With Patience.
Trade Smart | Learn Zones | Be Self-Reliant 📊
Grasimanalysis
Grasim Looing GoodGrasim Was running under pressure in past many years and a year ago it gave a quite good breakout but still it was in the range for a whole year and finally we can see that the with the good quarterly results it gave breakout..
Fundamentally we can see the increasing capex in the budget and which will help to infrastructure development and that is why the Grasim Sales book looking attractive in the long run ...
Educational purpose only....

DIWALI PICKS (GRASIM)DIWALI PICS OF STOCKS
Buying near the1917-1940
Stoploss 1840-30
TGT 2500/2700/3000++
Holding period more than a year

Long Setup in Grasim IndustriesAn On Neck Chart Pattern Breakout happened on the Daily Time frame of NSE:GRASIM
Price Action is well supported by the volume.
The stock is currently in uptrend making higher highs and higher lows.
One can add this stock into their stocks to buy list.
Initiate the long trade only according to the levels mentioned.
Stop loss will be on a Daily closing basis.
Trend Analysis :- UP Trend
Chart Pattern :- Bullish On-Neck Chart Pattern
Technical Indicator :- Positive MACD Crossover

Grasim BreakoutGrasim Cmp 1819.65
Buy At Cmp & On Dips
SL - 1668 ( Day Closing Basis )
Target - 1950/2000

Grasim Flag Pattern 1 hour Flag Pattern observed in Grasim 1 hour TF
If breakout is confirmed, Target 1945

Grasim Long entry in 1hr Time FrameCup and handle pattern formation in Grasim 1hr Time Frame chart and Inverse Head and shoulder pattern and small consolidation,
Higher Time frame trend also looks strong, if 1hr candle closes above 1775 then it can go for 1820 levels,
if it continue and break 1850 levels then we can see 1900 level in very short time.
(this cup pattern sits with inverse head and shoulder patter in daily time frame)
--Educational purpose only.

Grasim - Cup and Handle formationGrasim is forming a cup and handle pattern on the daily charts and once it breaks the 1830 levels (which is a main pivot level as it forms the ends of the cup), a significant up move can be expected. Given that the RSI is also crossing 60, breaching of the 1830 levels can be expected in the next 1-2 days.
Following the breach, the first major resistance will be at the 1890-1900 level, which is close to the all time high and also matches the 0.5 level of trend based fib extension. Hence this can be considered the 1st target and 0.786 and 1 levels considered T2 and T3 respectively

GRASIM INTRADAY STOCK TRADING PROFITKINDLY SWITCH TO 5MIN TIME-FRAME
Used my Analysis on 15min chart. Traded on 5min Time-frame.
After Breaking of Resistance waited for pullback then entered.
Profit Booked 1:4
Keep following Liking I will give trading setup on weekend.

Trendline Breakout in GRASIMTrendline Breakout is observed in Grasim Future, Stock is trading in momentum. Today Up by 2.5% with volumes. We expected stock to head higher from current levels, We are buying Grasim future for the Targets of 1750 with Stoploss of 1620

Grasim Chart Analysis !!📈 Grasim Industries 📉
This Stock Broke out from a resistance zone of 1600-1630 which was acting as a support also Oct, Nov and Dec 2021 and today managed to close above it.
Bias - Long
Target - 1778, 1920
SL - 1556
RR- 1 : 2.5
All Important Supports and Resistances are drawn in chart. All levels are on closing basis.
Please have a look and revert back if you need some more study on it.
Disclaimer : Consult Your Financial Advisor Before Taking Any Decision On This Analysis.

GRASIM INDUSTRIES MID-TERM SWING TRADE!Hi everyone, Grasim industries mid term swing trade consider buy above: 1,790, targets: 1,894/1,965/2,080, stoploss: 1,722.
LOGIC BEHIND TRADE: Stock on daily chart has formed (W) pattern & near it`s resistance if breaks next resistance will be all time high above (ATH) on weekly chart (harmonic xabcd pattern level 1.618) will be activate & target will be 2,080. Stoploss is taken low of resistance candle. NSE:GRASIM

Grasim looks bullish after 1878.Grasim on a weekly and daily time frame looks bullish once it crosses and closes above 1878 level.
It can test it's ATH and make new high in the coming week.
On Fibonacci retrenchment level target can be 197,2016 and 2077.
Wait for the breakout.

GRASIM: H&S Bearish for short termStock has broken the neckline of H&S pattern at 1680 & retested the neckline. One should go short with SL of 1680 & look for the target of 1540/1470

Simple Trade Setup | GRASIM | 14-12-2021 [ INTRADAY ]NSE:GRASIM
Observations:
1) On 1day time frame,it managed to sustain above 50DMA.
If it take support from 50DMA and trades above it then we can see an up move.
50DMA is placed at 1729.64 level.
Please refer below chart : 1day Time Frame.
2) Also On 1day time frame, it made double bottom pattern and sustain above the mid neckline of it.
Major breakout level range is 1360-1370 level range.
Please refer below chart : 1day Time Frame.
-------------------------------------
Trade Setup for Date: 14-12-2021
1) Don't Jump in to trade at the beginning of the market. Let it get settle for 15-20min first and judge the price action.
2) Everything is mentioned on the chart. I hope it is easy to understand.
3) All the levels will work as support, resistance, entry and exit w.r.t price action near that level.
4) Avoid gap up or gap down chase. Wait and trade between levels.
Please refer below chart for levels.
Hope I made it easy to understand it.
Do comment your doubt or suggestion.
Note: Trade with Strict SL. It may or may not hit all the levels. So one can book profit / loss at respective level considering how price action works near that level.

NSE:GRASIM LongNSE:GRASIM
#GRASIM give BO @ 1780 levels and close above the levels, sustainability have good up side momentum.
Post confirmation may try 1780 CE
Happy Trading !!

grasim longfollow up...taken support today at neckline. todays low is sl for positional one can go with days low as sl tgt new 52 week high.

grasimNSE: GRASIM 1745
-Fresh Up move After Retest
- Price and Volume Both Confirms The up move
-Next level to watch 1799
-Support near 1680-1640

What next in Grasim ? Positional Trade NSE:GRASIM
Grasim followed Fib retracement perfectly. As per given in my previous idea it took good support from 61.8% level range.
Please refer below chart.
Now what next?
Just simply if we apply the same level range of FIb retracement then we can see below levels.
This levels will be for short to mid term positional trade.
Sustainable Breakout of 1700 level will lead it to 1759 easily and we can see 1800 level in mid term positional long trade.
Please refer below chart.
you can also refer my previous idea of Grasim in Link section at the end of this idea.

Simple Trade Setup | GRASIM| 11-10-2021 [Intraday & positional]NSE:GRASIM
Observations:
1) On 1 day time frame, if we apply fib retracement for recent swing from low to high we can see that it is just above 61.80% level of FIB Retracement and level of 1590-1591 will work as good support now.
Please refer below chart : 1day Time Frame.
-------------------------------------
One can enter for positional trade from CMP with Strict SL of 1580 for the up side target of 1700 in short/mid term.
But Safe positional buy trade entry will be once it maintain to close above 1620 level sustainably.
-------------------------------------
Trade Setup for Date 11-10-2021:
1) Don't Jump in to trade at the beginning of the market. Let it get settle for 15-20min first and judge the price action.
2) Everything is mentioned on the chart. I hope it is easy to understand.
3) All the levels will work as support, resistance, entry and exit w.r.t price action near that level.
4) Avoid gap up or gap down chase. Wait and trade between levels.
Please refer below chart for levels.
Hope I made it easy to understand it.
Do comment your doubt or suggestion.
Note: Trade with Strict SL. It may or may not hit all the levels. So one can book profit / loss at respsective level considering how price action works near that level.

Simple Trade Setup | 27-09-2021 | GRASIM [Intraday & positional]NSE:GRASIM
Observations:
1) One 1 hr time frame,It made inverse head and shoulder pattern and given breakout of it on 24-09-2021. And it closed above the neckline of it.
Please refer below chart : 1 hr time frame.
-------------------------------------
For Positional Trade for short-mid term target on long side will be 1700- 1720 - 1750. SL will be 1580.
Major resistant at 1660 level.
-------------------------------------
Trade Setup for Date 27-09-2021:
1) Don't Jump in to trade at the beginning of the market. Let it get settle for 15-20min first and judge the price action.
2) Everything is mentioned on the chart. I hope it is easy to understand.
3) All the levels will work as support, resistance, entry and exit w.r.t price action near that level.
4) Avoid gap up or gap down chase. Wait and trade between levels.
Please refer below chart for levels.
Hope I made it easy to understand it.
Do comment your doubt or suggestion.
Note: Trade with Strict SL. It may or may not hit all the levels. So one can book profit / loss at respsective level considering how price action works near that level.

GRASIM cup & handleNSE:GRASIM
GRASIM forming CUP and Handle Patter.
if it sustain above 1617. we can see good move soon

Grasim AnalysisGrasim has given a breakout at the level 1620
It may retest the support downwards around 50 EMA or from the trend line. It can also take the support from the breakout level, but will definitely hit the target
Traget :- 1800
