Explosive Volume Breakout StocksHello Traders! Today’s session was packed with action as several midcap names showed explosive breakouts on record volumes. These setups are not only backed by price action but also confirmed by multiple technical indicators such as RSI, Bollinger Bands, SuperTrend, VWAP, and BB Squeeze. Let’s decode them in detail 👇
1️ Greenpanel Industries Ltd (NSE: GREENPANEL)
CMP: ₹322.15 (+18.09%)
Breakout with Heavy Volumes
Key Supports: ₹288 / ₹254
Resistances: ₹341 / ₹361 / ₹395
🔑 Strong 52-week breakout with bullish follow-through. Sustaining above ₹288 could keep the momentum alive.
The stock witnessed a 52-week volume breakout, supported by a strong bullish candle that confirms aggressive buying interest. The RSI has broken out, highlighting fresh momentum, while the Bollinger Band breakout shows volatility expansion after a period of consolidation. Alongside this, the Bullish SuperTrend and VWAP indicators confirm trend alignment with volume, suggesting institutional participation. Interestingly, the BB Squeeze turning off signals that the low-volatility phase has ended, and the stock may now enter a trending move.
________________________________________
2️ Indoco Remedies Ltd (NSE: INDOCO)
CMP: ₹308.60 (+11.47%)
RSI Breakout + Volume Expansion
Key Supports: ₹280 / ₹252
Resistances: ₹334 / ₹360 / ₹388
🔑 Open = Low + strong bullish candle. Short-term traders may keep an eye on ₹280 as support.
Indoco Remedies also recorded a powerful 52-week volume breakout, signaling accumulation at higher levels. The RSI breakout validates the momentum shift, while the “open = low” pattern reflects intraday buying from the very start of the session. The Bollinger Band breakout points to volatility expansion, and the Bullish SuperTrend along with VWAP confirms that both trend and volume are favoring the bulls. Additionally, the BB Squeeze compression breakout shows that the stock has just moved out of a tight consolidation, opening the doors for a strong upside continuation.
________________________________________
3️ Piccadilly Agro Industries Ltd (NSE: PICCADIL)
CMP: ₹723.80 (-13.58%)
Strong Bullish Candle on Massive Volumes
Key Supports: ₹660 / ₹598
Resistances: ₹765 / ₹806 / ₹869
🔑 Despite closing off highs, volumes indicate institutional interest. Watch ₹660 as a key level.
Piccadilly Agro displayed a strong bullish candle backed by exceptional volumes, which suggests fresh interest from market participants. The RSI breakout supports the strength of the momentum, while the Bollinger Band breakout indicates that the stock has entered a new volatility phase. Both Bullish SuperTrend and VWAP confirm that the price move is well-supported by trend-following and volume-based systems. With the BB Squeeze off, the compression phase has ended, further confirming the possibility of an extended rally if key supports hold.
________________________________________
4️ SMS Pharmaceuticals Ltd (NSE: SMSPHARMA)
CMP: ₹300.55 (+12.14%)
52-Week Volume Breakout
Key Supports: ₹273 / ₹247
Resistances: ₹319 / ₹339 / ₹365
🔑 Stock showing bullish momentum with multiple indicator confirmations. A close above ₹319 may trigger the next leg.
SMS Pharma registered a 52-week volume breakout combined with short-term bullish momentum, indicating a strong change in trend. The RSI breakout highlights renewed momentum, and the Bollinger Band expansion reflects volatility returning after consolidation. The Bullish SuperTrend and VWAP are both in sync with the buyers, suggesting sustainable strength. The BB Squeeze turning off is another confirmation that the quiet phase is over, and the stock could witness directional movement. Overall, multiple indicators align to suggest that this breakout has solid backing from both price and volume action.
________________________________________
💡 Technical Takeaway:
When volume expansion aligns with RSI, Bollinger Bands, and SuperTrend confirmations, breakouts have higher chances of sustaining. Always track key support levels for validation.
⚠️ Disclaimer – Please Read Carefully
The information shared here is meant purely for learning and awareness. It is not a buy or sell recommendation and should not be taken as investment advice. I am not a SEBI-registered investment advisor, and all views expressed are based on personal study, chart patterns, and publicly available market data.
Trading — whether in stocks or options — carries risk. Markets can move unexpectedly, and losses can sometimes exceed the money you have invested. Past performance or past setups do not guarantee future results.
If you are a beginner, treat this as a guide to understand how the market works — practice on paper trades before risking real money. If you are experienced, always assess your own risk, position sizing, and strategy suitability before entering trades.
Consult a SEBI-registered financial advisor before making any real trading decision. By engaging with this content, you acknowledge full responsibility for your trades and investments.
💬 Found this useful?
🔼 Give this post a Boost to help more traders discover clean, structured learning.
✍️ Drop your thoughts, questions, or setups in the comments — let’s grow together!
🔁 Share with fellow traders and beginners to spread awareness.
👉 “If you liked this breakdown, follow for more clean, structured setups with discipline at the core.”
🚀 Stay Calm. Stay Clean. Trade With Patience.
Trade Smart | Learn Zones | Be Self-Reliant 📊
GREENPANEL
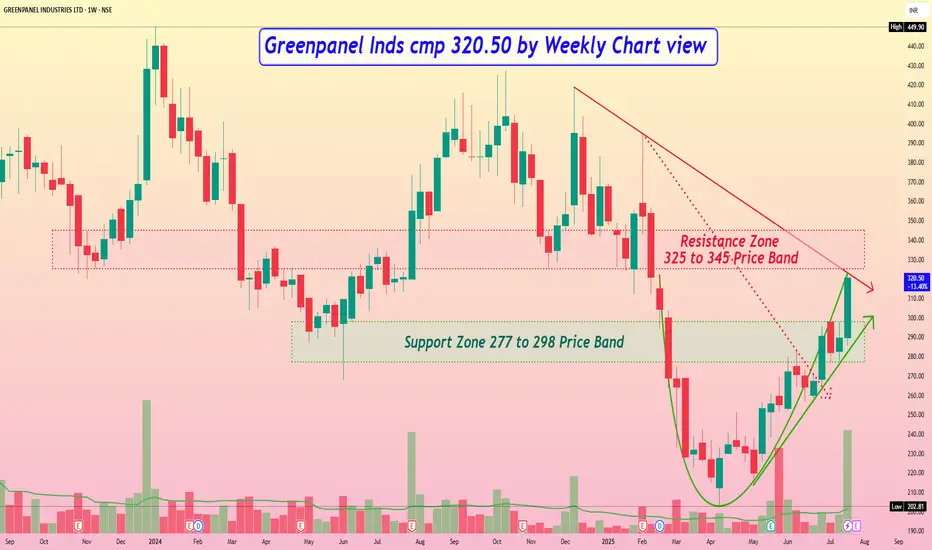
Greenpanel Inds cmp 320.50 by Weekly Chart viewGreenpanel Inds cmp 320.50 by Weekly Chart view
- Support Zone 277 to 298 Price Band
- Resistance Zone 325 to 345 Price Band
- Bullish Rounding Bottom with Resistance Zone neckline
- Rising Support Trendline seems well respected by price momentum
- Volumes have surged very heavily over past week by demand based buying
- 1st Falling Resistance Trendline Brake out done and 2nd Trendline Breakout attempted
- Most common Technical Indicators like BB, EMA, MACD, RSI, SAR are showing positive trend
Greenpanel Inds cmp 398.15 by Monthly Chart view since listedGreenpanel Inds cmp 398.15 by Monthly Chart view since listed
* Support Zone at 255 to 270 Price Band
* Resistance Zone seen at 420 to 450 Price Band
* Weekly basis : Support at 355 > 298 > 255 with Resistance at 450 > 505 > 565
* Bullish Rounding Bottoms is been repeated and 2nd is in completion stage at Resistance Zone
* Volumes are gradually rising month over month as observed through past 7+ odd months now

GREENPANEL Buy Above 405"Delivery Idea 22-01-24
GREENPANEL (CMP: 393.3)
Buy Above: 405
SL Below: 380
Target: 455"
Stock has Swing BO on Dated 28-12-2023. Now Same level has retest and take Support at Swing High.
If Stock again Move Back on 20-01-2024 High, then take Entry.
Disclaimer: Content shared through our digital media channels are for information and education purposes only and should not be treated as investment or trading advice. Please do your own analysis or take independent professional financial advice before making any investments based on your own personal circumstances. Investment in securities are subject to market risks, please carry out your due diligence before investing. And last but not the least, past performance is not indicative of future returns.

GREENPANEL The stock was falling from last few months and now it is trying to hold above the support area. above 350 we can expect a rally.

Greenpanel can bring greenery in portfolio!Trade logic:
Simple horizontal level resistance breakout of 400 which is also the neckline of Cup and Handle pattern.
Levels mentioned on chart. Stock has consolidated since long. We can expect quick upmove.

Can GREENPANEL climb up the HILL ?- Company has reduced debt.
- Company has delivered good profit growth of 451% CAGR over last 5 years
Greenpanel Industries Limited is engaged in the manufacturing of plywood, medium density fibre boards (MDF) and allied products.
It enjoys a leadership position with a 27% market share in the organized MDF segment.


Greenpanel Industries- Consolidating nicely after the initial impulsive move
- A move above 300 can trigger a rally to 325 and higher
- The demand zone is the most optimal long entry imho but I highly doubt that we will tumble that low, considering the strength of the initial move.
Disclaimer: This is NOT investment advice. This post is meant for learning purposes only. Invest your capital at your own risk.

GREENPANELGREENPANEL:- Stock has formed cup and handle pattern on hourly chart, keep an eye.
Hello traders,
As always, simple and neat charts so everyone can understand and not make it too complicated.
rest details mentioned in the chart.
will be posting more such ideas like this. Until that, like share and follow :)
check my other ideas to get to know about all the successful trades based on price action.
Thanks,
Ajay.
keep learning and keep earning.

Buy Limit 359.4/- Greenpanel Very good bearish pattern formed in daily timeframe. personally love to buy current market price 359.40/-


Greenpanel....longThe stock has given a sharp upmove. Once it crosses the resistance of 557 it will move further up.The RSi is above 60 and the targets are shown on chart.

Entry available in Trending Stock!!!!As, the title says entry available in trending stock GREENPANEL, yes as the chart shows
whenever it takes support on 20 weekly moving average it makes new high after which it shows
it's rocket move.
And, now is that time to enter for rocket move also MACD histogram has turn positive which indicates
the up move pending in near future.


Green Panel Bullish SetupGreen Panel Bullish Setup : High volume with great qtr result. SL is very tight so, Risk to reward is good.

flag pattern - high bullish opportunity - GREENPANEL🔴DISCLAIMER
***** It's just for an educational purpose and so you must also follow your own technical analysis before taking up the trade ******
Aggressive traders enter at the breakout and conservative traders may give entry after retracement (Retracement is optional, we cannot expect every stock to take a retest after the breakout, it may also continue to have its bullish pressure after the breakout)
After reaching our targets, trail your stop loss to get maximum profit from the stock in a single trade
Comments

Green Panel 30% Gain Chance, with Strong SupportStock: NSE:GREENPANEL
Timeframe: 30-60 days
Reasons to Buy:
1. Support at 61.8% Fibonacci Level, for the second time.
2. Support at the bottom of trendline.
3. Monthly and Weekly RSI are above 60, with strong uptrend.
4. Low Risk, High Reward.
Let me know your thoughts!

