Bullish Harami Pattern: Spotting Reversals with DisciplineIntro / Overview
The Bullish Harami is a candlestick reversal pattern that often forms at the end of a downtrend.
It signals a possible shift where sellers weaken and buyers begin to step in.
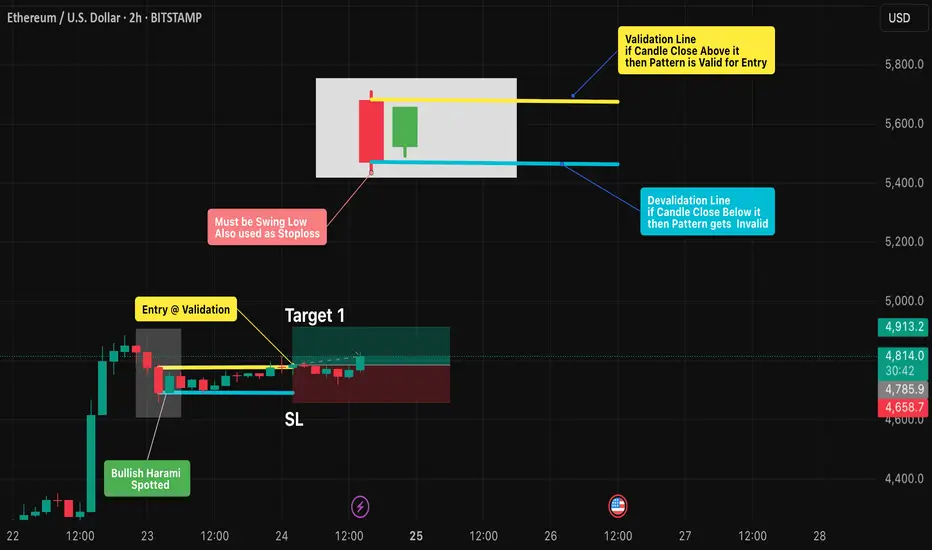
The first candle’s low must be a swing low , and this level can also be used as a stop-loss reference.
To trade it effectively, spotting the formation is not enough — strict validation and invalidation rules are key to avoid false signals.
✨ Concept
A Bullish Harami is a two-candle pattern:
- First candle (Red🔴): A strong bearish candle showing seller dominance (swing low).
- Second candle (Green🟢): A smaller bullish candle whose body is fully inside the prior red candle’s body (wicks ideally inside).
This forms the “harami” structure, where the green candle looks like it is “inside the red candle,” suggesting a pause in bearish pressure and potential reversal.
📖 How to Use
1️⃣ Identify the pattern: Look for a large red candle followed by a smaller green candle contained within it.
2️⃣ Validation Point: The setup is validated if price closes above the open of the red candle within the next few candles.
3️⃣ Invalidation Point: The setup is invalidated if price closes below the close of the red candle before validation occurs.
4️⃣ Stop-Loss & Targets:
- Stop-loss (SL): Place at or just below the swing low (first red candle low).
- Target (TP): 1x, 2x, or more times the distance between entry and stop-loss.
5️⃣ Enhance Reliability: Combine with support levels, trendlines, moving averages, or other candlestick signals to filter out weak setups.
📊 Chart Explanation – Step by Step
✔ The Bullish Harami pattern was spotted after a clear downtrend.
✔ The following candle closed above the red candle’s open → Validation confirmed ✅ .
✔ A long entry was taken on the same candle.
✔ The Bullish Harami pattern has also been drawn and highlighted on the chart.
🔍 Observation
- If Target 1 is achieved → book 2 lots , and trail the remaining position with a stop-loss.
- Harami is only a potential reversal → confirmation is necessary.
- Breakout above the red candle’s open = buyers in control 🟢.
- Breakdown below the red candle’s close = setup failure ❌.
- Patience is key — wait for confirmation before entering.
📌 Why It Matters?
The Bullish Harami helps traders by:
- Reducing false reversal trades with strict rules.
- Providing clear entry/exit levels with discipline.
- Enforcing risk management via pre-defined SL & TP.
✅ Conclusion
The Bullish Harami becomes powerful when traded with discipline.
By marking the open and close of the red candle, traders can clearly separate a valid long trade from a failed setup.
With a stop-loss at the swing low and take-profits at 1x, 2x, or more, while trailing further lots, the Harami offers a structured, rule-based strategy.
⚠️ Always remember: the pattern shows possibility → price confirmation makes it probability .
⚠️ Disclaimer
For educational purposes only · Not SEBI registered · Not a buy/sell recommendation · No investment advice — purely a learning resource
Harami
Bearish Harami Pattern: Spotting Reversals with Discipline🔻Bearish Harami Pattern: Spotting Reversals with Discipline
Intro / Overview
The Bearish Harami is a candlestick reversal pattern that often appears at the end of an uptrend.
It signals a possible shift where bullish momentum weakens and sellers begin to step in.
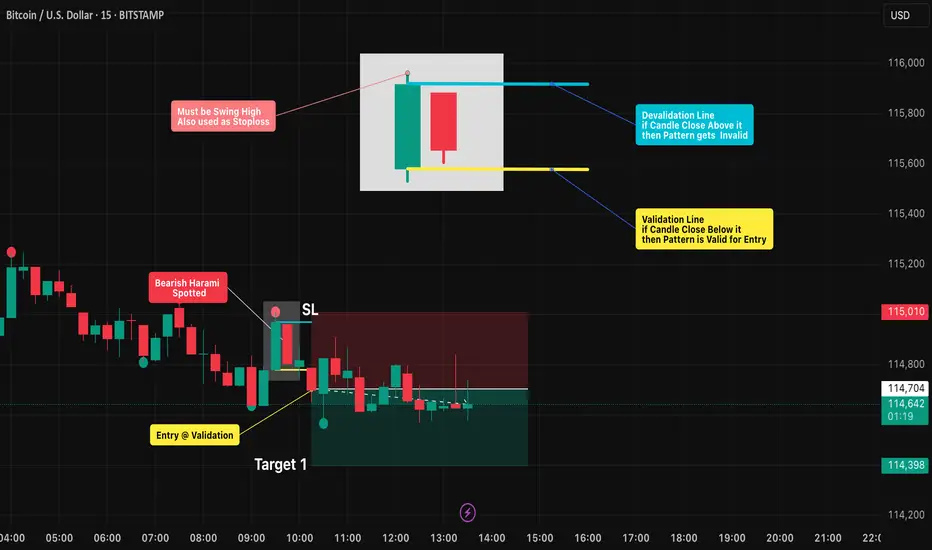
The first candle’s high must be a swing high , and this level can also be used as a stop-loss reference.
To trade it effectively, spotting the formation is not enough — strict validation and invalidation rules are key to avoid false signals.
✨ Concept
A Bearish Harami is a two-candle pattern:
- First candle (Green🟢): A strong bullish candle showing buyer dominance.(Swing high)
- Second candle (Red🔴): A smaller bearish candle whose body is fully inside the prior green candle’s body (wicks ideally inside).
This forms the “harami” structure, where the red candle looks like it is “inside the green candle,” suggesting a pause in bullish pressure and potential reversal.
📖 How to Use
1️⃣ Identify the pattern: Look for a large green candle followed by a smaller red candle contained within it.
2️⃣ Validation Point: The setup is validated if price closes below the open of the green candle within the next few candles.
3️⃣ Invalidation Point: The setup is invalidated if price closes above the close of the green candle before validation occurs.
4️⃣ Stop-Loss & Targets:
- Stop-loss (SL): Place at or just above the swing high (first green candle high).
- Target (TP): 1x, 2x, or more times the distance between entry and stoploss.
5️⃣ Enhance Reliability: Combine with resistance levels, trendlines, moving averages, or other candlestick signals to filter out weak setups.
📊 Chart Explanation – Step by Step
✔ The Bearish Harami pattern was spotted after a clear uptrend.
✔ The following candle closed below the green candle’s open → Validation confirmed ✅.
✔ A short entry was taken on the same candle.
✔ A Bearish Harami pattern has also been drawn and highlighted on the chart.
🔍 Observation
- If Target 1 is achieved → book 2 lots , and trail the remaining position with a stop-loss.
- Harami is only a potential reversal → confirmation is necessary.
- Breakdown below the green candle’s open = sellers in control 🔻.
- Breakout above the green candle’s close = setup failure ❌.
- Patience is key — wait for confirmation before entering.
📌 Why It Matters?
The Bearish Harami helps traders by:
- Reducing false reversal trades with strict rules.
- Providing clear entry/exit levels with discipline.
- Enforcing risk management via pre-defined SL & TP.
✅ Conclusion
The Bearish Harami becomes powerful when traded with discipline.
By marking the open and close of the green candle, traders can clearly separate a valid short trade from a failed setup.
With a stop-loss at the swing high and take-profits at 1x, 2x, or more, while trailing further lots, the Harami offers a structured, rule-based strategy.
⚠️ Always remember: the pattern shows possibility → price confirmation makes it probability .
⚠️ Disclaimer
For educational purposes only · Not SEBI registered · Not a buy/sell recommendation · No investment advice — purely a learning resource
NIfty harami hi guys,
Lets wait for a breif movement for breakout on upside or on down side based on the levels ,and we can see all the inside candles in the big red bar which is a harami and guys this a 1hr time frame so patience is the key and mostly avoid to take trade in first 1hr candle of market opening .
disclaimer- this is not any investment call or idea , this just my view and it can go wrong ,this is only for educational purposes trade at your own risk :)

Ashoka Buildcon Long EntryNSE:ASHOKA Harami candle s formation near the support of 10 DEMA enough for positional entry with calculated risk reward.
Disclaimer: Not at all a recommendation but just for community sharing.

Bullish and Bearish Harami candles concept Educational Post
Bullish Harami
Bullish Harami is candle stick pattern which shows counter attack by bull on bear entering the support zone.
Significance of candle stick pattern is at support level of charts.
Bullish(Green) candle should gap up from close of bearish(Red) candle and close should be above the median of bearish(red) candle with volume.
Bearish Harami
Bearish Harami is candle stick pattern which shows counter attack by Bear on bulls entering the resistance zone.
Significance of candle stick pattern is at resistance level of charts.
Bearish(red) candle should gap down from close of bullish(green) candle and close should be below the median of bull(green) candle with volume.
If you like the post,Please follow,like and share it.
Happy Trading!!!

INFY RSI DIVERGENCEInfosys is making a series of lower highs and lower lows for the past 70 days, whereas the RSI is continuously making higher highs and lower lows.
This divergence can be spotted easily on the Daily Timeframe.
Also, we can see a bullish closing on weekly basis.
We can see an upside momentum in this stock soon.
1420 level can be taken as a stop loss
1450-1470 is a good entry point.
!!! This is not an investment advice and do your own due diligence before investing/trading on any script !!!
!!! This post is only for educational purposes and not advising anyone to trade on behalf of this trade !!!

Nifty - Is it forming a harami at support?Nifty if ends up forming a harami today. That will be the successful shoulder re test of the continuation head and shoulder.
Nifty fall over?

Gold LongGold Long
Buy at CMP- 47750
SL- 47570
Target- 47945, 48050
Join us, Learn more, Earn more
Disclaimer- We are not SEBI registered advisor.
Charts and views are only for educational purpose.

REC LongREC Long
Bullish Harami Candle pattern found after a long down trend.
Yesterday stock took support at 100 day EMA at 140 level
Buy above- 145
SL- 139
Target- 155, 164
Disclaimer- We are not SEBI registered advisor.
Charts and views are only for educational purpose.

Marico BuyStock after the retracement can bounce back from this support area. Buy around 515-520 With SL Below 513 on a closing basis.
Targets will be 540 and 555 Great Risk to reward ratio for this trade and the FMCG sector can perform from here after a bit of retracement. Breakout from this level is needed RSI-based strategy.
Candle confirmation today buy if closes in green candle today bullish harami pattern is forming on the daily chart. Support and resistance trading
You can visit my ID for similar charts shared priorly and see results.

Mentorship InstaView 16 July’21: Consolidation is better than Co
Nifty View: A flat unit point's negative close for the benchmark Nifty index in today’s session to end the week. On a week-on-week basis, it was however a better performance as the index gained over 1.35% or 213 points and post a new life high. The index is essentially consolidating this recent rally with today’s flat close which has taken the shape of a “Bearish Harami” pattern on the daily time frame. I will reiterate my view that the only worry for the next couple of trading sessions will be if the index slips down and breaks below 15,775. Or else we should do fine and short tern consolidations like we experienced today is healthy for the underlying uptrend. Keep a bullish stance and look to add long positions.
Thank you for following my work and please feel free to share your thoughts and suggestions.
Trade Well. Trade Wise.

BHEL potential buybullish harami signal observed on 14th and 15th may which is confirmed on 16th may.

ADANIENT BULLISH HARAMI FORMALL bullish harami levels are given with target ..stoploss. and buy rate (buying level)...

ILong

TRENDL LINE BREAK OUT 11.03.2021BUY 103 TO 97
TARGET 170
Reason For Buying This Script :
It is broken trend line in upper side in weekly candle . Wait for retracement up to 97.
Note :
Above given levels are based on weekly time frame it will take some days to achieve the target , So be patience.
ALL THE BEST....
ILong

HEROMOTOCO in pullback retesting the breakout zone.Heromotoco retesting the breakout, previous resistance now turned into support and forming a bullish harami candle will punch an order at 3433

PEL - IntradayPEL is showing an uptrend in 1H & 15 min TF.
15 min candle formed a bullish pin bar & harami pattern from support + FIb 0.618 level.
PLong


BHARAT FORGE ANALYSIS 11.01.2021BUY 606 TO 576
TARGRT 706
Reason for buying this stock:
In this stock this has braked the trend line in upper side it show in positive,
it may take some retest moment up to 576 or it wont take.
Note:
Target Levels are based on weekly time frame, so it may some days to achieve the target, Be patience.


[Inside Bar] Ashok Leyland It's at trendline support making an inside bar after it got beaten down due to bad numbers.
Risk reward is favourable for bullish view. Let's what price action brings for this one
Buy above 48.6 with SL at 46.8 for 52-54
Sell below 46.8 with SL at 48.6 for 42

VEDANTA Trade SetupThis Analysis Is Done Only For Educational & Intelligence Purpose, Invest Or Trade At your Own Risk & Will.

Higher Trade and Delivery with Bullish HaramiConsistently improving on Higher Delivery quantity and trade quantity
Close to 52 week low Zone
Formed Bullish Harami.
Keep on track for trend reversal and add to long
