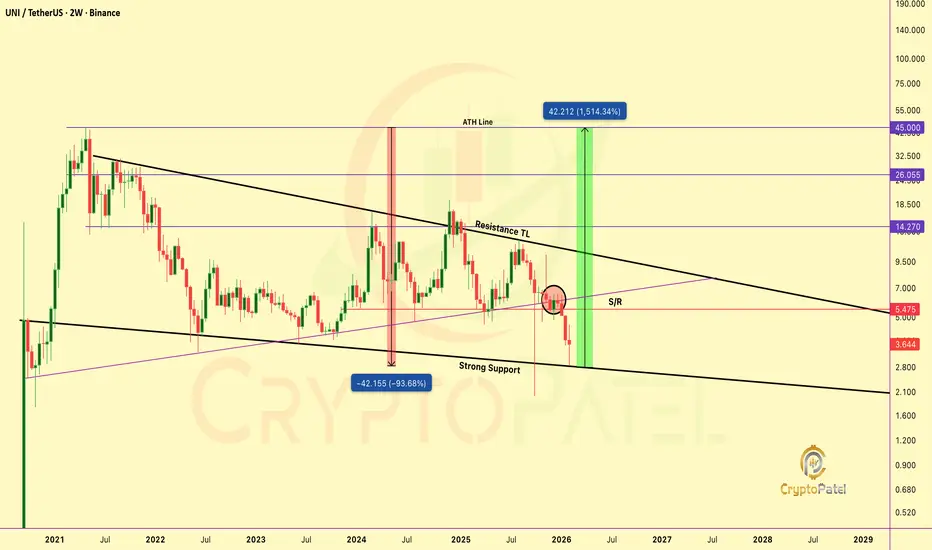
IS UNI/USDT THE GENERATIONAL BUY BEFORE 1,500% RALLY?BME:UNI DROPPED -93% FROM ATH: IS THIS THE GENERATIONAL BUY BEFORE 1,500% RALLY?
#UNI Is Currently Testing A Multi-Year Descending Channel Support That Has Held Since 2022, A Rare, High-Timeframe, Cycle-Level Structure.
The Last Time This Setup Formed, UNI Delivered:
2020: +2,400% (24x From Oct 2020 Lows)
2023 : +400% (4x Rally From Support)
2026: +1,500% (15x Potential)?
Current Technical Structure:
✅ Multi-Year Descending Channel Support Holding
✅ Breakdown Strong Support $6 & Now Trading Below Support Zone
✅ Holding The $2.80 Strong Demand Zone (Accumulation zone)
✅ Major Macro Support At $2.80, Invalidated Below
✅ Brutal -93.68% Correction From ATH, Maximum Pain Zone/Discount Zone
CryptoPatel Targets: If This Structure Holds: $14/$26/$45
Why Expect 3x–8x From Here? The Current Positioning Suggests Smart Money Accumulation At HTF Support With Asymmetric Upside If Structure Flips. The Longer The Base, The Higher The Space.
Based On The Current Cycle, A Move Toward $45 Or Even Higher Could Be On The Cards, Especially With DeFi Narrative Gaining Momentum And Uniswap V4 Development.
Disclaimer: This Is A TA, NFA. Markets Are Probabilistic, Not Guaranteed. Always Manage Risk And Do Your Own Research.
Harmonic Patterns
NIFTY Intraday Trade Setup For 17 Feb 2026NIFTY Intraday Trade Setup For 17 Feb 2026
Bullish-Above 25700
Invalid-Below 25650
T- 25915
Bearish-Below 25490
Invalid-Above 25540
T- 25245
NIFTY has closed on a bullish note with 0.82% gain, making an engulfing candle in daily TF. Index took support from 25500. Next time index will be gripped by bears if this base breaks below 25490. Since its an engulfing candle above 25700 we can expect a move till 25915-50, intraday resistance for the day. 25245 will be target below 25490.
Plan on a 15 Min candle close on the breakout levels, 25700 and 25490.
I am Not SEBI Registered
This is my personal analysis for my personal trading. Kindly consult your financial advisor before taking any actions based on this.

NIFTY- Intraday Levels - 17th Feb 2026
If NIFTY sustain above 25689/ then 257368 above this bullish then 25838/65/70/97 above this more bullish then 25951/994 or 26010 above this wait
If NIFTY sustain below 25666 below this bearish then around 25996/80 below this more bearish below this wait more levels marked on chart
Consider some buffer points in above levels.
Please do your due diligence before trading or investment.
**Disclaimer -
I am not a SEBI registered analyst or advisor. I does not represent or endorse the accuracy or reliability of any information, conversation, or content. Stock trading is inherently risky and the users agree to assume complete and full responsibility for the outcomes of all trading decisions that they make, including but not limited to loss of capital. None of these communications should be construed as an offer to buy or sell securities, nor advice to do so. The users understands and acknowledges that there is a very high risk involved in trading securities. By using this information, the user agrees that use of this information is entirely at their own risk.
Thank you.

$AAVE -86% CRASH CREATED A ONCE-IN-A-CYCLE OPPORTUNITY CRYPTOCAP:AAVE -86% CRASH CREATED A ONCE-IN-A-CYCLE OPPORTUNITY | $1,000 TARGET STILL IN PLAY?
#AAVE Is Trading Around $124 Above Major Weekly Strong TL Support at $90 Which is HTF Accumulation Zone.
Structure Is Showing Clear Liquidity Sweep + Reaction From Multi-Year Ascending Trendline That Has Held Since 2021.
Already Experienced -86% Correction From It's ATH, Classic Re-Accumulation Setup Forming.
Price Compressing Between Descending Resistance & Ascending Support. Breakout Imminent.
CURRENT TECHNICAL STRUCTURE:
➤ Bullish OB & Support (Accumulation Zone): $110-$90
➤ Price Must Hold Above $74 For Bullish Continuation
➤ Multi-Year Ascending Trendline + 0.618 Fib Confluence = Strong Demand
➤ Descending TL Compression + Higher Low Formation In Progress
➤ Weekly Close Below $74 = Bullish Invalidation
Upside Targets: $190 ➔ $345 ➔ $579 ➔ $1,000+ (~10x From Accumulation Zone)
IMO: #AAVE Is Currently Trading Between 0.618-0.786 Fib Strong Support A Generational Accumulation Range Before Massive Expansion. DeFi Blue Chip At 86% Discount.
Purely TA Only | Not Financial Advice | Always DYOR
Your Aave Target This Cycle?
Like + RT + Bookmark

AUD- USD Analysis on 4Hr TFThe AUDUSD is in Up Trend . The Elliot Wave Impulse pattern I have mentioned may be treated as the retest and completion of Second Impulse Pattern of 2-3 for minimum Fib - 1.68 Level as the Target has been mentioned

XAU-USD Analysis on 30 Min TFXAUUSD has just broken the Pattern of Flat-Top and retest has already been confirmed through a Ascending Channel . All the Patterns refers to Bearish movement . If Price action Follows then there is a possibility of Double bottom Patten Formation at the levels mentioned.
It may be in Uptrend at the earliest possible that is Target Supply else it will complete the Full supply and then there will be strong Move on Up Direction
Now it is in a Consolidation Zone before any Big Rally.

#SMALLCAP INDEX BIG CRASH #Smallcap big crash on Card min 9-10% downside possible
level upto 14500
u can use SL 17k

Part 2 Institutionaal Intraday Trading Risk Management and Compliance
Institutional trading is governed by strict "Risk Parameters." A retail trader might risk their whole account on a "YOLO" trade; an institutional trader has hard stops programmed into their software.
Value at Risk (VaR): A statistical technique used to measure the level of financial risk within a firm over a specific time frame.
Position Sizing: No single intraday position is usually allowed to exceed a tiny percentage of the total fund to prevent a single "black swan" event from bankrupting the firm.
Compliance: Every trade is logged and monitored for "spoofing" (placing fake orders to manipulate prices) or "front-running" (trading ahead of a client's known order), both of which are highly illegal.

Part 5 Advance Trading Tips Smart Money Concepts (SMC)
SMC studies how banks and institutions trap retail traders.
Core Elements
Liquidity Sweeps (stop-hunt areas)
Order Blocks (institutional supply-demand zones)
Fair Value Gaps (FVG)
Displacement (powerful institutional candle)
How To Trade SMC
Identify liquidity (swing highs/lows).
Wait for sweep (price grabs liquidity).
Look for BOS (trend shift).
Enter at Order Block / FVG.
Place stop-loss beyond liquidity.

Part 4 Institutional Option Trading VS. Technical AnalysisTechnical Analysis Strategies
TA traders use:
Breakout trading
Trend-following
Support/resistance bounce
Momentum setups
Reversal patterns
Moving-average strategies
Price action scalping
Chart patterns (triangles, flags, head and shoulders etc.)
TA is visual + rule-based, not quantitative.

XAUUSD (Gold) | Breakout Trade Setup | 16th Feb'2026XAU/USD is currently trading at 5005, with neutral intraday momentum while maintaining a strong bullish bias on the higher timeframe.
Moving averages continue to favor buyers (9 Buy vs 3 Sell), reflecting underlying strength in trend structure. However, oscillators remain neutral, with RSI around 49 — sitting near the midpoint and indicating balanced short-term momentum. Price is hovering close to the pivot level at 4993, suggesting indecision in the immediate term, while the medium-term structure remains firmly bullish.
Key technical levels to watch:
Resistance: 5014 / 5052 / 5072
Support: 4956 / 4935 / 4898
In a bullish scenario, holding above the 4990–5000 zone keeps upside pressure intact. A sustained breakout above 5015 could trigger momentum toward 5050–5070, aligning with the broader uptrend.
In a bearish scenario, a breakdown below 4955 may open the path toward 4935 and potentially 4898. Additional confirmation would come from RSI slipping below 45, signaling increasing downside pressure.
Best intraday approach:
Consider buying near support around 4960–4970 with a tight stop-loss.
Alternatively, trade a confirmed breakout above 5015 for momentum continuation.
Overall view: The higher timeframe trend remains bullish, while intraday structure is neutral and range-sensitive. Patience around key levels is essential.
Disclaimer: This analysis is for educational and informational purposes only and does not constitute financial advice. Trading involves significant risk, and market conditions can change rapidly. Always conduct your own research and use proper risk management before making any trading decisions.

Part 3 Institutional Option Trading VS. Technical AnalysisInstitutional Option Trading Strategies
Institutions use:
Volatility arbitrage (IV vs RV)
Gamma scalping
Dispersion trading
Delta-neutral portfolios
Hedged index options
Calendar & diagonal arbitrage
Cross-asset hedging (FX-Bonds-Equity)
Tail-risk hedges
Large options sweeps (smart money orders)
These strategies require:
Mathematical modeling
High computational power
Deep liquidity
Risk management systems

JBCHEPHARM 1 Week Time Frame 📌 Weekly Support & Resistance Levels (Recent Technicals)
Resistance Zones (Upside Targets):
R3: ~₹1,978–₹1,980
R2: ~₹1,937–₹1,942
R1: ~₹1,906–₹1,910
(Weekly break above these suggests bullish continuation)
Pivot / Mid (Key Reference):
Pivot Zone: ~₹1,865–₹1,870
(Above this suggests positive bias, below = cautious)
Support Zones (Downside Floors):
S1: ~₹1,834–₹1,839
S2: ~₹1,793–₹1,829
S3: ~₹1,763–₹1,776
(Breaks below these levels open deeper weekly correction risk)
📊 Context (Weekly Chart Interpretation)
✔ Above ~₹1,910 (R1):
Weekly closes above this level strengthen bullish structure, target next at ~₹1,937–₹1,978.
✔ Between ~₹1,865–₹1,910:
This is a neutral consolidation band — weekly direction remains uncertain and range-bound.
✔ Below ~₹1,834:
Loss of this support suggests weekly bearish momentum; next downside towards ~₹1,760 region.
🔍 Weekly Strategy Guide (Technical Context Only — not investment advice):
Bullish weekly bias: Weekly close above ₹1,906–₹1,910.
Neutral / consolidating: ₹1,865–₹1,906 range.
Bearish risk: Weekly close below ₹1,834.

POONAWALLA 1 Week Time Frame 📊 Weekly Timeframe – Key Levels (Accurate & Recent)
🔹 Weekly Pivot (Central Reference)
Pivot: ~₹477–₹483
This is the price zone where weekly sentiment flips — above is bullish bias, below is bearish/neutral.
🔸 Upside Resistance Zones
These are levels where price may struggle or turn around on the weekly chart:
1. Immediate Resistance: ₹483–₹490
~ Trendline and horizontal supply resistance zone. Break above this suggests bullish momentum continuation.
2. Higher Target Resistance: ₹500–₹515
~ Next logical upside if ₹490 breaks with volume.
3. Major Upper Resistance: ₹530+ / ₹550+
~ Longer-term weekly supply area and recent historical resistance.
🔹 Downside Support Zones
These are key weekly support levels where price can find buyers:
1. Support Level 1: ₹460–₹465
~ First support around recent swing lows.
2. Support Level 2: ₹440–₹420
~ Stronger intermediate support zone (multiple weekly candles tested here).
3. Major Structural Support: ₹365–₹340
~ Deep support from long-term weekly structure and consolidations.
📈 Weekly Trend & Indicators Snapshot
Weekly price is near resistance and trendline area (~₹480–₹490) — this is a critical zone for trend continuation or pullback.
Moneycontrol weekly technical shows moving averages and MACD still positive, indicating uptrend bias on weekly timeframe.
Etmoney pivot estimates also align to weekly R1 near ₹500 and S1 near ₹464 on weekly scale.
🧠 How to Use These Weekly Levels
Bullish Weekly Setup
Weekly close above ~₹490 → confirmation of breakout
Next target zones: ₹500 → ₹515 → ₹530+
Neutral / Pullback Setup
Range play between ₹460–₹490
Watch for rejections and reversal candlestick patterns
Bearish Weekly Setup
Weekly close below ~₹460 → possible retest of ₹440 → ₹420
Breakdown below ₹420 can lead to deeper supports

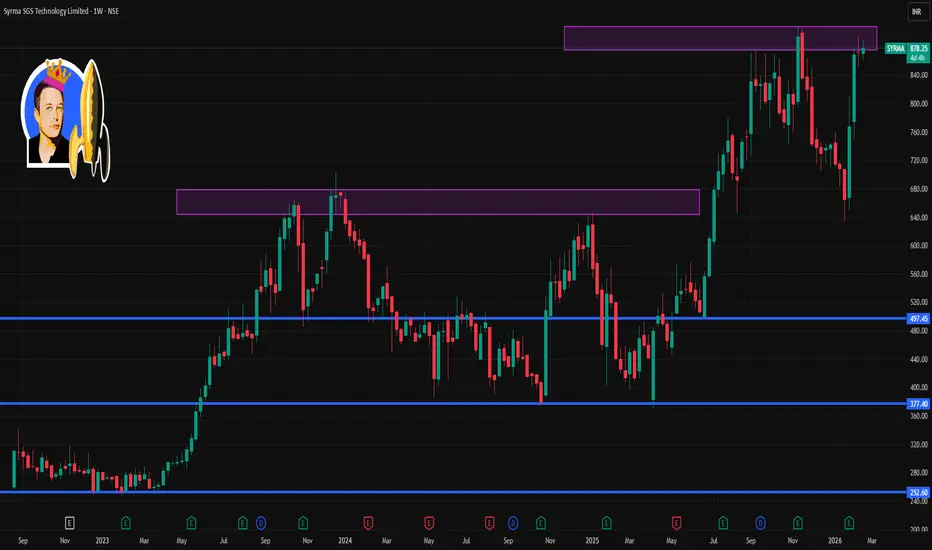
SYRMA 1 Week Time Frame 📌 Current Price: ~₹872–₹878 on NSE (recent trading range).
📈 Weekly Technical Levels (Support & Resistance)
🔹 Resistance Levels
R1: ~₹876 – immediate short-term upside hurdle (near recent high).
R2: ~₹892 – next resistance zone where selling pressure can appear.
R3: ~₹916 – bullish breakout target if price sustains above R2.
🔸 Pivot / Neutral Zone
Weekly Pivot ~₹849–₹873 area – this zone acts as reference for bullish vs bearish bias:
– Above pivot → bias turns mildly bullish
– Below pivot → bias is neutral/weak
🔻 Support Levels
S1: ~₹834 – first key support on weekly frame.
S2: ~₹806 – stronger downside support zone if S1 breaks.
S3: ~₹791 – deeper support level (next major cushion).
📊 These are the key weekly price barriers based on recent pivot and volume nodes — they help you gauge where buyers/sellers might step in over the next 5–7 days.
🧠 Short-Term Technical Context
Trend: Around range-bound to slightly bullish in the very short term — recent price is near weekly pivot/resistance area.
👉 Sustained break above ~₹892 would suggest momentum toward higher weekly levels (₹900+)
👉 Breakdown below ~₹806 could tilt short-term bias bearish.
Note: True weekly pivots adjust each trading week; the above is latest near-term reference based on technical sources.
What Are Reserves and Why Are They Important?1. Financial Security and Stability
One of the most important reasons reserves are necessary is to provide financial security. Businesses and individuals face uncertainties such as economic downturns, sudden expenses, or unexpected losses. Having reserves ensures that operations can continue even during difficult times.
For example, during global financial crises like the 2008 recession, many companies without sufficient reserves struggled or went bankrupt. In contrast, organizations with strong reserves were able to survive because they had funds to cover operating costs, salaries, and debts.
Similarly, central banks such as the Federal Reserve maintain reserves to stabilize the economy. These reserves help manage inflation, control interest rates, and provide liquidity to financial institutions during emergencies.
2. Handling Emergencies and Uncertainty
Reserves act as an emergency fund. In business, unexpected events such as equipment failure, natural disasters, lawsuits, or sudden drops in sales can create financial strain. Without reserves, companies may need to borrow money at high interest rates or shut down operations.
Governments also maintain reserves to respond to national emergencies such as pandemics, wars, or natural disasters. For instance, many countries relied heavily on their financial and medical reserves during the COVID-19 pandemic to support healthcare systems and provide economic relief to citizens.
On a global level, institutions like the International Monetary Fund help countries manage financial crises by providing support when their reserves are insufficient.
3. Supporting Business Growth and Expansion
Reserves are not only for emergencies; they also support growth and expansion. Businesses use retained earnings (a form of reserve) to invest in new projects, research and development, new technology, and expansion into new markets.
For example, companies such as Apple Inc. maintain large cash reserves. These reserves allow them to invest in innovation, acquire other companies, develop new products, and remain competitive in the global market.
Having sufficient reserves allows businesses to take advantage of opportunities quickly without relying entirely on external financing. This flexibility can lead to sustainable long-term success.
4. Improving Creditworthiness
Organizations with strong reserves are generally viewed as more financially stable and trustworthy. Banks and investors prefer lending to companies that have solid reserves because it reduces the risk of default.
A company with good reserves can secure loans at lower interest rates. This improves its credit rating and reputation in the market. Similarly, countries with high foreign exchange reserves are seen as economically stable and less risky for investors.
For example, the Reserve Bank of India maintains foreign exchange reserves to manage currency stability and ensure smooth international trade. These reserves strengthen investor confidence in the country’s economy.
5. Maintaining Liquidity
Liquidity refers to the ability to meet short-term obligations. Reserves ensure that businesses and institutions can pay salaries, suppliers, and debts on time. Without adequate reserves, even profitable companies may face cash flow problems.
Banks are required to maintain certain reserves to ensure they can meet customer withdrawals. Central banks set reserve requirements to prevent bank failures and maintain public confidence in the banking system.
For example, the European Central Bank sets policies that influence how much money banks must keep as reserves. This protects depositors and maintains financial stability within the European Union.
6. Protecting Against Inflation and Currency Fluctuations
Countries maintain foreign exchange reserves to manage currency fluctuations and protect against inflation. These reserves include foreign currencies, gold, and other assets. When a country’s currency weakens, the central bank can use reserves to stabilize it.
4
Gold reserves, in particular, have historically been used as a hedge against inflation and economic instability. Many countries still maintain gold reserves as part of their financial strategy.
7. Encouraging Long-Term Planning
Reserves encourage disciplined financial management. When organizations set aside funds regularly, they are more likely to think long term rather than focusing only on immediate profits.
This principle also applies to environmental reserves. Forest reserves and wildlife reserves protect natural resources for future generations. Governments create protected areas to prevent overuse and ensure ecological balance.
For example, national parks such as Yellowstone National Park preserve natural ecosystems and biodiversity. These environmental reserves ensure that natural resources are available for future generations.
8. Enhancing Investor and Public Confidence
When stakeholders know that a company or country has strong reserves, they feel more secure. Investors are more willing to invest, employees feel more stable, and customers trust the organization.
Strong reserves act as a signal of good management and responsible financial planning. During uncertain times, this confidence becomes even more important, as it prevents panic and instability.
9. Types of Reserves
There are several types of reserves in finance and economics:
Revenue Reserves – Created from profits and used for business expansion or contingencies.
Capital Reserves – Generated from capital profits, such as selling assets.
Statutory Reserves – Required by law, especially for banks and financial institutions.
General Reserves – Set aside for unspecified future needs.
Foreign Exchange Reserves – Maintained by central banks to manage currency stability.
Each type of reserve serves a specific purpose but collectively contributes to overall financial health.
10. Reserves in Personal Finance
The importance of reserves is not limited to large institutions. Individuals are encouraged to maintain emergency savings covering at least three to six months of expenses. Personal reserves protect against job loss, medical emergencies, and unexpected expenses.
Financial advisors often stress that building reserves is the first step toward financial independence and stability.
Conclusion
In conclusion, reserves are essential for stability, security, growth, and sustainability. They act as a financial cushion during emergencies, support expansion and innovation, enhance creditworthiness, maintain liquidity, and protect against economic uncertainties. Whether in businesses, governments, banks, or personal finance, reserves promote responsible planning and long-term success.
From central banks like the Federal Reserve and the Reserve Bank of India to global institutions like the International Monetary Fund, reserves form the backbone of financial systems. Similarly, environmental reserves like Yellowstone National Park demonstrate the importance of preserving natural resources for future generations.
Without reserves, organizations and nations would be far more vulnerable to crises and instability. Therefore, building and maintaining reserves is a fundamental principle of sound financial and economic management.

Foreign Institutional Investors (FIIs) – Impact on Investments1. Role of FIIs in Capital Markets
FIIs primarily invest in:
Equity markets (shares of listed companies)
Debt markets (government bonds and corporate bonds)
Derivatives and other financial instruments
Their large-scale investments inject substantial capital into financial markets. Since they manage massive pools of global funds, even small allocation changes toward emerging markets can result in significant capital inflows or outflows.
Positive Impact of FIIs on Investments
2. Increased Liquidity
One of the most significant contributions of FIIs is enhanced market liquidity. Liquidity refers to how easily assets can be bought or sold without affecting their price significantly. When FIIs invest heavily in stock markets, trading volumes increase, bid-ask spreads narrow, and price discovery becomes more efficient.
Higher liquidity benefits:
Retail investors (easy entry and exit)
Domestic institutional investors
Corporations raising capital
For example, large FII inflows into benchmark indices like the BSE Sensex and NIFTY 50 often lead to increased trading volumes and bullish trends.
3. Improved Market Efficiency
FIIs usually employ professional fund managers, research analysts, and sophisticated risk management systems. Their investment decisions are based on in-depth financial analysis, macroeconomic evaluation, and global trends. As a result, they bring:
Better valuation standards
Improved corporate governance expectations
Greater transparency
Companies seeking FII investments are often required to maintain high levels of disclosure and compliance, leading to overall market improvement.
4. Boost to Economic Growth
When FIIs invest in equity, companies receive capital that can be used for expansion, innovation, infrastructure, and employment generation. Increased capital availability lowers the cost of capital for businesses. This encourages corporate growth and supports economic development.
FII inflows also strengthen foreign exchange reserves when capital enters the country, contributing to macroeconomic stability.
5. Integration with Global Markets
FIIs connect domestic markets with global financial systems. Their participation makes markets more internationally integrated. This:
Attracts further foreign investments
Enhances global credibility
Aligns domestic markets with global standards
As a result, emerging markets gain visibility among international investors.
Negative Impact of FIIs on Investments
Despite their benefits, FIIs can also create certain risks and challenges.
6. Market Volatility
FIIs are often driven by global factors such as:
US Federal Reserve interest rate decisions
Geopolitical tensions
Global recession fears
Currency fluctuations
When global conditions become unfavorable, FIIs may withdraw large sums rapidly. Such sudden outflows can cause:
Sharp declines in stock markets
Currency depreciation
Increased volatility
For instance, heavy FII selling can lead to significant corrections in indices like the BSE Sensex.
7. Exchange Rate Fluctuations
FII inflows increase demand for the domestic currency, causing appreciation. Conversely, large outflows increase demand for foreign currency (such as USD), leading to depreciation.
A volatile exchange rate can impact:
Import/export businesses
Inflation levels
Foreign debt servicing
Thus, FIIs indirectly influence currency markets and macroeconomic stability.
8. Overdependence on Foreign Capital
Excessive reliance on FII inflows can make an economy vulnerable to external shocks. Since FIIs are primarily short- to medium-term investors seeking high returns, their commitment may not be long-term.
If domestic investment participation is weak, markets may become overly dependent on foreign funds, increasing systemic risk during global crises.
9. Herd Behavior
FIIs sometimes engage in herd behavior, where large numbers of institutional investors buy or sell simultaneously based on global sentiment rather than domestic fundamentals. This can result in:
Asset bubbles during high inflows
Market crashes during mass withdrawals
Retail investors often react to FII activity, amplifying market movements.
FIIs vs Domestic Institutional Investors (DIIs)
In many emerging markets, the balance between FIIs and Domestic Institutional Investors (DIIs) determines market stability.
FIIs bring global capital and expertise.
DIIs provide stability during periods of foreign outflows.
When FIIs sell heavily, DIIs often step in to stabilize markets. A healthy mix of both is essential for sustainable growth.
Impact on Different Types of Investments
10. Equity Investments
FIIs significantly influence stock prices. Stocks with high FII holdings often experience:
Higher valuation multiples
Greater price sensitivity to global trends
Increased analyst coverage
Large-cap companies typically attract more FII investments due to better liquidity and governance standards.
11. Debt Investments
FIIs also invest in government securities and corporate bonds. Their participation:
Reduces borrowing costs
Improves bond market depth
Influences interest rates
However, sudden debt outflows can pressure bond yields and currency stability.
12. Sectoral Impact
Certain sectors receive higher FII attention, such as:
Banking and Financial Services
Information Technology
Pharmaceuticals
Infrastructure
Increased FII participation in specific sectors can drive sectoral rallies and attract further domestic investments.
Long-Term Structural Impact
Over the decades, FII participation has transformed emerging markets by:
Modernizing trading systems
Encouraging regulatory reforms
Improving accounting standards
Enhancing corporate governance
Regulatory bodies like the Securities and Exchange Board of India have continuously refined policies to ensure that FII investments contribute to stability rather than speculation.
Conclusion
Foreign Institutional Investors have a profound and multifaceted impact on investments. On the positive side, they enhance liquidity, improve market efficiency, promote corporate governance, and integrate domestic markets with global financial systems. Their capital inflows stimulate economic growth and support business expansion.
However, FIIs also introduce volatility due to their sensitivity to global economic conditions. Sudden inflows and outflows can destabilize markets, affect exchange rates, and create short-term uncertainty. Therefore, while FIIs are essential drivers of capital market development, balanced participation from domestic investors and prudent regulatory oversight are crucial.
In summary, FIIs act as both catalysts for growth and sources of volatility. Their overall impact on investments depends on macroeconomic fundamentals, regulatory frameworks, and the resilience of domestic financial systems. A well-regulated environment that encourages stable long-term foreign investment while minimizing speculative flows can maximize the benefits of FIIs for sustainable economic development.

YES BANK BY KRS Charts2nd Sept 2025 / 10:01 AM
Why Yes Bank ?
1. last few years YES BANK is making HH & HLs in Monthly & Weekly TFs . It has potential technically, but will check our patience.
2. Above Chart it fills up all the FVGs - Fair Value Gaps and bounced back in Month of April. As we can see in Chart mentioned recently also same FVG reversal is visible.
3. Also Potential of Reversal chart pattern at bottom of trend is also visible.🤞
4. Less than 2 Rs Risk and Almost 5 Rs Reward is making this trade Safe 👍
5. Point to be noted 20.25 Rs is nearest Resistance and Pattern Target of 28 Rs unlock After breakout of neckline at 22 Rs.

XAUUSD – Brian | Liquidity CompressionXAUUSD – Brian | Liquidity Compression Before Expansion?
Gold is currently consolidating on the H2 timeframe after rejecting the recent swing high near the 0 Fibonacci anchor. Price remains trapped between upper resistance and a strong demand base below — creating a classic liquidity compression structure.
The market is not trending. It is preparing.
🔎 Technical Structure
Rejection from prior high (0 Fibonacci level)
Pullback respected the 0.5–0.618 retracement zone
Current price rotating around 0.236–0.382 region
Major demand liquidity resting near 4,700 – 4,750
Immediate resistance around 5,080 – 5,100
This is a balanced structure — not yet a confirmed breakout.
🌍 Fundamental Context
Recent geopolitical developments add a layer of uncertainty.
Israel's announcement about gradually reducing U.S. military aid over the next decade and restructuring strategic dependence signals potential long-term geopolitical shifts.
While not an immediate catalyst, structural geopolitical recalibration tends to:
Support safe-haven flows
Increase medium-term gold demand
Add volatility spikes on headlines
Gold remains sensitive to geopolitical risk pricing.
📊 Probable Scenarios
🟡 Scenario 1 – Liquidity Sweep Down First
Short-term pullback toward the 4,840–4,700 demand zone
→ Sweep liquidity
→ Strong bullish continuation toward 5,100+ and possibly higher.
🔵 Scenario 2 – Direct Breakout
If price holds above 4,980 and absorbs selling pressure, upside expansion toward upper liquidity may occur without deep retracement.
🎯 Trading Focus
Watch reactions at 0.236 Fibonacci
Do not chase breakouts inside compression
Prioritize liquidity sweeps before entries
Key execution zones: 4,700 demand & 5,080 resistance
Gold is compressing beneath resistance while holding structural higher lows.
When liquidity builds, expansion follows.
Patience defines positioning.
Follow Brian for structured XAUUSD breakdowns, liquidity mapping, and high-probability execution planning.

Gold Outlook: Important Levels and BiasHi Traders, hope you all are doing well. In the current XAUUSD structure, gold has given a strong bullish reaction from the recent demand zone, which shows that buyers are still active in the market. After this bounce, price is now moving near the 5040 supply area, which is acting as an important short-term decision level.
If the market opens with good buying momentum and price sustains above 5040 with strong bullish candles, we can expect further upside toward 5100 and 5150 levels. A proper breakout and holding above the supply zone may confirm short-term bullish strength.
On the other side, if price faces rejection near 5040 and forms weak or bearish structure, then a temporary pullback toward previous support levels is possible before the next move.
This analysis is shared only for educational purpose. Please wait for confirmation and always follow proper risk management as per your trading plan.

FOREX "PAIRS IN PLAY" Session 33 15 02 26Scanning multiple forex pairs to filter high-quality trade setups. No trades are forced—only structure-based opportunities.
Note: There may be a delay in this video due to upload processing time.
Disclaimer: FX trading involves high leverage and substantial risk, and losses can exceed your initial investment. This content is for educational purposes only and should not be considered financial advice. Trade at your own risk.

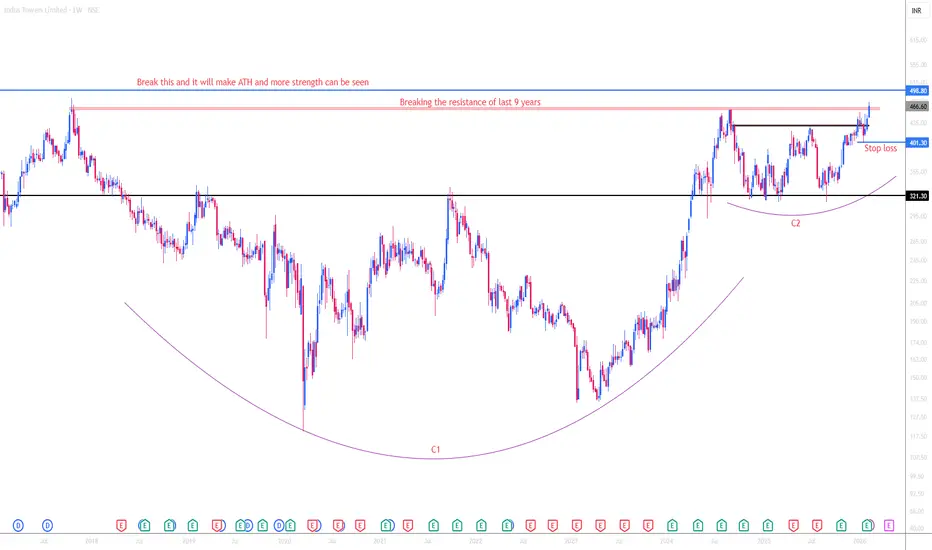
INDUS TOWER ANALYSISTHIS IS MY CHART OF THE WEEK PICK
FOR LEARNING PURPOSE
INDUS TOWER- The current price of INDUS TOWER is 466.60 rupees
I am going to buy this stock because of the reasons as follows-
1. It is making a new high by breaking the resistance of last 9 years ( we often call this Multi year breakout)
2. This stock has seen some great buying in 2023 to Jun 2024. I have been keeping this stock in my watchlist from last few weeks
3. It has shown better relative strength as it stood strong in volatile times (if you see it 6-9 month comparison)
4. The risk and reward is favourable.
5. Another good part- The overall sector has shown some decent strength and have good momentum. Also, MFs and Insurance have increased their stake in last Q. (This is a good sign)
I am expecting more from this in coming weeks.
I will buy it with minimum target of 35-40% and then will trail after that.
My SL is at 401.30 rupees.
I will be managing my risk.
TCS On Support Price of 50 Qtrs. Earnings Average Price## **Tata Consultancy Services (TCS) — Share Price Analysis (Feb 2026)**
Below is a clear **technical and price action–based analysis** of TCS stock using recent market behavior, volume activity, and trend structure.
---
## 📊 1️⃣ Current Price Position
* TCS is currently trading around the **₹2,650 – ₹2,750 zone**.
* The stock is significantly below its **52-week high**, indicating a strong correction phase.
* Price is trading near lower yearly levels.
👉 This shows the stock is presently in a **downtrend environment**.
---
## 📉 2️⃣ Price Action Structure
Recent chart behavior shows:
* Formation of **Lower Highs and Lower Lows**.
* Multiple weak pullbacks followed by selling pressure.
* Occasional bounce moves failing near resistance levels.
👉 Buyers are not yet in strong control of the trend.
---
## 📈 3️⃣ Volume Analysis
* Volume increased during price declines.
* Higher volume on falling prices typically signals **distribution** (possible institutional selling).
* Recovery attempts have occurred with relatively lower volume.
👉 Indicates weak buying conviction at current levels.
---
## 🧠 4️⃣ Market Sentiment
Factors influencing price weakness:
* Overall softness in the IT sector.
* Concerns about global tech spending slowdown.
* Uncertainty related to AI-driven business transitions.
* Profit booking after earlier high valuations.
---
## 🔧 5️⃣ Technical Indicator View
* Price trading below major moving averages → Bearish bias.
* RSI in weaker momentum zone.
* No confirmed trend reversal signal yet.
---
## 🧱 6️⃣ Key Support & Resistance Levels
| Level | Significance |
| ------ | -------------------- |
| ₹2,900 | Strong Resistance |
| ₹2,750 | Near-term Resistance |
| ₹2,600 | Immediate Support |
|₹2,500 | Major Support Zone |
---
## 📌 7️⃣ Trader Interpretation
✅ Trend: Downtrend
✅ Volume: Selling pressure confirmed
✅ Sentiment: Weak
✅ Structure: Base formation still developing
👉 A strong close above **₹2,900** would be needed to signal potential trend reversal.
---
## 🔮 Overall Outlook
* **Short Term:** Weak / sideways bias
* **Swing Term:** Base formation phase
* **Long Term:** Gradual accumulation zone may emerge
