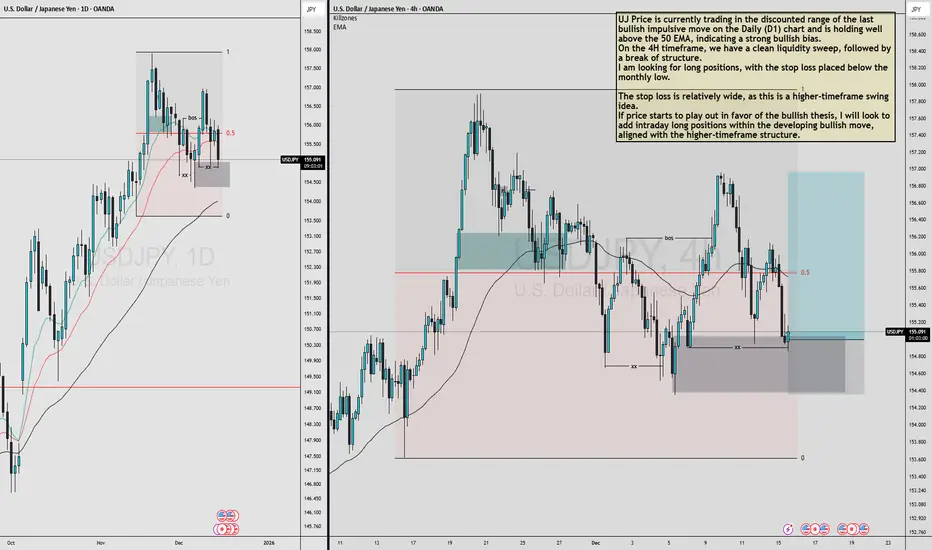
USDJPY MULTI TIMEFRAME ANALYSIS UJ Price is currently trading in the discounted range of the last bullish impulsive move on the Daily (D1) chart and is holding well above the 50 EMA, indicating a strong bullish bias.
On the 4H timeframe, we have a clean liquidity sweep, followed by a break of structure.
I am looking for long positions, with the stop loss placed below the monthly low.
The stop loss is relatively wide, as this is a higher-timeframe swing idea.
If price starts to play out in favor of the bullish thesis, I will look to add intraday long positions within the developing bullish move, aligned with the higher-timeframe structure.
Harmonic Patterns
Candle Patterns 🔹 What Are Candlestick Patterns?
Candlestick patterns are formed by one or more candles on a price chart. Each candle shows:
Open price
High price
Low price
Close price
Candlestick patterns reflect the battle between buyers and sellers within a specific time frame.
🔸 Structure of a Candlestick
Body – Distance between open and close
Wick / Shadow – High and low prices
Bullish Candle – Close > Open
Bearish Candle – Close < Open

Chart Patterns 🔸 What Are Chart Patterns?
Chart patterns are formed by price movements over time. They represent market structure and help traders anticipate breakouts, breakdowns, or reversals.
🔹 Types of Chart Patterns
1️⃣ Reversal Chart Patterns
2️⃣ Continuation Chart Patterns
3️⃣ Neutral Chart Patterns
4️⃣ Bilateral Chart Patterns
🔹 Key Components of Chart Patterns
✔ Trendlines
✔ Support and resistance
✔ Volume confirmation
✔ Breakout strength

Part 2 Candle Stick PatternsOption Expiry Types
Options expire on:
Weekly expiry (popular for indices like NIFTY)
Monthly expiry
Quarterly expiry
As expiry nears:
Premium decay accelerates
Volatility spikes
Price movements become sharper

Part 2 Support and Resistance Option Premium
The option premium is the price paid by the buyer to the seller (writer) of the option.
Premium consists of:
Intrinsic Value – Real value if exercised now
Time Value – Value based on time remaining until expiry
As expiry approaches, time value decreases, a phenomenon known as time decay (Theta).

Part 1 Support and Resistance Put Option Explained
A Put Option gives the buyer the right to sell the underlying asset at a fixed price before or on expiry.
Example:
If NIFTY is trading at 22,000 and you buy a 21,800 Put Option, you expect the market to move down.
If NIFTY falls to 21,500 → You profit
If NIFTY stays above 21,800 → Option may expire worthless
Maximum loss = Premium paid
Profit potential = High but limited
Put options are used when traders are bearish or want to protect their portfolio from downside risk.

Part 12 Trading Master Class Call Option Explained
A Call Option gives the buyer the right to buy the underlying asset at a fixed price (strike price) before or on expiry.
Example:
If NIFTY is trading at 22,000 and you buy a 22,200 Call Option, you expect the market to move up.
If NIFTY goes to 22,400 → You profit
If NIFTY stays below 22,200 → Option may expire worthless
Maximum loss = Premium paid
Profit potential = Unlimited
Call options are generally used when traders are bullish on the market.

Part 11 Trading Master ClassWhat Is an Option?
An option is a derivative contract whose value is derived from an underlying asset such as:
Stocks
Indices
Commodities
Currencies
Each option contract is defined by:
Underlying asset
Strike price
Expiry date
Option premium
There are two main types of options:
Call Option
Put Option

Derivatives Trading SecretsMastering Leverage, Risk, and Market Psychology
Derivatives trading is often seen as a complex and high-risk area of financial markets, reserved only for professionals. However, when understood correctly, derivatives can become powerful tools for profit generation, risk management, and strategic positioning. The real “secrets” of derivatives trading are not hidden formulas or insider tricks, but a deep understanding of leverage, disciplined risk control, market structure, and trader psychology. This article раскрыts the core principles that successful traders consistently apply to gain an edge in derivatives markets.
Understanding the True Nature of Derivatives
Derivatives are financial contracts whose value is derived from an underlying asset such as stocks, indices, commodities, currencies, or cryptocurrencies. Common derivatives include futures, options, and swaps. The first secret of derivatives trading is recognizing that these instruments amplify both opportunity and risk. Because derivatives often require only a margin instead of full capital, traders gain leverage. This leverage magnifies profits, but it also magnifies losses with equal force.
Many beginners focus only on potential returns and overlook how quickly losses can accumulate. Successful traders, on the other hand, treat derivatives as precision instruments. They understand that derivatives are not investments in the traditional sense but tactical tools designed for specific objectives such as hedging, speculation, or arbitrage.
Leverage Is a Double-Edged Sword
One of the most important derivatives trading secrets is knowing how to use leverage responsibly. High leverage is attractive because it allows traders to control large positions with relatively small capital. However, excessive leverage is the primary reason most derivative traders fail.
Professional traders rarely use maximum leverage. Instead, they calculate position size based on acceptable risk per trade, usually limiting losses to a small percentage of total capital. They understand that survival comes first. In derivatives trading, staying in the game long enough is more important than chasing extraordinary gains in a single trade.
The secret lies in controlled leverage—using just enough to enhance returns while maintaining enough margin to withstand normal market volatility.
Risk Management Is the Real Edge
If there is one universal truth in derivatives trading, it is that risk management matters more than strategy. Many traders spend years searching for the perfect setup while ignoring basic risk principles. Successful traders think in probabilities, not certainties.
They define risk before entering a trade by setting stop-loss levels, understanding margin requirements, and planning exit strategies. They also account for gap risk, volatility spikes, and event-driven movements such as earnings, economic data, or policy announcements.
Another key secret is consistency. Instead of risking large amounts on a few trades, disciplined traders risk small, repeatable amounts over many trades. This approach allows the law of large numbers to work in their favor.
Volatility Is a Friend, Not an Enemy
In derivatives markets, volatility is not something to fear—it is something to understand. Futures and options traders, in particular, thrive on volatility. The secret is not predicting direction alone but understanding how volatility impacts pricing.
Options traders focus heavily on implied volatility, time decay, and volatility cycles. They know when to buy options during low volatility and when to sell or structure spreads during high volatility. Futures traders adjust position sizes based on volatility to avoid being shaken out by normal price swings.
Rather than avoiding volatile markets, experienced traders adapt their strategies to changing volatility conditions.
Market Structure and Liquidity Matter
Another often-overlooked secret is the importance of market structure. Liquidity, bid-ask spreads, open interest, and contract specifications play a major role in derivatives trading success. Highly liquid contracts such as index futures or major stock options offer tighter spreads and smoother execution, reducing trading costs.
Professionals prefer liquid markets because they allow quick entry and exit without significant slippage. They also pay attention to rollover dates in futures contracts and changes in open interest to gauge market sentiment and participation.
Understanding how institutions operate within derivatives markets provides insight into price behavior that retail traders often miss.
Timing Is More Important Than Prediction
Many traders believe success depends on predicting market direction accurately. In reality, timing and execution matter far more. Even a correct market view can result in losses if entries and exits are poorly timed.
Derivatives trading secrets include waiting for confirmation, trading with the trend, and aligning multiple time frames. Traders often enter positions when momentum aligns with broader market structure, rather than trying to catch tops and bottoms.
Patience is a hidden advantage. The ability to wait for high-probability setups separates professionals from impulsive traders.
Psychology Determines Long-Term Success
The most powerful secret in derivatives trading lies in the trader’s mindset. Fear, greed, overconfidence, and revenge trading are responsible for most losses. Because derivatives move quickly, emotional mistakes are amplified.
Successful traders develop emotional discipline. They accept losses as part of the business and do not attach ego to individual trades. They follow predefined rules even after a series of losses or wins.
Keeping a trading journal, reviewing mistakes, and focusing on process rather than outcome are common habits among consistently profitable derivatives traders.
Adaptability Is Essential
Markets evolve, and strategies that work today may fail tomorrow. Another critical secret is adaptability. Professional traders continuously monitor market conditions and adjust their strategies accordingly. They know when to be aggressive and when to step back.
They also understand that no single strategy works in all market environments. Trend-following strategies perform well in strong directional markets, while range-bound strategies work better during consolidation phases.
Flexibility and continuous learning keep traders aligned with the market rather than fighting it.
Conclusion
Derivatives trading secrets are not about shortcuts or guaranteed profits. They are about mastering leverage, respecting risk, understanding volatility, and maintaining psychological discipline. Derivatives offer immense potential, but only to those who approach them with preparation, patience, and professionalism.
By focusing on risk management, controlled leverage, market structure, and mindset, traders can transform derivatives from dangerous instruments into powerful tools. In the end, the true secret of derivatives trading is not predicting the market—but managing yourself within it.

Trading the Future of Financial MarketsUnderstanding Futures Contracts
A futures contract is a standardized agreement traded on an exchange. It specifies the underlying asset, quantity, quality, expiration date, and settlement method. Because contracts are standardized, they are highly liquid and transparent. Futures can be settled either by physical delivery (common in commodities like crude oil or agricultural products) or by cash settlement (common in index futures).
One of the defining features of futures trading is leverage. Traders are required to deposit only a fraction of the contract’s total value as margin. This enables participation with relatively lower capital, but it also amplifies both profits and losses. Therefore, futures trading demands a strong understanding of risk management.
Types of Futures Markets
Futures trading spans multiple asset classes:
Commodity Futures: Include agricultural products (wheat, rice, cotton), energy (crude oil, natural gas), and metals (gold, silver, copper).
Equity Index Futures: Such as NIFTY, BANK NIFTY, S&P 500, and Dow Jones futures, which track stock market indices.
Currency Futures: Allow trading in currency pairs like USD/INR or EUR/USD.
Interest Rate Futures: Based on bonds or treasury instruments, widely used by institutional participants.
Each market serves different participants, from farmers and manufacturers hedging price risks to traders seeking short-term opportunities.
Participants in Futures Trading
Futures markets attract a diverse set of participants:
Hedgers use futures to protect against adverse price movements. For example, a farmer may sell futures to lock in crop prices, while an airline may buy fuel futures to hedge fuel costs.
Speculators aim to profit from price fluctuations. They assume risk in exchange for potential returns and provide liquidity to the market.
Arbitrageurs exploit price differences between spot and futures markets or across exchanges to earn low-risk profits.
The interaction of these participants ensures efficient price discovery.
Advantages of Futures Trading
Futures trading offers several advantages:
Leverage allows traders to control large positions with limited capital.
Liquidity ensures easy entry and exit in popular contracts.
Two-way trading enables profit opportunities in both rising and falling markets.
Price discovery helps markets reflect future expectations of supply and demand.
Hedging efficiency provides businesses and investors with tools to manage uncertainty.
These benefits make futures trading attractive, but they also require discipline and knowledge.
Risks Involved in Futures Trading
Despite its advantages, futures trading carries significant risks:
High leverage risk can lead to substantial losses if the market moves against the position.
Margin calls require additional funds if losses exceed initial margins.
Market volatility can cause rapid price swings, especially around economic data or geopolitical events.
Overtrading and emotional decisions often result in poor outcomes for inexperienced traders.
Understanding these risks is essential before entering the futures market.
Futures Trading Strategies
Successful futures trading relies on well-defined strategies:
Trend following focuses on identifying and trading in the direction of prevailing market trends.
Range trading works in sideways markets by buying near support and selling near resistance.
Spread trading involves taking opposite positions in related contracts to reduce risk.
Hedging strategies aim to offset potential losses in spot positions.
Scalping and intraday trading seek small profits from short-term price movements.
Each strategy requires different time horizons, skills, and risk tolerance.
Role of Technical and Fundamental Analysis
Futures traders commonly use both technical and fundamental analysis. Technical analysis involves studying price charts, indicators, and patterns to predict future price movements. Fundamental analysis examines economic data, supply-demand dynamics, interest rates, inflation, and global events. Combining both approaches often leads to better decision-making.
Importance of Risk Management
Risk management is the backbone of futures trading success. This includes setting stop-loss levels, maintaining proper position sizing, avoiding excessive leverage, and diversifying trades. A disciplined trader focuses on capital preservation first, knowing that consistent profits come over time rather than from single trades.
Conclusion
Futures trading is a powerful financial tool that shapes global markets and offers opportunities for hedging and speculation. While it provides high liquidity, leverage, and flexibility, it also demands deep market understanding, emotional discipline, and strict risk control. For traders who invest time in learning market behavior, developing strategies, and managing risk effectively, futures trading can be a valuable component of a long-term trading or investment journey. However, beginners should approach it cautiously, gain experience gradually, and treat futures trading not as gambling, but as a structured and professional market activity.

How News Drives Price Action and Trading DecisionsThe Role of Stock Market News in Trading
Stock market news refers to all information that can impact the valuation, performance, or perception of companies, sectors, or the broader economy. This includes corporate announcements, economic data releases, central bank decisions, geopolitical events, policy changes, and global financial developments. Markets are forward-looking, meaning prices often move based not only on current news but also on expectations of future outcomes.
When news is released, traders quickly reassess risk and reward. Positive news can trigger buying interest, while negative news can spark selling pressure. In highly liquid markets, this reaction can occur within seconds, driven by institutional traders, algorithms, and high-frequency trading systems. Retail traders often react slightly later, which is why understanding news flow is critical to avoid emotional or late entries.
Types of Stock Market News That Affect Trading
One of the most important categories is economic news. This includes data such as GDP growth, inflation numbers, interest rates, employment reports, industrial production, and consumer confidence. For example, higher-than-expected inflation may lead traders to anticipate interest rate hikes, causing selling pressure in equity markets. Conversely, strong economic growth data may boost confidence and push stock prices higher.
Corporate news is another major driver. Quarterly earnings results, revenue guidance, mergers and acquisitions, management changes, share buybacks, and dividend announcements directly affect individual stocks. A company beating earnings expectations often experiences a sharp price rise, while missing estimates can lead to steep declines. Traders closely monitor earnings seasons because volatility tends to increase significantly during these periods.
Central bank and policy-related news has a broad market impact. Decisions by central banks such as interest rate changes, liquidity measures, or policy statements can influence entire indices. In India, announcements from the Reserve Bank of India (RBI) affect banking, real estate, and rate-sensitive sectors. Globally, policies from the US Federal Reserve often impact emerging markets, currencies, and capital flows.
Geopolitical and global news also plays a significant role. Wars, trade tensions, sanctions, elections, and diplomatic developments can cause uncertainty, leading to risk-off behavior in markets. During such times, traders often shift money into safer assets, while equity markets may experience sharp swings.
How News Impacts Market Psychology
Stock market news does not affect prices only through facts; it also influences trader psychology. Markets are driven by fear, greed, hope, and uncertainty. Positive news can create optimism and fear of missing out (FOMO), pushing prices higher than fundamentals might justify in the short term. Negative news can trigger panic selling, even if the long-term impact is limited.
This psychological reaction often leads to overreactions. Skilled traders understand that the first move after news may not always be the best opportunity. Sometimes, prices spike sharply and then retrace as the market digests the information more rationally. Recognizing this behavior helps traders avoid chasing trades and instead wait for confirmation.
News Trading vs Technical Trading
News trading and technical trading are often seen as separate approaches, but in reality, they are deeply connected. News provides the catalyst, while technical analysis shows how price reacts to that catalyst. A strong resistance level may break only after positive news, confirming a bullish breakout. Similarly, bad news near a support zone may cause a breakdown, accelerating a downtrend.
Intraday traders often use news to anticipate volatility and then rely on charts for precise entries and exits. Swing traders may use news to confirm the direction of a trend, while long-term investors use it to reassess fundamentals. The key is not to trade news blindly but to combine it with market structure, volume, and risk management.
Challenges of Trading Based on News
While news creates opportunities, it also carries risks. One major challenge is speed. Institutional traders and algorithms react faster than retail traders, which means the initial move may already be over by the time many traders act. Another challenge is misinterpretation. News headlines can be misleading, and the market reaction may differ from what logic suggests.
There is also the risk of false news or rumors, which can cause temporary price spikes. Traders who react without confirmation may get trapped when prices reverse. Additionally, markets sometimes move in the opposite direction of news due to prior expectations already being priced in. For example, good news may lead to selling if the market expected even better results.
Managing Risk During News-Based Trading
Risk management becomes even more important when trading around news. Volatility can increase spreads, trigger slippage, and hit stop-loss orders quickly. Traders should reduce position size, avoid overleveraging, and be prepared for sudden price swings. Using predefined stop-loss levels and sticking to a trading plan helps protect capital during uncertain conditions.
Some traders prefer to avoid trading during major news releases, while others specialize in news-driven strategies. Both approaches are valid, as long as the trader understands their risk tolerance and skill level.
Importance of Staying Informed
Successful traders maintain a habit of staying informed through reliable sources such as financial news platforms, exchange announcements, and official economic calendars. However, information overload can be harmful. The goal is not to follow every headline but to focus on news that is relevant to the markets and instruments being traded.
Understanding the context of news is equally important. A single data point should be viewed within the broader economic and market environment. This helps traders make balanced decisions rather than reacting emotionally.
Conclusion
Stock market news is a powerful force in trading, shaping price movements, market sentiment, and volatility. Whether it is economic data, corporate earnings, policy decisions, or global events, news acts as a catalyst that drives market behavior. For traders, the key lies in understanding not just the news itself, but how the market reacts to it.
By combining news awareness with technical analysis, disciplined risk management, and emotional control, traders can turn information into opportunity. Instead of fearing news-driven volatility, skilled traders learn to respect it, prepare for it, and use it wisely as part of a well-rounded trading strategy.
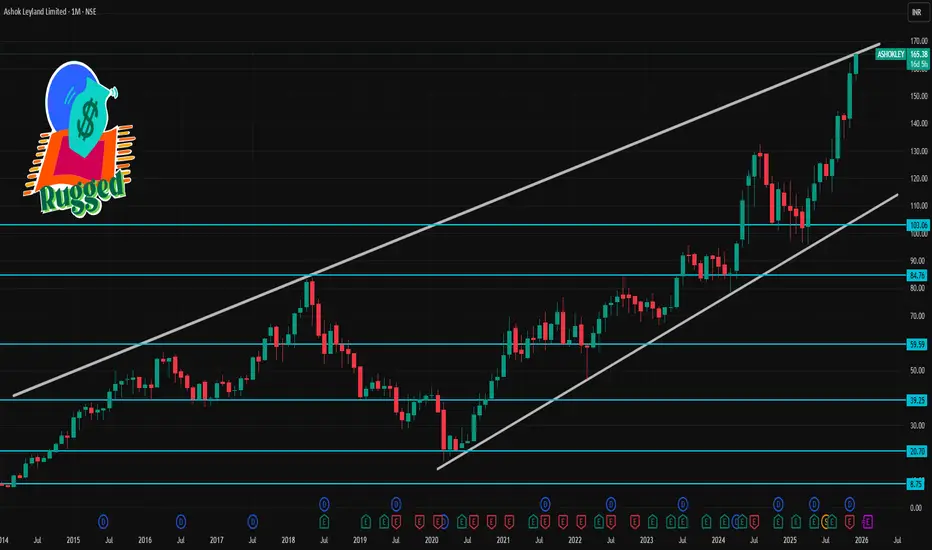
ASHOKLEY 1 Month Time Frame 📊 Current Price & Trend (as of latest market close)
Current trading level: ~₹163‑164 on NSE.
Price has rallied strongly and recently hit a 52‑week/all‑time high.
📈 1‑Month Key Levels (Short‑Term Technicals)
🔹 Immediate Resistance (Upside Targets)
R1 ~ ₹165‑167: Short‑term pivot resistance zone.
R2 ~ ₹167‑170: Key near‑term resistance above current.
R3 ~ ₹170‑176: Stronger upside area (if momentum continues).
🔻 Immediate Support (Downside Floors)
S1 ~ ₹161: Nearest short‑term support.
S2 ~ ₹158: Stronger support zone if price tests lower.
S3 ~ ₹156: Major initial support level before deeper pullback.
🧠 What This Means for 1‑Month Outlook
Bullish case (short term):
Holding above ₹158–161 supports continuation.
Clear break above ₹170–176 with strong volume could extend moves toward new highs.
Bearish/Neutral case:
Failure below ₹156–158 puts pressure on short‑term trend.
RSI nearing overbought suggests a possible pullback or consolidation first.
PARAGMILK 1 Week Time Frame 📌 Current Price (approx)
~₹315 – ₹320 on NSE (latest trading range)
📊 Weekly Time‑Frame Levels
🔹 Key Weekly Pivot & Levels
These are useful for the next few sessions (week):
Weekly Pivot Point (approx): ~₹318 – ₹320 (central reference for trend this week)
Weekly Support Levels:
S1: ~₹295 – ₹300
S2: ~₹283 – ₹288
S3: ~₹260 – ₹275 (deeper support if heavy pullback)
Weekly Resistance Levels:
R1: ~₹323 – ₹326
R2: ~₹331 – ₹335
R3: ~₹350 – ₹355 (secondary target zone)
(Pivot & weekly support/resistance based on aggregated pivot frameworks)
🔸 Short‑Term/Weekly Trading Zones
Bullish Scenario (uptrend holds):
✔ Stay above ₹320‑318 → next upside targets
→ ₹326‑₹331 (near‑term resistance)
→ ₹345‑₹350+ (medium‑term / breakout target)
Bearish Scenario (correction):
❌ Drop below ₹300‑295 → next support zone
→ ₹283‑₹288
→ ₹260‑₹275 (deeper demand zone)
📉 Simple Pivot Levels (Daily/Shorter)
Daily pivot range for context this week:
R1 ~₹311–₹315
R2 ~₹315–₹320
R3 ~₹320–₹325
S1 ~₹302–₹305
S2 ~₹297–₹300
S3 ~₹292–₹295
(Classic pivot ranges also align with weekly S1/S2)
📅 What to Watch This Week
🔹 Hold above ₹318–₹320: strengthens bullish outlook
🔹 Break below ₹295: possible deeper correction
🔹 Volume & daily closes: confirm breakout or reversal

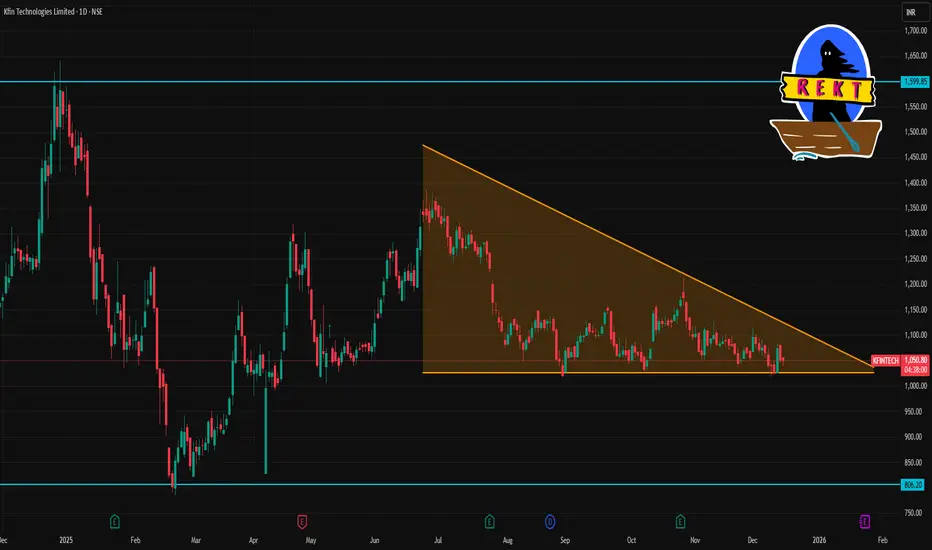
KFINTECH 1 Day Time Frame 📌 Live Price Context
Current price: ~₹1,051.7 on NSE (latest update)
Today’s range: ~₹1,045.6 (low) — ₹1,081.5 (high)
📊 Daily Pivot Support & Resistance (Accurate Today)
Level Price (₹)
R3 ₹1,109.50
R2 ₹1,095.50
R1 ₹1,073.60
Pivot ₹1,059.60
S1 ₹1,037.70
S2 ₹1,023.70
S3 ₹1,001.80
📌 Key Levels to Watch Today
🔺 Upside Resistances
Immediate resistance: ~₹1,073–₹1,095
Strong resistance area: ~₹1,095–₹1,109
🔻 Downside Supports
Near support: ~₹1,037–₹1,023
Lower support zone: ~₹1,001 and below
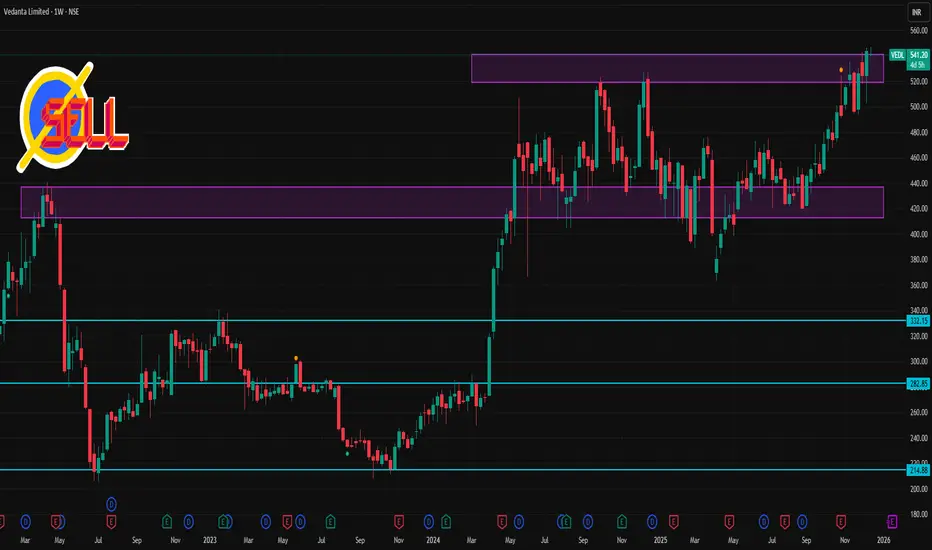
VEDL 1 Week Time Frame📍 Live price context
Vedanta is trading around ₹540 + on NSE.
📊 Weekly (1‑Week Timeframe) Key Levels
🧱 Resistance Levels (Upside)
These are levels where price may face selling pressure / struggle to break above:
R1: ~₹548 – ₹553 — short‑term technical resistance zone.
R2: ~₹555 – ₹560 — broader upside/wider resistance (weekly chart often reflects overhead supply near recent highs).
R3: ~₹565 + — psychological/upper projection zone if momentum continues.
📉 Support Levels (Downside)
Key floors where price may find buying interest / bounce:
S1: ~₹536 – ₹538 — immediate weekly support near pivot area.
S2: ~₹530 – ₹532 — next support cluster on weekly pivot levels.
S3: ~₹525 – ₹526 — deeper weekly support if price corrects further.
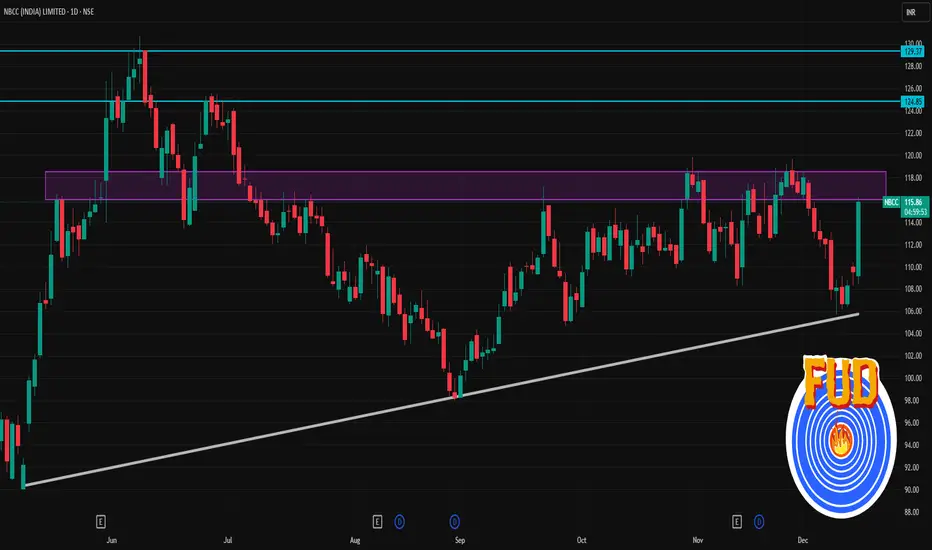
NBCC 1 Day Time Frame 📊 Daily Levels (1D Timeframe)
Current approximate price: ~₹108-110 on NSE (recent session data)
📈 Resistance Levels
R1: ~₹108.7–110.3 (intraday pivot/Bollinger & near recent highs)
R2: ~₹112.3 (upper BB)
R3: ~₹113+ & above recent short-term zone highs
Important psychological/near-term resistances to watch: ~₹112–115 area (previous consolidation zone).
📉 Support Levels
S1: ~₹106.3–106.9 (near pivot S2/Bollinger)
S2: ~₹105.3 (pivot S3 area)
S3: ~₹98–100 (broader confirmed support from recent ranges)
Below ~₹105, structure weakens toward the ~₹98 area, which has acted as support in prior daily ranges.
Managing Trading Risk: Foundation of Long-Term Market SuccessUnderstanding Trading Risk
Trading risk refers to the possibility of losing capital due to unfavorable market movements, poor decisions, or unexpected events. Every trade carries risk, whether in stocks, derivatives, forex, or crypto markets. Market volatility, news events, economic data, and geopolitical factors can cause sudden price fluctuations. A trader’s goal is not to eliminate risk—because that is impossible—but to control and manage it effectively.
Risk management begins with accepting that losses are inevitable. Many beginners enter the market focusing only on profits, ignoring the downside. This mindset often leads to emotional trading, oversized positions, and account blow-ups. Professional traders, on the other hand, think first about how much they can lose before considering how much they can gain.
Capital Preservation Comes First
The primary objective of risk management is capital preservation. Without capital, there is no opportunity to trade. A trader who loses 50% of their account needs a 100% return just to break even. This mathematical reality highlights why controlling losses is more important than chasing big gains.
Successful traders usually risk only a small percentage of their total capital on a single trade, commonly between 1% and 2%. This approach ensures that even a series of losing trades does not significantly damage the trading account. Preserving capital provides the psychological confidence to continue trading rationally rather than emotionally.
Position Sizing and Risk Per Trade
Position sizing is one of the most powerful risk management tools. It determines how many shares, contracts, or lots to trade based on account size and risk tolerance. Proper position sizing aligns the potential loss of a trade with predefined risk limits.
For example, if a trader has a capital of ₹10,00,000 and decides to risk 1% per trade, the maximum loss allowed per trade is ₹10,000. Based on the stop-loss distance, the trader calculates the appropriate position size. This systematic approach removes guesswork and emotional bias from trading decisions.
Ignoring position sizing often leads to overtrading and excessive exposure. Even a high-probability setup can fail, and oversized positions can turn small mistakes into catastrophic losses.
The Role of Stop-Loss Orders
A stop-loss is a predefined price level at which a losing trade is exited automatically. It acts as a safety net, limiting losses and protecting capital. Using stop-loss orders is not a sign of weakness but a mark of discipline and professionalism.
Effective stop-loss placement is based on market structure, volatility, and technical levels rather than arbitrary values. Stops placed too tight may result in frequent premature exits, while stops placed too wide may expose the trader to unnecessary losses. A well-planned stop-loss balances risk control with market behavior.
More importantly, traders must respect their stop-losses. Moving or removing a stop-loss due to hope or fear often leads to larger losses. Discipline in executing stop-losses is essential for consistent performance.
Risk-to-Reward Ratio
The risk-to-reward ratio compares the potential loss of a trade to its potential profit. A favorable risk-to-reward ratio ensures that even if a trader is right only a portion of the time, they can still be profitable.
For instance, a 1:2 risk-to-reward ratio means risking ₹1 to make ₹2. With this ratio, a trader can be profitable even with a win rate below 50%. Focusing on high-quality setups with positive risk-to-reward characteristics helps traders avoid overtrading and low-probability opportunities.
However, risk-to-reward should not be viewed in isolation. It must align with the trader’s strategy, market conditions, and realistic profit targets.
Emotional and Psychological Risk Management
Risk management is not only technical but also psychological. Fear, greed, overconfidence, and revenge trading are major contributors to trading losses. Emotional decisions often lead to breaking rules, increasing position sizes impulsively, and holding losing trades for too long.
Developing a trading plan and strictly following it reduces emotional interference. A clear plan defines entry rules, exit rules, risk limits, and trade management guidelines. Journaling trades and reviewing mistakes also helps traders identify emotional patterns and improve discipline over time.
Maintaining realistic expectations is another key aspect of psychological risk management. Markets do not provide consistent profits every day. Accepting drawdowns as part of the process helps traders stay calm and focused.
Diversification and Exposure Control
Diversification reduces risk by spreading exposure across different instruments, sectors, or strategies. Relying heavily on a single stock, asset class, or market condition increases vulnerability to unexpected events.
However, diversification should be meaningful. Holding multiple positions that are highly correlated does not significantly reduce risk. Traders must monitor overall exposure, especially during volatile periods, to avoid excessive concentration.
Adapting Risk to Market Conditions
Market conditions are dynamic. Volatility levels, liquidity, and trend strength change over time. Effective risk management requires flexibility. During high-volatility periods, reducing position size or tightening risk limits can protect capital. In stable market environments, traders may cautiously increase exposure within predefined limits.
Ignoring changing conditions and applying the same risk approach blindly can lead to unnecessary losses. Adaptability is a hallmark of experienced traders.
Conclusion
Managing trading risk is the backbone of sustainable success in financial markets. It is not about avoiding losses but about controlling them intelligently. Through capital preservation, proper position sizing, disciplined stop-loss usage, favorable risk-to-reward ratios, emotional control, and adaptability, traders can survive market uncertainty and grow steadily over time.
In the long run, consistent risk management matters more than finding the perfect strategy. Markets reward discipline, patience, and respect for risk. Traders who master risk management build resilience, confidence, and the foundation for lasting profitability.

Weekly Forecast: XAUUSD May Continue Upward Towards 4,500XAU/USD is showing positive signs, with the price potentially rising from around 4,295. The market could experience a temporary pullback to 4,180, but if the upward trend remains intact, the price might continue rising towards 4,500.
The current market movement suggests a bullish outlook, with consistent upward momentum. Recently, the price has moved out of a high-activity zone, signaling potential for further growth. If the trend continues, the price could keep pushing higher, as the support zone holds strong and the momentum remains positive.
The gap between recent price levels suggests there is room for upward movement before reaching the next major resistance area. Price action and trendlines both indicate that the market could extend its rise, with strong support levels holding the price in place. This creates an opportunity to capitalize on the next phase of the movement if the market maintains its current trajectory.
However, if the price does experience a dip, the 4,180 level may act as support and could lead to a reversal. With the overall bullish trend in play, there is potential for a continuation towards 4,500 once the market resumes upward movement.

XAUUSD GOLD Analysis on Weekly#XAUUSD UPDATEDE
Current price - 4299
Buy Limited - 4280-4270
If price stay above 4252 then next target ,4330,4350 and 4380 and below that 4220
Plan;If price break 4280-4270 area,and stay above 4280,we will place buy order in gold with target of 4330,4350 and 4380 & stop loss should be placed at 4252

Coal India Ltd (COALINDIA) - Technical Price AnalysisThis analysis outlines key critical levels that, if breached or defended, could signal significant shifts in the stock's trend, moving into either a strong bullish or bearish phase.
🐂 Bullish Scenario : Upside Potential
The stock is considered to enter a confirmed bullish trajectory when it can trade and sustain above the initial breakout level of 359.
Initial Bullish Confirmation (Above 359): A sustained move above $359 (allowing for a slight buffer, perhaps to confirm strength) would likely trigger the first major rallies.
First Target Zone : The immediate upside goals are identified within the range of 443 to 475.
Stronger Bullish Momentum (Above 475): If the price successfully consolidates and moves past the 475 mark, this indicates a significantly strong continuation of the rally.
Secondary Target Zone : The next substantial resistance area would be between 568 and 645.
Long-Term Breakout : Achieving and maintaining levels above 645 would suggest a major structural shift in the stock's valuation.
Extended Targets : The ultimate long-term targets under this powerful bullish impulse are projected to be between 832 and 993
🐻 Bearish Scenario : Downside Risk
The stock's outlook turns bearish if it fails to hold a critical support level, suggesting selling pressure is dominating the market.
Initial Bearish Confirmation (Below 321): The key support level to watch is 321. If the stock closes below 321 (allowing for a buffer) and sustains this for 2-3 trading days, a confirmed bearish trend is established
First Support Test : The immediate downside target after the breach is 281. This level is critical and may attract buyers, potentially leading to a temporary bounce.
Accelerated Bearish Momentum (Below 281): A decisive break and close below 281 would indicate that sellers are firmly in control.
Secondary Support Test : The market would then likely test the next major support around 224.
Last Hope Support : The final significant support level, which represents a crucial long-term floor for the stock, is identified at 181. A break below this point would signal a severe and sustained long-term downtrend.
Note on Buffer Points : The analysis emphasizes the need to consider a small buffer ( a percentage variation) above or below the stated levels. This buffer helps confirm that the move is not just a temporary fluctuation or 'false breakout,' but a genuine change in market sentiment before entering or exiting a position
Please do your due diligence before trading or investment.
**Disclaimer -
I am not a SEBI registered analyst or advisor. I does not represent or endorse the accuracy or reliability of any information, conversation, or content. Stock trading is inherently risky and the users agree to assume complete and full responsibility for the outcomes of all trading decisions that they make, including but not limited to loss of capital. None of these communications should be construed as an offer to buy or sell securities, nor advice to do so. The users understands and acknowledges that there is a very high risk involved in trading securities. By using this information, the user agrees that use of this information is entirely at their own risk.
Thank you.

Part 10 Trade Like Institutions Role of Option Greeks
Option Greeks help traders measure risk:
Delta: Sensitivity to price movement.
Gamma: Rate of change of delta.
Theta: Impact of time decay.
Vega: Sensitivity to volatility.
Rho: Sensitivity to interest rates.
Understanding Greeks enables better strategy selection and position adjustment.

Part 9 Trading master ClassRisk Management in Option Trading
Successful option traders focus heavily on risk control:
Use defined-risk strategies.
Limit position size per trade.
Avoid overleveraging.
Understand option Greeks (Delta, Gamma, Theta, Vega).
Maintain discipline with stop-loss and exit rules.
Risk management is often more important than strategy selection.

Part 8 Trading Master Class Rewards of Option Trading
Despite risks, options offer compelling advantages:
a) Limited Risk (for Buyers)
Option buyers know their maximum loss upfront—the premium paid.
b) High Return Potential
Small price movements in the underlying can result in substantial percentage gains.
c) Income Generation
Option sellers can generate consistent income through strategies like covered calls and iron condors.
d) Flexibility
Options allow traders to profit in bullish, bearish, or range-bound markets.
e) Capital Efficiency
Options require lower capital compared to buying underlying assets outright.
