XAUUSD GOLD Analysis on (11/12/2025)#XAUUSD UPDATEDE
Current price - 4213
If price stay below 4240, then next target 4190,4162 and 4146 above that 4270
Plan;If price break 4214-4218 area, and stay below 4214, we will place sell order in gold with target of 4190,4162 and 4146 & stop loss should be placed at 4270
Harmonic Patterns

NIFTY- Intraday Levels - 12th December 2025If NIFTY sustain above 25912/58 above this bullish then around 25991/98 above more bullish above this wait more levels marked on chart
If NIFTY sustain below 25863 below this bearish then 25842/27/12 below this more bearish then 25758/28 below this wait more levels marked on chart
My view :-
"My viewpoint, offered purely for analytical consideration, The trading thesis is: Nifty (bearish tactical approach: sell on rise)
This analysis is highly speculative and is not guaranteed to be accurate; therefore, the implementation of stringent risk controls is non-negotiable for mitigating trade risk."
Consider some buffer points in above levels.
Please do your due diligence before trading or investment.
**Disclaimer -
I am not a SEBI registered analyst or advisor. I does not represent or endorse the accuracy or reliability of any information, conversation, or content. Stock trading is inherently risky and the users agree to assume complete and full responsibility for the outcomes of all trading decisions that they make, including but not limited to loss of capital. None of these communications should be construed as an offer to buy or sell securities, nor advice to do so. The users understands and acknowledges that there is a very high risk involved in trading securities. By using this information, the user agrees that use of this information is entirely at their own risk.
Thank you.

Part 6 Learn Institutional Trading Buyers vs. Sellers
Option Buyers
Pay premium.
Limited risk (premium only).
Unlimited reward potential.
Low probability of profit (because time decay erodes premium).
Option Sellers (Writers)
Receive premium.
Limited profit (premium only).
Can face huge losses.
High probability of profit (because time decay works in their favor).
Professional traders often prefer selling options, but with strict risk management.

Candle Pattern Practical Tips for Using Candlestick Patterns
Combine with Trend Analysis:
Always consider the prevailing trend. A reversal pattern is more meaningful if it aligns with trend exhaustion signals.
Confirm with Volume:
Higher volume strengthens the validity of candlestick signals.
Use with Technical Indicators:
Combine patterns with moving averages, RSI, MACD, or Fibonacci levels for more reliable entries and exits.
Time Frame Matters:
Patterns are more reliable on higher time frames (daily, weekly) than lower ones (1-minute, 5-minute).
Avoid Over-reliance:
No candlestick pattern guarantees success. Always manage risk with stop-losses and position sizing.

Part 3 Learn Institutional Trading Why Do People Trade Options?
Traders use options for three main reasons:
a) Hedging
To protect their portfolios from losses.
Example: If you own shares and fear a price drop, you can buy put options to act as insurance.
b) Speculation
To profit from price movements using small capital.
Options allow traders to control large positions for a fraction of the cost.
c) Income Generation
By selling options, traders can earn premium income regularly.

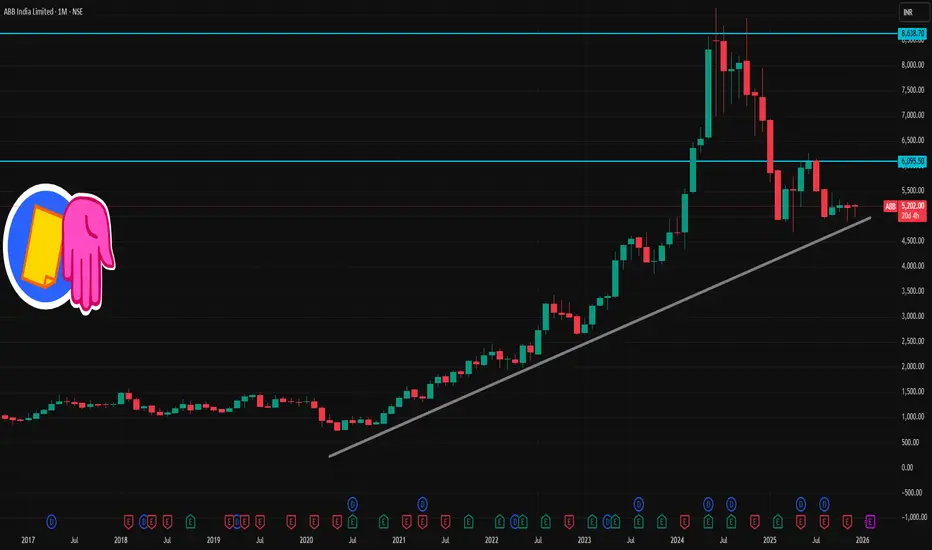
ABB 1 Month Time Frame 📌 Current Snapshot
Latest price — ~ ₹ 5,200–₹ 5,210 (most recent quoted range)
52‑week range: ~ ₹ 7,960 (high) / ₹ 4,684–4,590 (low)
✅ What Traders Might Watch Today / Very Short Term
If price holds above ₹ 5,190–5,210, bias might be slightly positive — see if it tests ₹ 5,260–5,280 (R1).
A drop below ₹ 5,120 could trigger slide toward ₹ 5,110 or even test support around ₹ 5,145 (S1).
A clean breakout above ₹ 5,280 (especially with good volume) may open move toward ₹ 5,320–5,350 (R2).
If broader market turns negative, ₹ 5,110–5,145 zone is a key alert/support area.
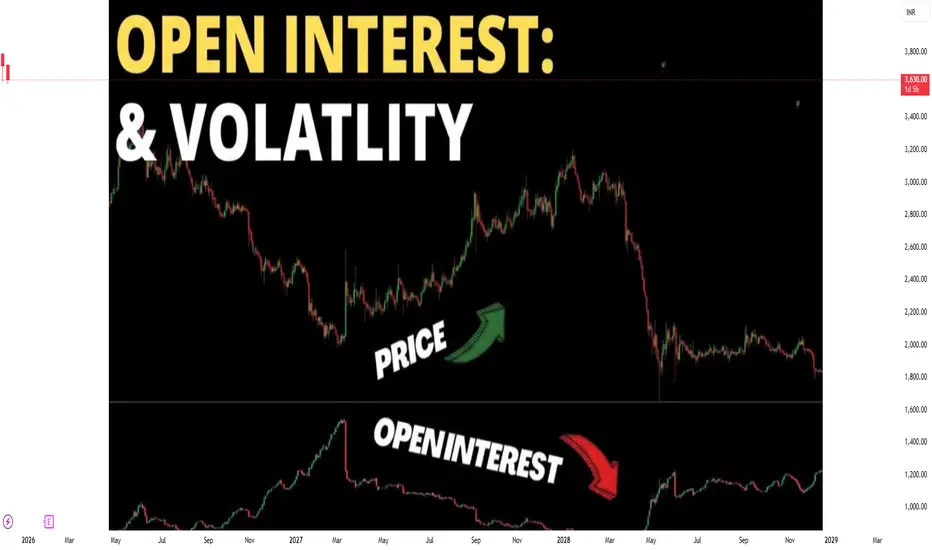
Understanding Open Interest and Volatility1. Open Interest: Definition and Significance
Open interest (OI) refers to the total number of outstanding derivative contracts, such as futures or options, that have not been settled or closed. Unlike trading volume, which measures the number of contracts traded during a specific period, open interest reflects the accumulation of positions in the market.
Key Points about Open Interest:
Indicator of Market Participation:
High open interest suggests a liquid and active market with many participants. Conversely, low open interest can indicate a less active market, where prices may be more susceptible to manipulation or sudden moves.
Trading Strategy Implications:
Trend Confirmation: Rising open interest along with rising prices typically confirms an uptrend. Similarly, rising open interest with falling prices can confirm a downtrend.
Potential Reversals: If open interest decreases while prices continue in the same direction, it may signal a weakening trend and a potential reversal.
Example:
Suppose in Nifty 50 call options, there are 50,000 outstanding contracts for a specific strike price. This is the open interest. If traders open 5,000 new contracts and close 2,000, the updated open interest becomes 53,000.
Types of Open Interest Changes:
Increase in OI with Price Increase: Indicates strong buying and bullish sentiment.
Increase in OI with Price Decrease: Suggests strong selling and bearish sentiment.
Decrease in OI with Price Increase/Decrease: Often shows traders are closing positions, which could signal market consolidation or a trend reversal.
2. Volatility: Definition and Types
Volatility measures the degree of variation of a financial instrument's price over time. It represents uncertainty or risk in price movements and is a fundamental concept in trading, risk management, and option pricing.
Types of Volatility:
Historical Volatility (HV):
It is calculated based on past price movements over a specific period. It indicates how much an asset's price fluctuated in the past.
Historical Volatility
=
Standard Deviation of Price Returns
Historical Volatility=Standard Deviation of Price Returns
Implied Volatility (IV):
Implied volatility is derived from the market price of options. It reflects the market’s expectations of future price fluctuations. High IV indicates the market expects large price movements, while low IV indicates relative calm.
Realized Volatility:
The actual volatility observed during a particular period. This is often compared with implied volatility to assess whether options are overvalued or undervalued.
Significance of Volatility:
Risk Assessment: Higher volatility implies higher risk and potential reward, which is critical for traders and risk managers.
Option Pricing: Volatility is a key input in the Black-Scholes and other option pricing models. Options tend to be more expensive when volatility is high.
Market Sentiment Indicator: Sudden spikes in volatility often reflect uncertainty, news events, or economic shocks.
Example:
If the Nifty 50 index fluctuates between 19,500 and 20,500 over a month, the volatility is measured based on the degree of these price changes. If options on Nifty reflect high implied volatility, traders expect further large swings.
3. Relationship Between Open Interest and Volatility
Open interest and volatility are interconnected in multiple ways:
Market Sentiment Indicator:
Rising open interest accompanied by rising volatility often signals that traders are aggressively taking positions in anticipation of significant price movements.
Liquidity and Price Swings:
Higher open interest can provide better liquidity, which may reduce short-term volatility. Conversely, in low-OI markets, even small trades can lead to sharp price swings.
Option Strategies:
In options trading, the interplay between open interest and implied volatility is crucial:
High OI + High IV = Liquid market but potentially expensive options.
Low OI + High IV = Less liquidity, more risk for entering/exiting trades.
Trend Analysis:
Traders often use the combination of price trend, open interest, and volatility to confirm trends or identify potential reversals.
4. Practical Applications in Trading
A. Futures and Options Trading:
Traders monitor open interest to identify which strike prices have the most open contracts, often referred to as "max pain" points, indicating potential support and resistance levels.
Implied volatility helps in deciding whether to buy or sell options. High IV may favor selling options, while low IV may favor buying options.
B. Risk Management:
Portfolio managers use volatility metrics to assess Value at Risk (VaR) and adjust positions accordingly.
Open interest provides insights into market exposure and liquidity, critical for managing large positions.
C. Intraday and Swing Trading:
Intraday traders often track sudden changes in open interest and volatility to anticipate short-term price moves.
Swing traders use historical volatility to set stop-loss levels and profit targets.
5. Indicators and Tools for Open Interest and Volatility
Open Interest Indicators:
Open Interest Analysis Charts: Show changes in OI for specific contracts.
Put-Call Ratio (PCR) with OI: Helps in gauging market sentiment for options.
Volatility Indicators:
Bollinger Bands: Uses standard deviation to gauge price volatility.
Average True Range (ATR): Measures the average movement of prices over a period.
VIX Index: Measures market-wide expected volatility (e.g., India VIX for Nifty options).
6. Challenges and Misconceptions
Open Interest is not directional: It only shows the number of contracts, not whether the market is bullish or bearish. Context with price movement is essential.
Volatility can be misleading: High volatility does not always imply a falling market; it may also indicate strong upward movements.
Interpreting both together: Correct interpretation requires combining price trends, OI changes, and volatility levels; isolated analysis can lead to false signals.
7. Conclusion
Open interest and volatility are pillars of market analysis for both retail and institutional traders. Open interest provides insight into market participation, liquidity, and potential trend strength, while volatility gauges price fluctuations, market risk, and option pricing dynamics. Together, they help traders:
Confirm trends and anticipate reversals.
Assess market sentiment and liquidity.
Strategize option trades based on risk and reward.
Make informed decisions in futures, options, and stock markets.
A successful trader combines these metrics with technical and fundamental analysis to navigate financial markets effectively. Ignoring either can lead to incomplete understanding and potential losses. Mastery of open interest and volatility allows traders to anticipate market moves, manage risk, and exploit opportunities systematically.
Part 2 Ride The Big Moves What Are Options?
An option is a financial contract that gives the buyer the right, but not the obligation, to buy or sell an underlying asset at a pre-decided price within a specific time.
There are two types of options:
Call Option – Gives the right to buy the asset at a fixed price.
Put Option – Gives the right to sell the asset at a fixed price.
The fixed price is known as the strike price, and the deadline to exercise the option is called the expiry date.

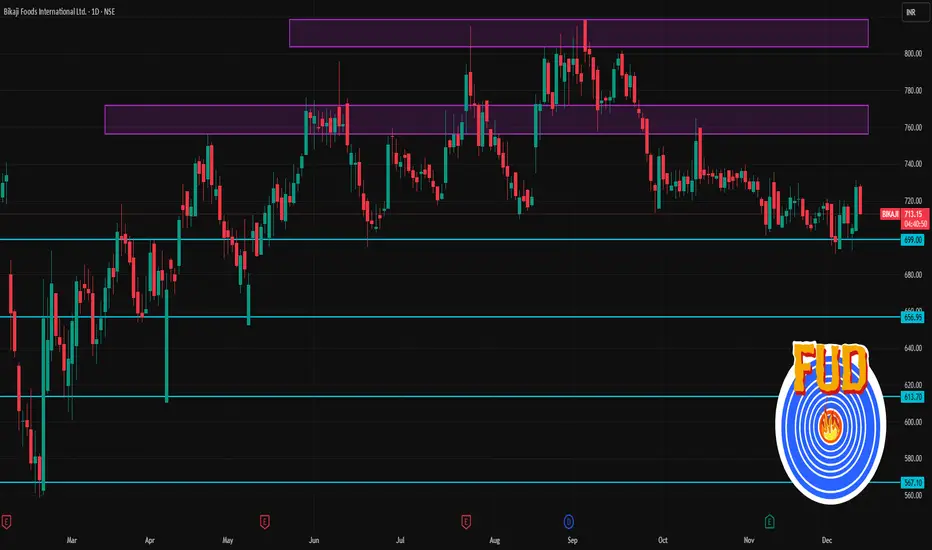
BIKAJI 1 Day Time Frame 📈 Recent Price & Basic Info
Latest price (NSE / BSE) ~ ₹725.60 (close on 10-Dec-2025)
Day’s range: ~ ₹703.90 to ₹731.15.
52-week range: ₹558.80 (low) to ~ ₹864.00 (high)
🧭 Support / Resistance / Pivot-based Levels (Daily)
From pivot-analysis (classic / Fibonacci / others) :
Pivot / Level Price (₹) / Range
Pivot (daily) ~ ₹724.95
Support 1 (S1) ~ ₹722–723 — near pivot
Resistance 1 (R1) ~ ₹727–728
Upper zones / Higher resistances (R2/R3) ~ ₹729–732
Indicative lower support zones (if price dips) ~ ₹699–¥690+
XAUUSD MULTI TIMEFRAME ANALYSIS Watching Gold for potential longs. Last two days have bounced nicely off the 10–20 EMAs, and even though the weekly bias is still bearish, price looks like it wants to push toward last week’s high (which isn’t cleared yet). On the 1H, the setup is clean — sweep, BOS, and an FVG, with Asian session giving a pullback into the zone. The only concern is Gold is still stuck in a choppy range, and this setup performs way better in trending conditions. If the market genuinely wants to take the previous weekly high, this should play out. Waiting to see how it unfolds.
Setup Quality ⭐⭐⭐⭐

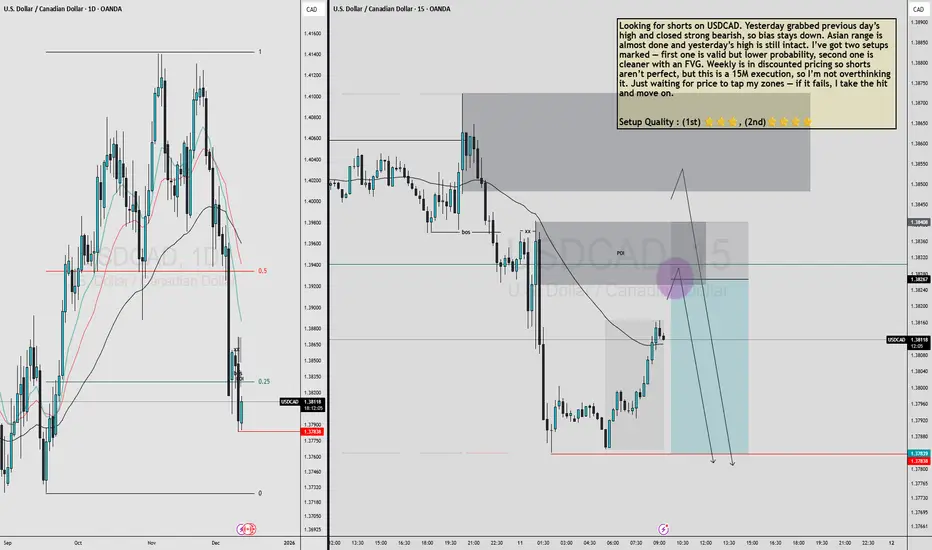
USDCAD MULTI TIMEFRAME ANALYSIS Looking for shorts on USDCAD. Yesterday grabbed previous day’s high and closed strong bearish, so bias stays down. Asian range is almost done and yesterday’s high is still intact. I’ve got two setups marked — first one is valid but lower probability, second one is cleaner with an FVG. Weekly is in discounted pricing so shorts aren’t perfect, but this is a 15M execution, so I’m not overthinking it. Just waiting for price to tap my zones — if it fails, I take the hit and move on.
Setup Quality : (1st) ⭐⭐⭐, (2nd)⭐⭐⭐⭐
NIFTY- Intraday Levels - 11th December 2025If NIFTY sustain above 25758/61 then 25777/83 above this bullish then around 25814/26/31 above more bullish around 25895/25923 above this wait more levels marked on chart
If NIFTY sustain below 25728/16/11 below this bearish then 25666/54/49 support below this more bearish more levels marked on chart
Consider some buffer points in above levels.
Please do your due diligence before trading or investment.
**Disclaimer -
I am not a SEBI registered analyst or advisor. I does not represent or endorse the accuracy or reliability of any information, conversation, or content. Stock trading is inherently risky and the users agree to assume complete and full responsibility for the outcomes of all trading decisions that they make, including but not limited to loss of capital. None of these communications should be construed as an offer to buy or sell securities, nor advice to do so. The users understands and acknowledges that there is a very high risk involved in trading securities. By using this information, the user agrees that use of this information is entirely at their own risk.
Thank you.

$LUNA Finally Catching a breath After Brutal Red Days VIE:LUNA Finally Catching a breath After Brutal Red Days 😮💨
From Bloodbath to Bounce:
🔴 -99.88% massacre (RIP portfolios)
🟢 Now +286% relief at $0.23 From $0.06415 within 21 Days
▶️Major Downtrend line overhead
Major resistance at $0.30-0.38 ahead.
Potential bottom formation or dead cat bounce?
Recovery or bull trap? Time will tell 🤔
EXTREMELY HIGH RISK asset - trade with caution
Not financial advice | DYOR

$BONK Technical Analysis Update by CryptopatelSIX:BONK Technical Analysis Update by Cryptopatel
Current Structure:
SIX:BONK has broken key support at $0.00001 and is currently retesting the level.
Red zone: $0.000010 – $0.00001125.
Price below this zone = bearish, high probability of testing Bullish Order Block between $0.00000450 – $0.00000350, which is the prime accumulation area.
Retracement Outlook:
If SIX:BONK fails to reclaim $0.00001, expect 50%–70% retracement in the next few weeks.
Bullish Flip:
Key breakout required: $0.00001250.
Closing above this Red box signals super bullish momentum, potential 200%–400% upside.
Trade Watch:
Red zone $0.000010–$0.00001125 = critical level to enter trades.
Monitor price reaction at Bullish Order Block for optimal accumulation.
Summary:
Below $0.00001 → Bearish / accumulation phase
Above $0.00001250 → Super bullish breakout
TA Edge: Discipline on zones + clear breakout confirmation = key to maximizing gains.
NFA & DYOR

Part 2 Intraday Trading Master Class Risk-Management Tips
Even the best strategy fails without discipline. Here’s the real game:
Avoid unlimited risk strategies early in your journey.
Never sell naked options without proper hedging.
Always size positions correctly—use only what you can afford to lose.
Monitor volatility (VIX, IV) before entering.
Know your exit even before you enter a trade.

360 ONE – Daily Chart Analysis & Bullish Projection360 ONE is approaching a major breakout zone after forming a strong higher-low structure. The price has repeatedly held important support levels and is now pushing toward a multi-month resistance, indicating strong buildup for a swing breakout.
Key Levels From the Chart
Buy Above / Early Swing Entry
₹1,194
– This is the resistance breakout zone
– A daily close above this triggers a fresh momentum leg
– Strong volume confirmation preferred
Support / Stop-Loss Zone
₹1,110 – ₹1,113
– This is the nearest structural support
– Rejection candles have formed here earlier
– Breakdown below this invalidates the bullish setup
Upside Targets
Primary Target
₹1,296 – ₹1,300
– First major resistance after breakout
– Aligns with previous supply zone
– Ideal for partial booking
Swing Target
₹1,600
– Full extension target
– Matches the broader structure measured-move
– Achievable if market remains supportive and momentum sustains
Trade Plan Summary
Buy Above: ₹1,194
Stop-Loss: ₹1,110
T1: ₹1,296
T2 (Swing): ₹1,600
Bias: Bullish as long as the price stays above ₹1,110.
Breakout Strength: A daily close above ₹1,194 with strong volume confirms the swing continuation.
Disclaimer: aliceblueonline.com

Time to play with NattyLook for buying opportunity today. I doubt it will come but if it comes to 407 it's a straight buying opportunity. Even at 408/404. Fib Retracement it will not break. One can trade with big quantities.

Part 1 Intraday Trading Master Class How Option Trading Works
Let’s break it down simply:
1. Choose the Direction
Are you bullish or bearish?
Bullish → Buy Call or Sell Put
Bearish → Buy Put or Sell Call
2. Choose the Strike Price
Pick ITM, ATM, or OTM based on your style and risk.
3. Select Expiry
Weekly expiries are popular for index trading
Monthly expiries suit swings and positional trades
4. Enter & Exit the Trade
You don’t have to wait until expiry.
Most traders exit early based on target and stop-loss.

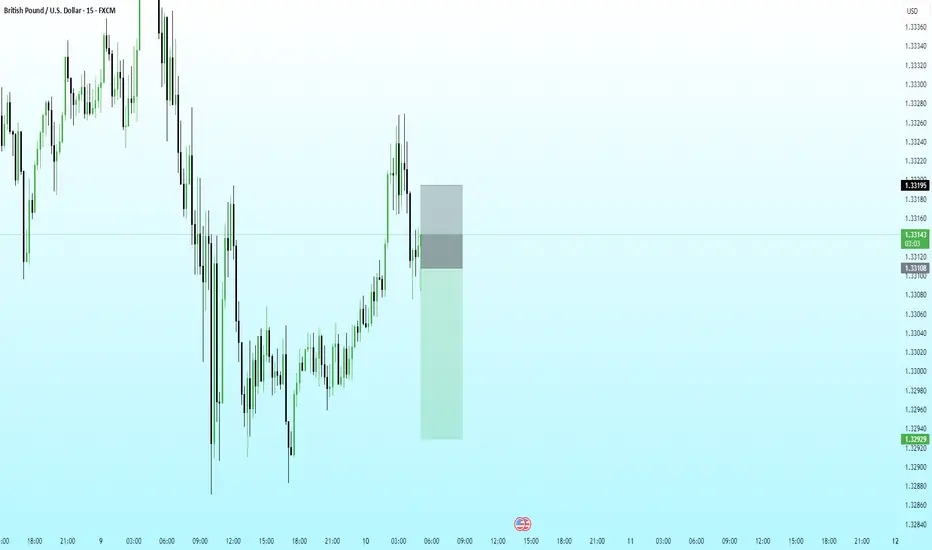
GBPUSD Short | 15m | Structural RejectionPrice tapped into a minor premium zone after an extended corrective leg and immediately showed rejection through a sharp bearish response. The preceding move lacked impulsiveness, suggesting it was corrective rather than a trend continuation.
The short entry is based on:
• Retest of prior micro-structure breakdown
• Failure to sustain above the rejection block
• Clear shift in orderflow as bullish momentum faded
Stop placed above the rejection candle.
Primary target aligned with the liquidity pocket near 1.3290.
This setup follows the broader intraday bias and respects the structural flow of GBPUSD during the session.
PCR Trading Strategies Option Buyers vs. Option Sellers
Option Buyers
Limited loss (only premium paid)
Unlimited profit potential
Higher risk of loss due to time decay
Good for small capital traders
Option Sellers (Writers)
Limited profit (premium received)
Potentially unlimited loss
Benefit from time decay
Requires high margin and experience
Example:
A seller who sells Nifty 22,500 CE for ₹100 receives ₹100 premium.
If Nifty stays below 22,500, the seller keeps the entire premium.

Option Trading Strategies How Option Premium Is Determined
The premium of an option depends on multiple factors. These include:
1. Underlying Price (Spot Price)
Directly impacts option value.
Call premiums rise when price goes up
Put premiums rise when price goes down
2. Time to Expiry (Time Value)
Options lose value as expiry approaches. This is called time decay or theta decay.
3. Volatility (IV – Implied Volatility)
Higher volatility increases premiums because uncertainty is higher.
4. Interest Rates & Demand-Supply
These have smaller effects but still influence prices.

XAUUSD Short | 15m |Gold revisited the upper band of the intraday structure and showed clear signs of weakening momentum. Price failed to sustain above the model’s trailing zone, indicating a shift from short-term accumulation to distribution.
The short entry was executed as price broke back below the cloud, supported by a clean loss of intrabalance strength.
Stop is placed above the most recent structural failure.
Primary target sits near the liquidity cluster around 4175.

Monthly TF analysis. Buy 1015.Based on stacked high low difference.
1 Historical Base Formation
2 was = 1
3 was = 1
4 and 5 will be same as 1.
Buy at 1015. Safe entry.
R:R = 1:2.5
