PCR Trading Strategies Option Buyers vs. Option Sellers
Option Buyers
Limited loss (only premium paid)
Unlimited profit potential
Higher risk of loss due to time decay
Good for small capital traders
Option Sellers (Writers)
Limited profit (premium received)
Potentially unlimited loss
Benefit from time decay
Requires high margin and experience
Example:
A seller who sells Nifty 22,500 CE for ₹100 receives ₹100 premium.
If Nifty stays below 22,500, the seller keeps the entire premium.
Harmonic Patterns

Option Trading Strategies How Option Premium Is Determined
The premium of an option depends on multiple factors. These include:
1. Underlying Price (Spot Price)
Directly impacts option value.
Call premiums rise when price goes up
Put premiums rise when price goes down
2. Time to Expiry (Time Value)
Options lose value as expiry approaches. This is called time decay or theta decay.
3. Volatility (IV – Implied Volatility)
Higher volatility increases premiums because uncertainty is higher.
4. Interest Rates & Demand-Supply
These have smaller effects but still influence prices.

XAUUSD Short | 15m |Gold revisited the upper band of the intraday structure and showed clear signs of weakening momentum. Price failed to sustain above the model’s trailing zone, indicating a shift from short-term accumulation to distribution.
The short entry was executed as price broke back below the cloud, supported by a clean loss of intrabalance strength.
Stop is placed above the most recent structural failure.
Primary target sits near the liquidity cluster around 4175.

Monthly TF analysis. Buy 1015.Based on stacked high low difference.
1 Historical Base Formation
2 was = 1
3 was = 1
4 and 5 will be same as 1.
Buy at 1015. Safe entry.
R:R = 1:2.5

Part 2 Master Candle Stick patterns Types of Options
1. Call Options (CE)
A call option gives the buyer the right to buy the underlying asset at the strike price before expiry.
You buy a call if you think the price of the asset will go up.
Example:
If Nifty is at 22,000 and you expect it to rise, you might buy a 22,200 CE.
If Nifty rises to 22,400, the premium of your call option increases, giving you profit.

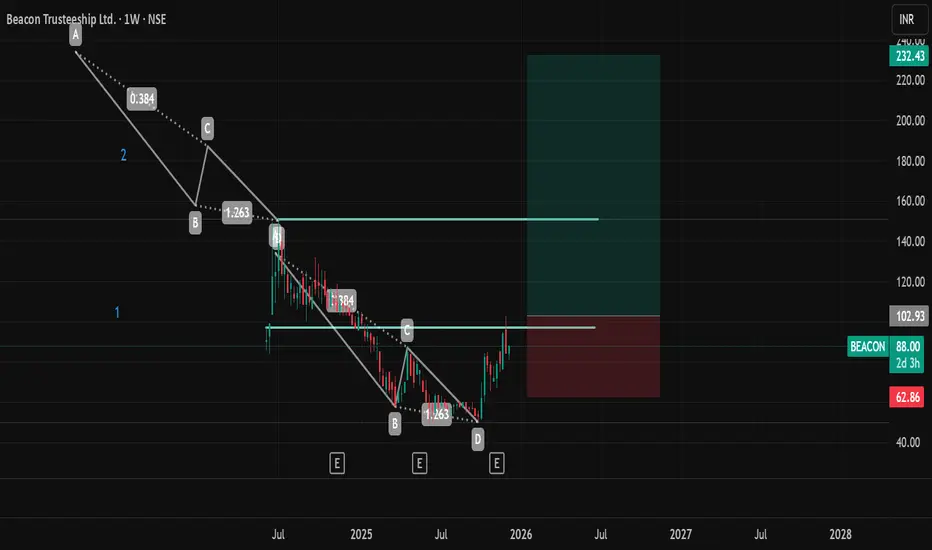
Weekly TF analysis. Buy 103.Based on stacked high low difference.
1 Historical Base Formation
2 should be = 1, Projected breakout
Buy at 103. Safe entry.
R:R = 1:3
Part 1 Candle Stick Patterns What Is an Option?
An option is a contract between a buyer and a seller.
The buyer pays a premium to purchase the right.
The seller receives the premium and takes on the obligation.
Every option contract has:
Strike Price – the predetermined price for buying or selling the asset
Expiry Date – the date on which the option contract ends
Premium – the cost of the option
Lot Size – fixed quantity of the underlying asset
Understanding these fundamentals is crucial before diving into live trading.

KALYANKJIL 1 Week Time Frame 📉 1‑Week Price Movement & Technical Snapshot
The share price has fallen by ~4–5% over the last week.
Current quote (around 9–10 Dec 2025) is in the ₹468–473 range.
From its 52‑week high of ₹794.60, the stock is down more than 40%.
Technical‑analysis commentary suggests “bearish momentum” and “mixed signals” — indicating consolidation or possible further downside in the short term.
📊 Fundamentals & Market Context
Recent financials show some strength: the company reported good revenue growth and profitability in recent quarters.
On the valuation side: the stock quotes a high P/E (price-to-earnings) and P/B (price-to-book) compared with some peers — implying expectations are already priced in.
Some analysts as per recent reports have highlighted structural headwinds (like weaker jewellery demand, gold‑price volatility, cautious consumer spending), which may weigh on near‑term performance.

XAUUSD/GOLD 1H BUY PROJECTION 10.12.25“Character Invalid Here” (Lower Pink Zone)
This zone represents heavy sell pressure.
Price dropped deeply here → buyers were weak → sellers dominated.
From this area, the market started recovering upward slowly.
2️⃣ Day High as Resistance R1 (Middle Pink Zone)
This is a strong resistance level.
Price tested this zone multiple times and faced rejection.
This confirms it as a key intraday resistance.
Once price breaks and retests this area, bullish confirmation becomes stronger.
3️⃣ Bounce Back Area (Green Horizontal Zone)
This area is where you expect the pullback (retracement) to happen.
When price returns to this zone:
✔ Buyers re-enter the market
✔ Trend continues upward
✔ You get safe entry confirmation
This is a high-probability buy zone.
4️⃣ Entry After Bounce Back (Red Zone)
This is the ideal buy entry area after confirmation.
Your structure shows:
Price breaks the resistance
Pulls back for retest
Holds the major trendline
Respects the curved support (cup structure)
This indicates a strong bullish continuation setup.
5️⃣ Target Price (Weekly High Resistance & TP)
This is the weekly high, which acts as the final target.
The price is expected to reach this level due to:
Strong bullish momentum
Breakout + retest confirmation
Trendline support
Clean upside liquidity
This is a realistic and high-probability target.

Premium Chart Patterns Why Chart Patterns Work
Chart patterns work because they reflect real market behavior.
Key reasons:
✔ Human psychology repeats
People fear losses and chase gains. This creates repeatable price movements.
✔ Institutions accumulate or distribute slowly
Big players cannot buy or sell at once—they create patterns during accumulation/distribution.
✔ Liquidity zones
Patterns often form near liquidity pools where many stop-loss orders exist.
✔ Self-fulfilling nature
When many traders recognize the same pattern, they take similar trades, increasing accuracy.

XAUUSD MULTI TIMEFRAME ANALYSIS Gold looks set to push toward the all-time high without dipping below the previous day’s low. Despite a bearish weekly bias, yesterday’s close makes a deeper move into last week’s low unlikely. Daily structure is bouncing cleanly off the 10/20 EMAs, and the current price action leans strongly bullish. I’ll watch this zone for a high-probability long setup and position toward the upside if my entry conditions trigger.

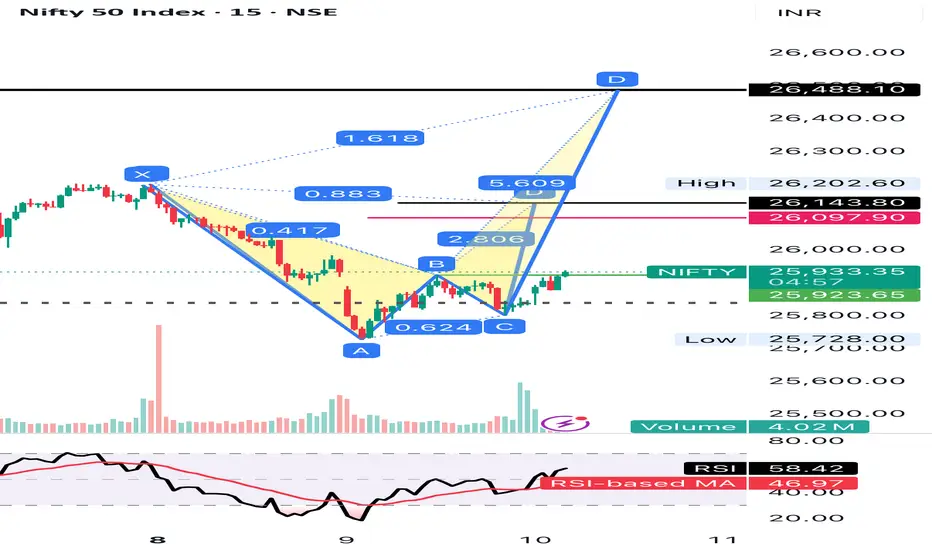
Nifty rally expected soon 26488++ in no timeNifty after hitting 50 EMa ready for rally
Immediate target 26488++
Probably this week only possible
26145/26277 hurdle points
XAUUSD/GOLD JOLTS Job Openings News Projection 09.12.25Main Idea
Gold is currently ranging between 4,191 – 4,210 zones.
During JOLTS news volatility, price may either break upward or break downward from this zone.
Your plan is a breakout + retest entry with a 1:3 Risk–Reward Ratio.
🟢 Bullish Scenario (Buy Setup)
Conditions to Buy:
Price breaks above 4,210 zone
Retests the same zone and holds as support
Enter after bullish confirmation
Target:
4,250 zone
Stoploss:
Below 4,191 zone
🔴 Bearish Scenario (Sell Setup)
Conditions to Sell:
Price breaks below 4,191 zone
Retests the level as resistance
Enter after bearish confirmation
Target:
4,163 zone
Stoploss:
Above 4,210 zone
🎯 Risk–Reward Ratio: 1:3
Both setups aim for a low-risk and high-reward breakout trade using news momentum.

$BNB: Key HTF Decision Zone AheadCRYPTOCAP:BNB : Key HTF Decision Zone Ahead
#BNB is still holding above the critical $700–$550 demand zone, the same area that defines the continuation or breakdown of the current macro trend. As long as price maintains this support, HTF structure stays bullish and the next expansion wave targets $1500 → $2000 → $2500 → $3000.
A weekly close below $550 would flip structure bearish and open a deeper correction toward $250–$170.
Key Levels
Accumulation Zone: $700–$550
Upside Targets: $1500 / $2000 / $2500 / $3000
Invalidation: Weekly close < $550
BNB is at a major decision point: Hold the zone and bullish momentum accelerates; lose it and trend resets.
NFA & DYOR

Divergence Secrets Who Should Trade Options?
Options are suitable for:
Traders looking for leverage with limited risk
Investors wanting to hedge positions
Experienced traders generating income
Anyone willing to learn market structure and volatility
But they require discipline, knowledge, and proper risk management.

GBP/USD – Short Setup Trade Narrative
Price created a lower-high structure after the earlier push up, followed by a sharp sell-off that broke intraday momentum.
A small liquidity grab beneath the prior low caused a corrective pullback into a premium zone, aligning perfectly with the bearish bias.
The current candle shows rejection inside the supply block / retracement zone, giving a clean short entry.
Confluence
Structural lower-high formation
Liquidity sweep before entry
FVG fill during retracement
Higher-timeframe bearish context
Clear risk-to-reward framework

Part 2 Support and ResistanceHow Time Decay Affects Option Traders
Time value decays rapidly near expiry. This is why buyers must be accurate about timing, while sellers benefit from time decay.
Buyers lose money if the market doesn’t move quickly.
Sellers gain even if the market doesn’t move at all.
This is why most experienced traders prefer option selling with risk controls.

Part 1 Support and ResistanceWhat Is Option Premium?
The premium is the price paid by the buyer to the seller to purchase the option. It represents the cost of owning the right.
Premium depends on factors like:
Current market price
Strike price
Time left to expiry
Volatility
Interest rates
Demand and supply
Two components decide the premium:
Intrinsic Value – Real value based on price difference.
Time Value – Extra value because the option has time before expiry.
As expiry approaches, time value decreases — this is called Time Decay (Theta).

Part 12 Trading Master ClassTips for Beginners in Option Trading
1. Start with Buying Options
It reduces your risk while learning market movements.
2. Trade Only One Index First
Start with Nifty or Bank Nifty to understand price behavior.
3. Follow Volume and Open Interest (OI)
These help you understand the market’s real strength.
4. Learn Support & Resistance
Options react strongly at these levels.
5. Avoid Trading During Highly Volatile News
Like RBI policy, Fed meeting, Budget day.
6. Manage Risk
Never put full capital into one trade.
7. Practice Through Paper Trading
Gain confidence before using real money.

Components of a Candle (Body, Wick, High, Low)Types of Candlestick Patterns
Candlestick patterns are broadly divided into:
A. Single Candlestick Patterns
Formed by just one candle.
B. Double Candlestick Patterns
Formed by two-candle combinations.
C. Triple Candlestick Patterns
Formed by three-candle combinations.
Let’s dive into each category in detail.

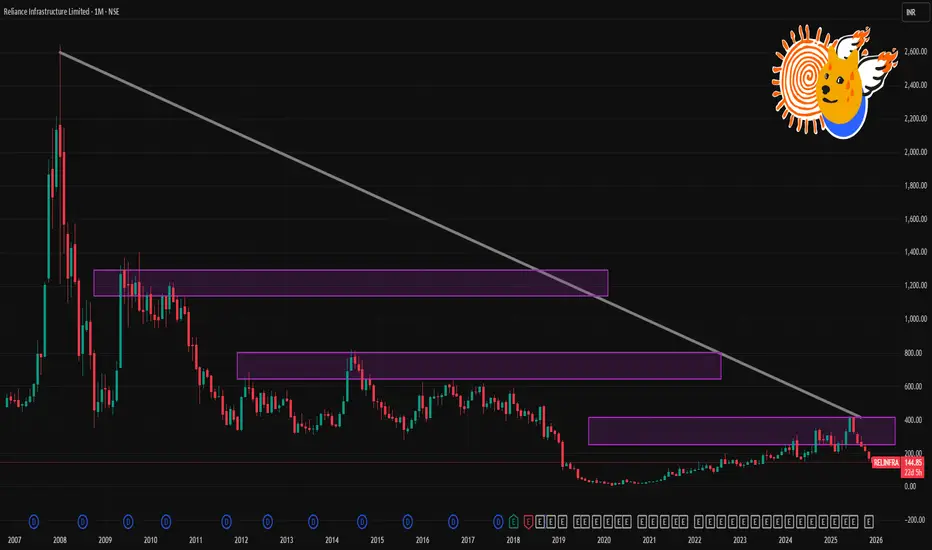
RELINFRA 1 Month Time Frame 📉 What’s Happening Now
As of 8–9 December 2025, Reliance Infrastructure is trading near ₹ 146–147 — its 52‑week low.
Over the past month the stock has seen a sharp drop of ~15–20%.
On 9 Dec it hit a fresh intraday low of ~₹ 139.6‑140, triggering lower‑circuit (i.e. trading halt for the day) — indicating heavy selling pressure.
🔎 Why the Weakness
The recent decline reflects broad selling pressure, partly driven by negative sentiment in its sector and possibly concerns over group‑level regulatory/legal issues.
While the company has been in distress compared with its earlier 52‑week high (~₹ 425), volatility remains high, with the share trading well below major moving averages.
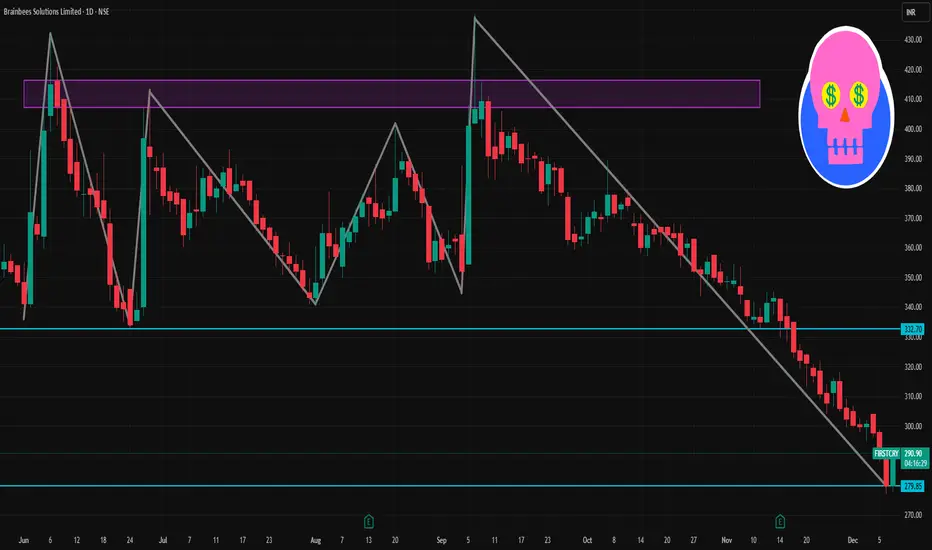
FIRSTCRY 1 Day Time Frame 📊 What the 1‑day chart for Brainbees Solutions currently shows
As of recent trading, the share price of Brainbees Solutions is around ₹ 279–290 on NSE.
The 52‑week high and low band shows a high near ~₹ 664–665 and a low around ~₹ 277–286.
That means at current ~₹ 280–290, the stock is very close to its 52‑week low — which may make the “day‑timeframe level” important for traders looking for a bounce or reversal.
Some technical‑analysis data (on certain days) show bearish momentum: for example, on a recent day the stock hit an all‑time low of ₹ 287, continuing a downtrend.
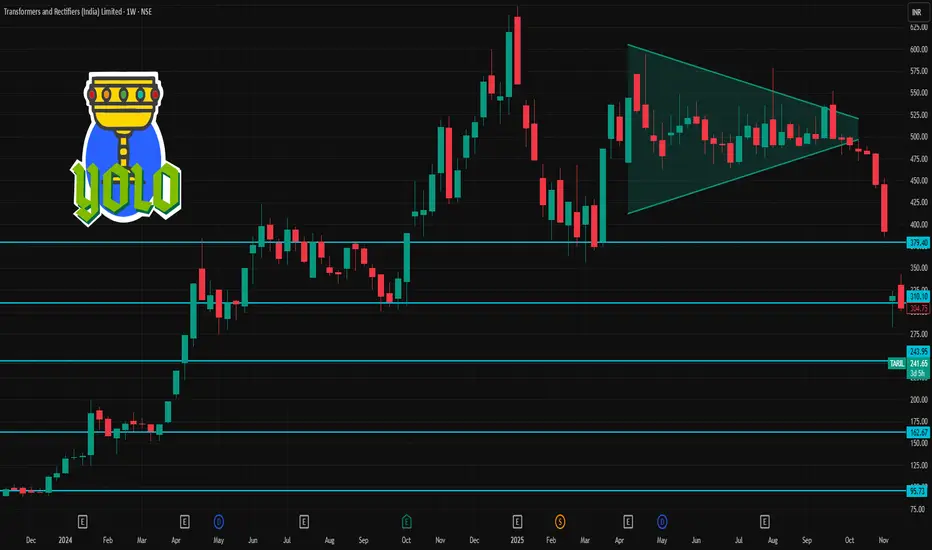
TRIL 1 Week Time Frame 📌 Latest Price & 1‑Week Snapshot
The stock is trading around ₹240–₹241 per share (NSE/BSE).
According to a recent summary, over the last 1 week the stock has moved approximately –7% to –7.4%.
52‑week range: Low ≈ ₹232–₹236, High ≈ ₹648–₹650.
Thus the stock is very near its 52‑week low — down roughly 63% from 52‑week high.
What this suggests (short‑term)
The share is currently at deep discount territory, close to 52‑week bottom — so for traders, this could mean limited downside (barring new negative news), but also that upside is large — albeit requiring major positive triggers.
Given weak near‑term momentum (recent dip, down ‑7% in a week), the stock may consolidate around current levels — ₹230–₹250 zone — unless there’s a strong catalyst.
🎯 What This Means for Short-Term Traders vs Long-Term Investors
Short-term traders: The ₹232–₹240 zone can be considered as a near-term support base. If the stock holds above ~₹235, a bounce is possible — but sharp volatility remains likely. Risk/reward is skewed toward a bounce — but with high uncertainty.
Medium/Long-term investors: The deep discount vs 52‑week high may look attractive — but fundamentals (earnings weakness, recent volatility, sanction overhang) suggest caution. The stock could recover substantially — if the company stabilizes business, wins new orders, and global/sector sentiment improves.