GBPUSD MULTI TIMEFRAME ANALYSIS Looking for a counter-trend short on GBPUSD. I ultimately want longs around 1.32500, so near-term bias is slightly bearish. On 15m I’ve got a clean liquidity sweep + BOS + FVG, so I’m taking the short as a corrective play. Setup is solid but counter-trend, so it’s a 3-star setup. Let’s see how it unfolds.
Setup Quality ⭐⭐⭐
Harmonic Patterns

Last Pump Before the Rate Cut?My base scenario remains simple: a liquidity push to take out recent highs on rate-cut expectations, followed by a correction.
Bitcoin
Long setup is still valid, but structural support is weak.
If the market avoids political catalysts (e.g., unexpected Trump comments), a sweep of the recent high remains likely.
Key level to hold: 92,000 USDT
If this level is defended, long setups are justified toward a liquidity grab above current highs.
Ethereum
Plan remains unchanged.
ETH has been showing relative strength and is on track for a local high breakout, as discussed earlier.
Altcoins - Still Weak
Most alts remain in HTF discount zones and fail to break out. This is the only factor that adds moderate risk to the bullish continuation.
ZEC (watchlist short idea)
ZEC is interesting only after a pump, not before it.
A short becomes valid if price tests the 1D FVG, and only after a breakout from the current range.
Avoid pre-positioning - short setup is early until we leave the range.
Summary
BTC: bullish continuation if 92,000 support holds.
ETH: aligned with the plan — higher liquidity levels ahead.
ALT market: weak; selective setups only.
ZEC: potential short after a pump into 1D FVG, not before.

Part 8 Trading Master Class Option Buyer vs Option Seller
Option Buyer
Pays premium
Risk is limited to premium
Profit potential is unlimited (for call) or large (for put)
Needs a strong directional move
Time decay works against the buyer
Option Seller
Receives premium
Risk can be unlimited (if market moves sharply)
Profit is limited to premium received
Benefits from sideways market
Time decay works in seller’s favour
Option sellers usually need more capital because of higher risk.

Part 7 Trading Master Class How Option Pricing Works
The price of an option (premium) depends on many factors:
1. Underlying Price
If the market moves in the option’s direction (up for call, down for put), the premium rises.
2. Strike Price
Closer the strike to current price, higher the premium.
3. Time to Expiry
More time → higher premium (more chances of movement)
4. Volatility
Higher volatility → higher premium.
5. Interest rates and dividends
These have minor effects but still influence pricing models.

Part 6 Learn Institutional Trading Types of Option Based on Moneyness
In-The-Money (ITM)
Call Option: Strike < Market Price
Put Option: Strike > Market Price
At-The-Money (ATM)
Strike = Market Price (closest)
Out-Of-The-Money (OTM)
Call Option: Strike > Market Price
Put Option: Strike < Market Price
OTM options are cheaper but riskier.

NIFTY - BEARISH BAT or ABC corrective rise?TF: 15 Minutes
CMP: 26136
If we consider this as an ABC rise of the entire fall from 26320 levels, then it should halt at 26170 odd and reverse.
In Harmonic pattern, BEARISH BAT formation is visible and the desired target for this is at 26270
Lets see how the price unfolds
Disclaimer: I am not a SEBI registered Analyst and this is not a trading advise. Views are personal and for educational purpose only. Please consult your Financial Advisor for any investment decisions. Please consider my views only to get a different perspective (FOR or AGAINST your views). Please don't trade FNO based on my views. If you like my analysis and learnt something from it, please give a BOOST. Feel free to express your thoughts and questions in the comments section.

usdjpy shortA major currency pair in forex that shows how many Japanese yen are needed to buy one US dollar. Traders watch it for interest-rate differences, risk sentiment, and Bank of Japan vs. Federal Reserve policy. It’s known for strong trends and volatility, especially around economic data release

Part 4 Learn Institutional Trading Advantages of Option Trading
1. Limited Risk for Buyers
Buyers can only lose the premium.
2. Leverage
You control a big position with small capital.
3. Flexibility
Can be used for speculation, hedging, income, blending multiple strategies.
4. Huge Earning Potential
Strong moves give massive percentage returns.

Part 2 Ride The Big MovesPopular Option Trading Strategies
Some commonly used strategies:
1. Covered Call
Hold stock + sell a call option for income.
2. Protective Put
Buy a put to hedge stock holdings.
3. Straddle
Buy ATM Call + ATM Put → profits during big movements.
4. Strangle
Buy OTM Call + OTM Put → cheaper than straddle.
5. Iron Condor
Sell OTM Call + Put and hedge with further OTM options.
Used in sideways markets.
6. Spread Strategies (Bull Call Spread, Bear Put Spread)
Buy one option and sell another to reduce cost and risk.

Part 1 Ride The Big MovesTips for Beginners
✔ Start with buying options
You learn direction and risk without big losses.
✔ Focus on one index (like Nifty)
Better to understand one market deeply.
✔ Avoid trading near major news
Volatility can be unpredictable.
✔ Manage risk
Never trade with full capital.
✔ Keep emotions low
Discipline outweighs excitement in option trading.

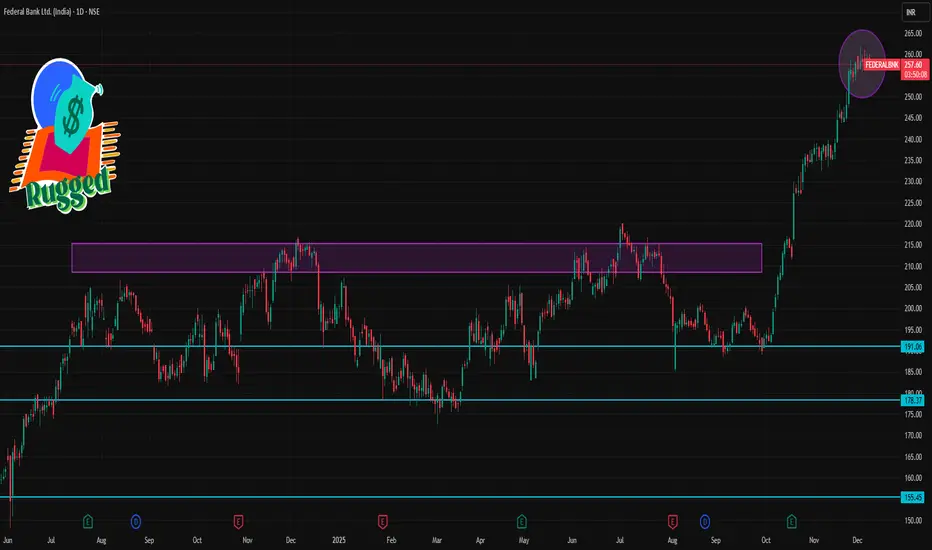
FEDERALBNK 1 Day Time Frame 📈 Key Data / Context
The stock currently trades in the ballpark of ₹258–260 / share.
Over the past 52 weeks, the share has ranged roughly between ₹172.66 (low) and ₹262.00 (high).
Fundamental metrics: P/E ratio around ~15–16×, book value ~ ₹147, and a modest dividend yield.
⚠️ What to Keep in Mind
As a bank stock, broader macroeconomic factors (interest‑rate outlook, banking sector sentiment, credit growth) matter — technical levels can get invalidated if fundamentals shift.
A “breakout” above resistance (e.g. ₹262–265) should ideally be backed by volume for conviction.
Similarly, a drop below support (₹255 / ₹252) could trigger more support tests — a stop‑loss strategy may be useful if trading short‑term.
Real Knowledge Of Candle Patterns Candlestick Patterns in Reversal Trading
Reversals are powerful when:
Patterns appear on key levels
Trend is exhausted
Volume divergence occurs
Examples:
Morning Star at support
Shooting Star at resistance
Engulfing candles at major swing points
Combining Candles with Indicators
Although candles alone are powerful, combining them with indicators increases win probability.
Best indicators:
RSI for overbought/oversold
Volume Profile / Market Structure
MACD for momentum shift
Moving averages for trend direction

KAYNES 1 Day Time Frame 📉 Current Price & Recent Context
Current (latest) price is around ₹ 4,132 – ₹ 4,141.
On 8 Dec, the stock’s intraday high was ~ ₹ 4,531.15, and intraday low ~ ₹ 4,125.55.
The 52‑week range remains ₹ 3,825.15 (low) to ₹ 7,822.00 (high).
🔎 Key Short‑Term Support & Resistance Zones
Based on intraday price action, pivot–point analysis (as per publicly available technical data) and recent trading range:
Support Zone (near‑term): ~ ₹ 4,120 – ₹ 4,130 (the intraday low touched ~ ₹ 4,125.55)
Lower Support (next): ~ ₹ 3,825 – ₹ 3,900 (near 52‑week low)
Resistance / Pivot Zone: ~ ₹ 4,770 – ₹ 4,950 (near intraday high + recent day’s upper range)
Higher Resistance Zone (if market recovers strongly): ~ ₹ 5,200–₹ 5,400+ (but note: much of this is well above current range — would require strong bullish breakout)
Interpretation (near‑term):
The ₹ 4,120–₹ 4,130 level is a critical short‑term support — a breakdown below this could test the 52‑week‑low zone near ₹ 3,825–₹ 3,900.
On the upside, the first hurdle is near ₹ 4,770–₹ 4,950. Clearing that convincingly could open up a move toward the ₹ 5,200–₹ 5,400 area — but given current bearish pressure, that seems a medium‑term scenario only.

Premium Chart Patterns Premium patterns help traders understand:
Smart money manipulation
Market structure transitions
Liquidity-based entries
Institutional imbalances
Reversal and continuation logic
They are more reliable than basic chart patterns because they reflect:
Actual institutional logic
Market psychology
Liquidity engineering
Price inefficiencies and corrections
Premium chart patterns are essential for traders who want to trade professionally and understand the true mechanics behind price movement.

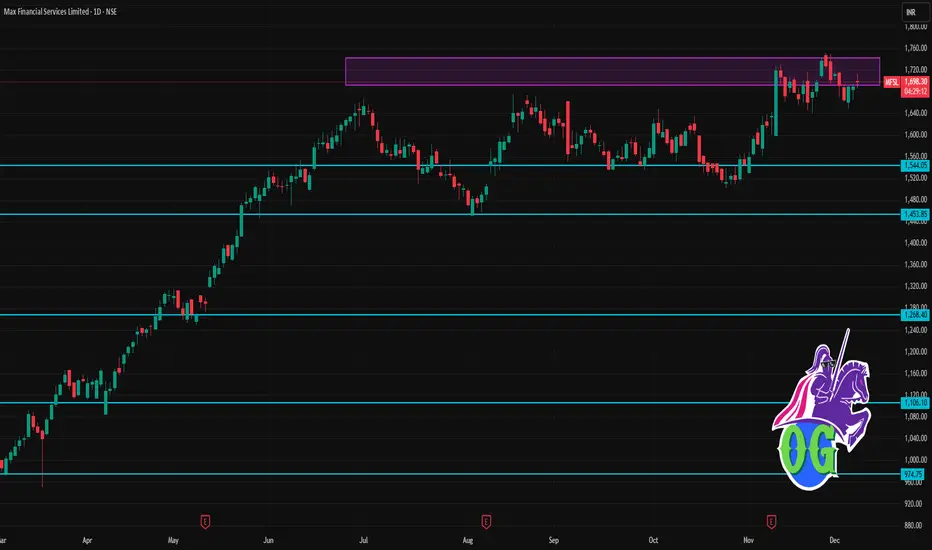
MFSL 1 Day Time Frame 📌 Current status
Latest quote for MFSL is ≈ ₹1,690.20.
52‑week range: Low ~ ₹950 — High ~ ₹1,751.40.
According to one technical‑analysis provider, the short‑term/mid‑term/long‑term bias remains bullish, though price is currently a few percent below recent resistance.
🎯 What this implies (on 1‑day timeframe)
As long as MFSL stays above S1 (~₹1,670), the short‑term trend remains stable; dips toward S2/S3 (~₹1,646 / ₹1,622) could offer re‑entry opportunities if price action stabilizes.
A breakout above R1 (~₹1,716–1,737) and sustained move toward R2 (~₹1,740–1,764) could open up upside potential toward R3 (~₹1,764–1,794).
If price falls below S2/S3, risk of a deeper correction rises — possibly pulling back toward lower support zones or consolidating.
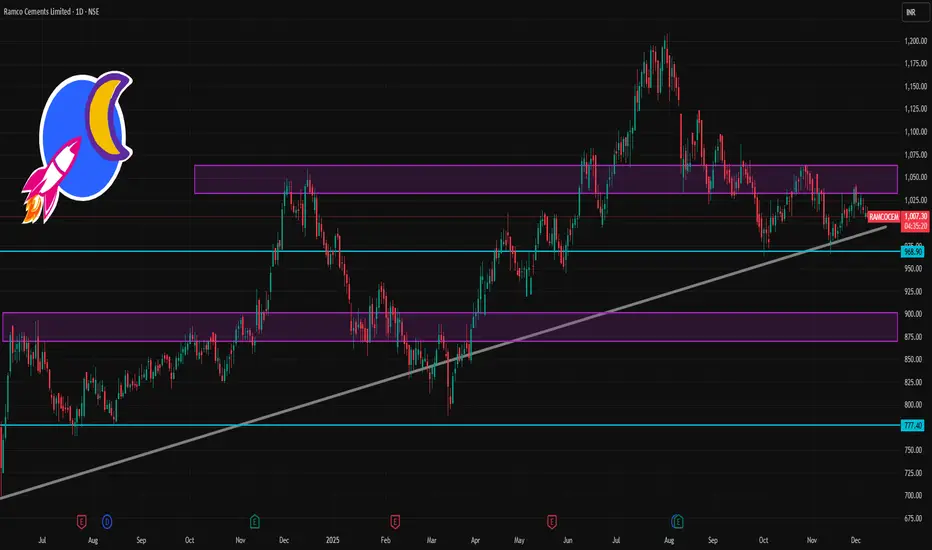
RAMCOCEM 1 Day Time Frame 📌 Current Price (Approx)
₹1007–₹1011 range on NSE during today’s session. Live market shows price around this zone (previous close ~₹1,011).
📊 Daily Pivot & Support/Resistance Levels (Updated)
(from reliable intraday pivot data)
Daily Pivot Zone
Central Pivot Point (CPR): ~₹1,011.4–₹1,011.8 (key equilibrium level)
Resistance Levels
R1: ~ ₹1,019
R2: ~ ₹1,027
R3: ~ ₹1,034–₹1,035
(above these levels can imply stronger upside if sustained)
Support Levels
S1: ~ ₹1,011–₹1,003
S2: ~ ₹996–₹992
S3: ~ ₹988–₹980
(broken support zones may accelerate downside)
✅ Key ODI pivots (Standard daily):
S1 ~ ₹1003.7
Pivot ~ ₹1019.1
R1 ~ ₹1027.3 (minor breakout level)
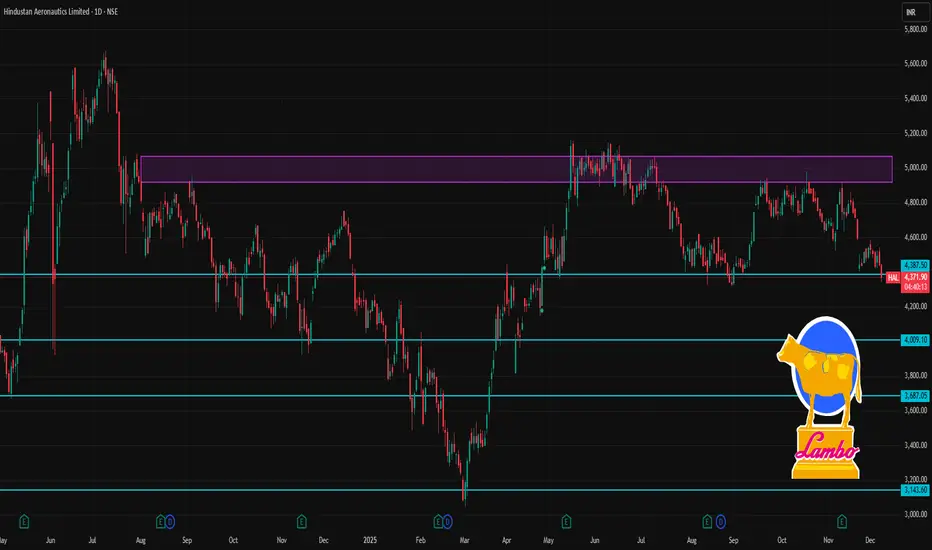
HAL 1 Day Time Frame 📈 Current Live Price (Approx)
HAL stock trading around ~₹4,360-₹4,440 on NSE today (08-Dec-2025) depending on real-time movement during session.
📊 Daily Pivot & Intraday Levels (Key Support / Resistance)
(Derived from live pivot screener showing today’s pivot scenario)
Daily Pivot Pivot Levels
Level Price (Approx)
R3 ₹4,583
R2 ₹4,558
R1 ₹4,533
Pivot Point ₹4,508
S1 ₹4,483
S2 ₹4,458
S3 ₹4,433
✅ Today’s view: Current price is trading near or slightly below the pivot zone (~₹4,507) — indicating neutral/slightly bearish bias if below pivot. Break above R1/R2 (~₹4,533-₹4,557) strengthens bullish intraday bias; breakdown below S2/S3 (~₹4,458-₹4,433) increases downside risk intraday.
🧠 How to Interpret These Intraday Levels
📌 Bullish (Buy) Scenario
Above Pivot (~₹4,508) → intraday bias turns bullish.
Break above ₹4,533-₹4,558 zones → could lead to further upside towards R3 ~₹4,583+.
📉 Bearish (Sell) Scenario
Below S1 (~₹4,483) → short-term weakness.
If price slips below ₹4,458-₹4,433 (S2/S3) → stronger bearish momentum intraday.
Options Trading Basics1. What Are Options?
An option is a financial derivative whose value depends on an underlying asset such as stocks, indices, commodities, or currencies. Each option contract grants the buyer certain rights based on the type of option:
Call Option: Right to buy the underlying asset.
Put Option: Right to sell the underlying asset.
The price at which the transaction may occur is called the strike price, and the time until the contract expires is the expiration date.
2. Types of Options
A. Call Options
A call option gives the buyer the right (not obligation) to purchase the underlying asset. Traders buy calls when they expect the price to rise.
If the asset price goes above the strike price → the buyer profits.
If the asset price stays the same or falls → the buyer loses the premium paid.
B. Put Options
A put option gives the buyer the right to sell the underlying asset. Traders buy puts when they expect the price to fall.
If the asset price falls below the strike price → the buyer profits.
If the asset price stays the same or rises → the buyer loses the premium paid.
3. Key Terminology Every Options Trader Must Know
Premium
The cost paid to buy an option. Calculated based on demand, volatility, time to expiry, and underlying price.
Strike Price
The price at which the underlying asset can be bought or sold via the option.
Expiration Date
Options contracts expire after a certain date—daily, weekly, or monthly.
Lot Size
Options are traded in predefined quantities (lots), not single shares.
In-the-Money (ITM), At-the-Money (ATM), Out-of-the-Money (OTM)
Call Option:
ITM: Spot > Strike
ATM: Spot ≈ Strike
OTM: Spot < Strike
Put Option:
ITM: Spot < Strike
ATM: Spot ≈ Strike
OTM: Spot > Strike
4. How Options Pricing Works (The Basics)
Option pricing is influenced by multiple factors. These are captured by a model called the Black-Scholes Model, and the key components are:
A. Intrinsic Value
The real value of the option if exercised today.
Call Intrinsic = Spot − Strike (if positive)
Put Intrinsic = Strike − Spot (if positive)
B. Time Value
Extra value based on how much time is left until expiration. More time → higher premium.
C. Volatility
Higher volatility increases the chance of significant price moves, resulting in costlier options. Implied volatility (IV) is a critical factor.
D. Interest Rates & Dividends
They have a relatively small impact but still influence pricing.
5. Why Trade Options? (Benefits)
Options offer advantages that stocks cannot provide.
1. Leverage
With a small premium, traders can control a large position.
2. Hedging
Options can protect portfolios from adverse market movements.
Example: Buying puts acts like insurance for a stock portfolio.
3. Flexibility
Options allow profit in up, down, and sideways markets.
4. Limited Risk for Buyers
The maximum loss for an option buyer is limited to the premium.
6. Risks Associated with Options
Options come with risks, especially for beginners.
A. Time Decay (Theta)
Options lose value as expiration approaches if the underlying doesn’t move favorably.
B. Volatility Risk
If volatility decreases after entry, options can lose value even if price moves correctly.
C. Liquidity Risk
Low liquidity can cause slippage and widen bid–ask spreads.
D. Unlimited Risk for Option Sellers
While buyers have limited risk, option sellers can face theoretically unlimited loss, especially in naked call writing.
7. Option Trading Styles
A. Intraday Options Trading
Positions are opened and closed within the same day. Highly dependent on volatility and market momentum.
B. Positional Options Trading
Holding options for multiple days or weeks; requires understanding of market trend and implied volatility.
C. Hedging Based Options
Used by investors and institutions to reduce portfolio risk.
8. Popular Option Trading Strategies
1. Buying Calls and Puts
Simple directional trades based on expected movement.
Buy Call → Bullish view
Buy Put → Bearish view
2. Covered Call
Holding shares and selling a call option against them → generates income.
3. Protective Put
Holding shares and buying a put → protects against downside.
4. Vertical Spreads
Buying and selling options of the same type and expiry but different strike prices.
Bull Call Spread
Bear Put Spread
These help reduce risk and cost.
5. Straddle
Buying ATM call + ATM put. Profits from big moves in any direction.
6. Strangle
Buying OTM call + OTM put; cheaper than straddle, requires large move.
9. Option Greeks – The Building Blocks
To understand how an option behaves with market changes, traders use Greeks.
Delta
Measures the sensitivity of option price to a ₹1 change in the underlying.
Call Delta: 0 to 1
Put Delta: −1 to 0
Theta
Measures time decay. A negative value indicates loss in premium daily.
Vega
Measures sensitivity to volatility. Higher IV → higher premium.
Gamma
Shows how quickly Delta changes with underlying movement.
Rho
Measures sensitivity to interest rates.
Understanding Greeks is essential for risk management and developing advanced strategies.
10. How Options Settlement Works
In India:
Index Options: Cash-settled
Stock Options: Physical settlement
If you hold an ITM stock option till expiry, you must:
Buy shares (for calls)
Deliver shares (for puts)
This increases margin requirements.
11. Best Practices for Beginners
✔ Start with Buying Options (Limited Risk)
✔ Avoid Selling Naked Options initially
✔ Use Stop Loss and Risk Management
✔ Trade liquid stocks/indices like NIFTY, BANKNIFTY
✔ Track Implied Volatility (IV) before entering
✔ Avoid holding OTM options to expiry
✔ Maintain a trading journal
12. Conclusion
Options trading is a versatile and powerful instrument that provides tremendous opportunities for traders—whether they seek profits during market movements, consistent income, or portfolio protection. However, the complexities of pricing, volatility, time decay, and risk require proper knowledge, discipline, and strategy. Understanding the basics—call and put options, premiums, strike selection, Greeks, and risk management—sets a strong foundation for successful trading. With practice, patience, and the right mindset, options can become a valuable part of every trader’s toolkit.

Risk Management & Money Management1. Understanding Risk Management in Trading
Risk management is the practice of identifying, assessing, and controlling the amount of loss you are willing to tolerate in a trade. It answers a simple question:
👉 “How much can I afford to lose if this trade goes wrong?”
Professional traders know that losing trades are unavoidable. What matters is how big those losses are.
1.1 Key Elements of Risk Management
1. Position Sizing
Position sizing means deciding how many shares/lots/contracts to trade based on your account balance and risk tolerance.
Most traders risk 1% to 2% per trade.
Example:
If your capital = ₹1,00,000
Risk per trade = 1% = ₹1,000
If SL difference is ₹5, quantity = ₹1,000 ÷ 5 = 200 shares.
This ensures no single trade damages your account.
2. Stop-Loss Placement
A stop-loss is a predefined price where you exit automatically if the trade goes against you.
Stop-loss keeps emotions out of the decision.
Three ways to set SL:
Technical SL – based on chart levels (support/resistance, trendline, swing highs).
Volatility SL – using ATR to adapt SL to market conditions.
Money-based SL – based on a fixed rupee or percentage loss.
A trade without SL is gambling.
3. Risk-to-Reward Ratio (RRR / R:R)
The RRR tells how much you stand to gain versus how much you risk.
General rule: Take trades only with RRR ≥ 1:2.
Examples:
You risk ₹1,000 → try to make ₹2,000.
You risk 10 points → target 20 points.
Even with a 40% win rate, a 1:2 RRR can make you profitable.
4. Avoiding Over-Leveraging
Leverage increases buying power—but also increases risk.
Beginners blow up accounts due to excessive leverage in futures/options.
Risk management says:
✔ Use leverage only when you understand risk
✔ Never use full margin
✔ Reduce position size during high volatility events (Fed meet, RBI policy, Budget, elections)
5. Diversification
Do not put all capital into one trade or one sector.
If you trade equities: diversify across sectors.
If you trade F&O: avoid multiple trades highly correlated with each other.
Example:
Bank Nifty long + HDFC Bank long → same directional risk.
6. Probability & Expectancy
Great traders think in probabilities, not predictions.
Expectancy = (Win% × Avg Win) – (Loss% × Avg Loss)
If expectancy is positive, long-term profitability is possible even with fewer winning trades.
2. Understanding Money Management in Trading
Money management is broader than risk management.
It focuses on:
👉 “How do I grow my account safely, steadily, and sustainably?”
Money management includes capital allocation, compounding, profit withdrawal strategy, and exposure limits. It is the long-term engine that helps traders survive for years.
2.1 Key Elements of Money Management
1. Capital Allocation
Avoid using all capital for trading.
Recommended:
Active Capital: 50% (for trading)
Buffer Capital: 30% (emergency, margin calls, drawdowns)
Long-term Investments: 20%
This protects you from unexpected drawdowns or market crashes.
2. Exposure Control
Exposure refers to how much of your capital is at risk across all open trades.
Examples:
Equity traders should avoid more than 20–30% exposure to a single sector.
Derivative traders must avoid multiple positions in the same direction.
For small accounts, 1–2 open trades at a time are ideal.
3. Scaling In & Scaling Out
Scaling techniques help manage profits better.
Scaling In:
Enter partially and add if the trade goes in your favour.
Example: 50% quantity at breakout → 50% on retest.
Scaling Out:
Book partial profits to secure gains.
Example: Book 50% at target 1 → trail SL → exit remaining at target 2.
Scaling reduces overall risk.
4. Compounding Strategy
Money management encourages growth through compounding.
Avoid jumping position sizes drastically.
Increase sizes only after:
✔ Consistent profitability for 20–30 trades
✔ Stable win rate (50–60%)
✔ Maximum drawdown below 10%
Slow compounding beats emotional overtrading.
5. Profit Withdrawal Strategy
Traders should withdraw part of their profits monthly.
Example:
70% reinvest
30% withdraw as real income
This protects you from reinvesting everything and losing it later.
6. Maximum Drawdown Control
Drawdown is the decrease from the peak equity curve.
A good trader keeps drawdown below 10–20%.
If drawdown exceeds limit:
✔ Reduce position size
✔ Stop trading for 1–2 days
✔ Re-evaluate strategy & psychology
This prevents account blow-ups.
3. Psychological Role in Risk & Money Management
Emotions can destroy even a perfect trading system.
Poor discipline leads to revenge trading, overtrading, removing stop losses, and taking oversized positions.
To stay disciplined:
Follow your trading plan
Accept losses as business expense
Do not chase profits
Maintain a trading journal
Review every trade weekly
Consistency comes from discipline—not predictions.
4. Practical Framework for Risk & Money Management
Here’s a step-by-step real-world plan:
Step 1: Define risk per trade
Risk 1% of capital per trade.
₹1,00,000 capital → ₹1,000 max risk.
Step 2: Decide stop-loss level
Use technical or volatility-based SL.
Example: SL = ₹10 away.
Step 3: Calculate position size
Position size = Risk ÷ SL
= 1000 ÷ 10
= 100 shares
Step 4: Set risk–reward
Aim for 1:2.
Target = 20 points.
Step 5: Avoid correlated trades
Do not buy Reliance + BPCL + IOC (same sector risk).
Step 6: Track overall exposure
Keep exposure under 25–30%.
Step 7: Handle profits wisely
Withdraw monthly profits.
Do not increase lot size until consistent.
Step 8: Manage drawdowns
If account falls 10–15%, reduce size by 50%.
Do not increase until account recovers.
5. Why Risk & Money Management Determine Long-Term Success
Most traders lose money not because they lack strategy, but because:
❌ They risk too much
❌ No SL or wide SL
❌ Overtrade after losses
❌ Use 10x–25x leverage blindly
❌ Increase lot size emotionally
❌ Chase market noise
Winning traders do the opposite:
✔ They limit losses
✔ Protect capital
✔ Aim for high RRR
✔ Stay patient
✔ Grow capital slowly
✔ Follow system like a business
Trading success is 10% strategy, 20% psychology, and 70% risk & money management.
Final Words
Risk Management keeps you alive,
Money Management helps you grow.
Together, they form the backbone of professional trading. The markets reward traders who think long term, manage risk smartly, and treat trading as a business—not a gamble. If you master these two pillars, even an average strategy can become consistently profitable.

Trading Journaling & Performance Tracking1. What Is Trading Journaling?
A trading journal is a structured record of every trade you take. It captures not only the technical details (entry, stop-loss, exit, timeframe, strategy) but also the emotional and psychological conditions during the trade. In simple terms, it is your personal trading diary.
A good trading journal helps you accomplish three critical objectives:
Identify patterns in your winning and losing trades.
Control emotions by documenting psychological triggers.
Improve your strategies through review and data-driven insights.
Whether you are a beginner or an experienced trader, a well-maintained journal is essential because the market constantly changes, but human behavior (your habits) often stays the same—until you correct it with feedback.
2. Why Trading Journaling Matters
a) Builds Discipline
Trading without a journal is like running a business without keeping accounts. You may earn profits occasionally, but you’ll never know what’s really working. Journaling forces you to follow rules and avoid impulsive decisions.
b) Helps You Learn From Mistakes
Most traders repeat the same mistakes—late entries, early exits, overtrading, revenge trading—because they never document them. Journaling exposes these harmful patterns.
c) Improves Strategy Effectiveness
When you review 50 or 100 trades of a single strategy, you can clearly see whether that setup is profitable or needs adjustment.
d) Strengthens Mindset & Emotional Control
By noting your emotional state before and during trades, you learn how emotions like fear, FOMO, greed, and panic affect your performance.
e) Converts Trading Into a Structured Process
Trading becomes predictable, measurable, and therefore improvable. This is the foundation of consistency.
3. What to Include in a Trading Journal
A professional trading journal usually includes the following elements:
1. Trade Details
Date & time
Market/instrument (NIFTY, BankNifty, stocks, forex, crypto)
Position type (long/short)
Timeframe (1D, 1H, 5min, etc.)
Entry and exit price
Stop-loss & target
Position size
2. Strategy Used
Breakout
Pullback
Trend-following
Price Action
Reversal
Indicator-based strategy (RSI, MACD, EMA, etc.)
This helps you track which strategy performs the best.
3. Pre-Trade Reasoning
Why did you take the trade?
What conditions were met?
Was the market trending, choppy, or volatile?
This ensures you are trading based on logic, not emotion.
4. Emotions Before, During, and After the Trade
Mark emotions such as:
Confident
Fearful
Greedy
Hesitant
Excited
Impulsive
This creates emotional awareness.
5. Trade Outcome
Profit or loss
R:R (risk-to-reward ratio)
Whether you followed your plan or not
6. Screenshot of Chart
This visually reinforces your learning.
7. Post-Trade Review
What went right?
What went wrong?
What could be improved?
Did you exit early or late?
Over time, these notes become extremely valuable.
4. Performance Tracking: Measuring Your Progress
While journaling captures trade-by-trade details, performance tracking converts those details into data for analysis.
It measures how well you are performing overall.
Here’s what to track:
1. Win Rate
Percentage of profitable trades.
A high win rate doesn’t always mean profitability—your R:R matters more.
2. Average Risk-to-Reward Ratio
Your average loss vs. your average gain.
A trader with a 40% win rate can still be profitable with a strong R:R.
3. Profit Factor
Total profit divided by total loss.
A profit factor above 1.5 is good; above 2.0 is strong.
4. Maximum Drawdown
Largest equity decline from a peak.
This helps understand your worst trading phase and how to manage risk better.
5. Monthly & Weekly Performance
Track:
Profit/loss
Number of trades
Mistakes made
Market environments
This shows how your performance changes with market conditions.
6. Strategy-wise Performance
Analyze which strategies give the best results:
Breakout strategy win rate
Reversal setups
Indicator combinations
Timeframe performance
Drop strategies that consistently underperform.
7. Psychological Performance
Track recurring emotional challenges:
Overtrading
FOMO entries
Early exits
Fear-based hesitation
You can create an emotion-mistake leaderboard and try to eliminate the top offenders.
5. Tools for Journaling and Tracking
You can use:
1. Excel/Google Sheets
Highly customizable and easy to use.
2. Dedicated Trading Journal Apps
TraderSync
Tradervue
Edgewonk
Notion (with custom templates)
3. Manual Notebook
Good for psychological and emotional notes.
4. Screenshots + Annotation Tools
Helps capture chart context.
The best tool is the one you will use consistently.
6. How Journaling Improves Trading Consistency
a) Clear Feedback Loop
Every trade becomes a lesson, not a random event.
b) Helps Identify Strengths
You’ll find:
Which time of day you trade best
Which setups fit your personality
Which markets give you the best results
You slowly refine your edge.
c) Eliminates Unforced Errors
When you see your repeated mistakes, you naturally work to eliminate them:
Moving SL
Taking trades outside strategy
Chasing entries
Over-exposure
d) Enhances Risk Management
Performance tracking highlights:
When you risk too much
When you break position sizing rules
Better risk = smoother equity curve.
e) Improves Emotional Intelligence
You become a calmer, more objective trader.
7. Monthly Review: The Secret Weapon
Every month, conduct a detailed review:
Top 5 best trades
Top 5 losing trades
Mistakes repeated
New patterns noticed
Strategy-level performance
Emotional stability score
Improvements for next month
This helps you evolve and refine your trading approach.
8. Long-Term Benefits of Journaling
After 6–12 months, a trading journal becomes a goldmine:
It shows your transformation as a trader.
It highlights your unique trading strengths.
It provides confidence during drawdowns.
It shapes your personal trading system.
Most importantly, it prevents you from being trapped in an emotional loop.
Professional traders treat journaling as mandatory.
Beginners treat it as optional—and that’s why they struggle.
Conclusion
Trading Journaling & Performance Tracking is not just a habit; it’s the backbone of trading success. While strategies help you enter and exit trades, journaling helps you refine your behavior, recognize patterns, control emotions, and develop consistency. It transforms your trading from guesswork into a structured, measurable, and improvable process.
If you want to grow as a trader, start journaling today. Even a simple step like writing down entries, exits, emotions, and mistakes can dramatically improve your performance. Over time, your journal becomes your personal trading mentor—one that knows your strengths, weaknesses, and the path to your success better than any external source.

#SMALLCAP INDEX BIG CRASH #Smallcap big crash on Card min 9-10% downside possible
level upto 14500
u can use SL 17k

PRICE ACTION ANALYSIS OF YOUR CHART (BTCUSDT)PRICE ACTION ANALYSIS OF YOUR CHART (BTCUSDT)
🟢 BUY SETUP (Bullish Scenario)
1️⃣ BUY ENTRY #1 — Break & Retest of 92,240 – 92,500 Zone
This zone is a major resistance.
A breakout above it confirms strong bullish momentum.
📌 ENTRY
Buy: 92,300 – 92,450
(After a breakout + retest candle, not inside consolidation)
📌 STOP LOSS (SL)
SL below retest zone: 91,700
📌 TAKE PROFIT (TP)
TP1 → 94,000 – 94,200
TP2 → 95,800
TP3 → 97,100
📌 PRICE ACTION REASON
Structure break above major resistance
Trendline break confirmation
Higher-high formation
Large liquidity zone above (clean traffic)
2️⃣ BUY ENTRY #2 — Pullback Into 90,300 Support
Your chart shows a horizontal blue line near 90,300–90,130.
📌 ENTRY
Buy at: 90,300 – 90,150
(Wait for bullish rejection wick)
📌 STOP LOSS
SL below structure: 89,800
📌 TAKE PROFIT
TP1 → 91,200
TP2 → 92,300
TP3 → 94,000
📌 PRICE ACTION REASON
Support formed around previous accumulation zone
Fake-out followed by impulse up (bullish sign)
Price respecting trendline + horizontal support
🔴 SELL SETUP (Bearish Scenario)
The red arrows on your chart highlight bearish continuation levels.
1️⃣ SELL ENTRY #1 — Break & Retest of 89,200 Zone (Major Level)
Price repeatedly reacts to this purple level → strong liquidity.
📌 ENTRY
Sell at: 89,200 – 89,100
(After bearish retest rejection)
📌 STOP LOSS
SL above level: 89,500
📌 TAKE PROFIT
TP1 → 88,200
TP2 → 87,000
TP3 → 86,700 (trendline bottom)
📌 PRICE ACTION REASON
Loss of support → becoming resistance
Bearish market structure (lower highs)
Clean traffic to downside (no strong support until next purple line)
2️⃣ SELL ENTRY #2 — Pullback to 90,300 Becomes Resistance
If the 90,300 level breaks DOWN, it becomes a good sell zone on retest.
📌 ENTRY
Sell at: 90,200–90,350
(Only if retested as resistance)
📌 STOP LOSS
SL: 90,700
📌 TAKE PROFIT
TP1 → 89,200
TP2 → 88,200
TP3 → 87,000
📌 PRICE ACTION REASON
Role reversal: support → resistance
Continuation in bearish channel
Lower-high formation
🟡 NO-TRADE ZONE
Avoid trading inside the black descending channel mid-area, especially around:
❌ 90,800 – 91,400
Because:
Price is choppy
Weak volume area
No clean structure
High chance of fake breakouts
Wait for clear breakout or breakdown.

GBPNZDI will be looking for buys on GN this week.
Technical reasons:
Price has flipped the 4H bearish structure and created a strong impulsive move to the upside. Since then, momentum into the demand zone has been weak, which is exactly what I want to see in a healthy pullback. There’s also liquidity resting above 4H high, which makes a great first target for the next leg up.
This is a high-probability setup, as it aligns with trend continuation.
Also price made accumulation and the demand zone just aligns with 70% pullback.
Let’s see how the market plays out.
