Bullish harmonic in GlenmarkThe ABCD pattern has been completed and confirmed for upside targets of 1950, 2025, and 2073 on the daily timeframe.
Entry above 1920.
SL be 1901
Harmonictraders

Double bearish pattern in Nifty50Originally, a gartley pattern was completed, and it gives lower targets till 25280, 25155, 25025.
While the targets are validating, it has given another bearish confirmation pattern of Head & Shoulder, which gives further lower targets, as mentioned in the video itself. Lower targets are 24850, 24760 levels.

PUNJAB NATIONAL BANKHello & welcome to this analysis
In July 2025 it activated a bearish Harmonic Butterfly pattern at 115 that lead to its current decline at 38 Fibonacci of its rally.
Going forward it could continue to decline till 100 where it would likely form two bullish Harmonic patterns - Shark & ABCD around the 50 Fibonacci retracement.
It has resistance now between 110 - 108 from where it fell with heavy volumes couple of days back.
All the best
Regards

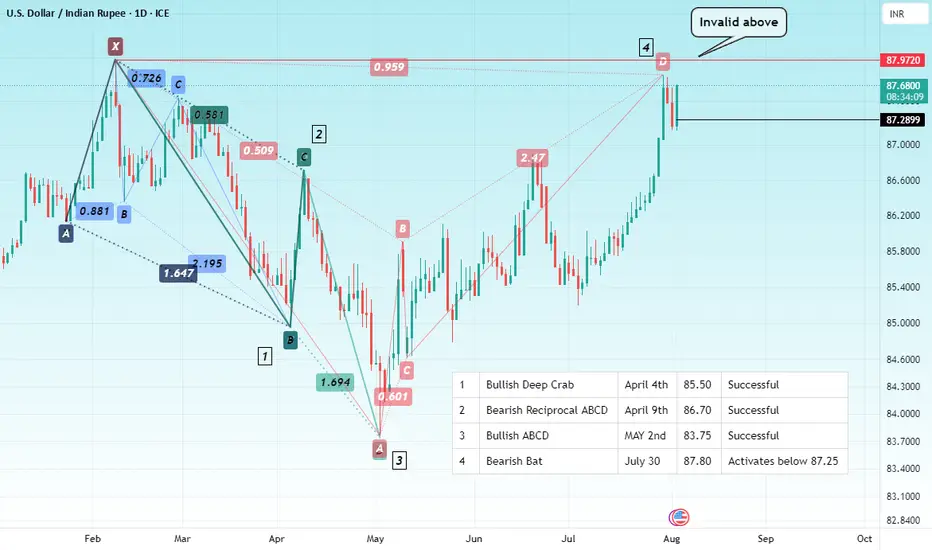
INDIAN RUPEE Hello & welcome to this analysis
$:INR has been swinging from a series of Harmonic Trading Patterns successfully this year as show in the chart.
With RBI POLICY coming up this week, will it be successful for the fourth time in a row?
Whatever it does, there is definitely going to be an impact of commodities particularly Crude, Gold & Silver that appear to be bullish.
All the best
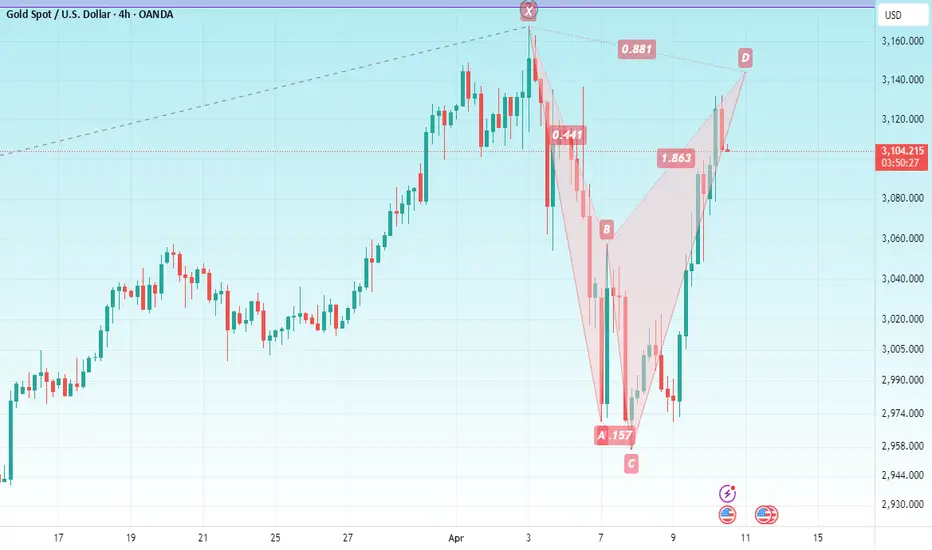
GOLDHello & welcome to this analysis
GOLD (Comex) 4hrs is going to enter the potential reversal zone of a bearish Harmonic Shark pattern between $3135 - $3155. Pattern negates above $3167.
Probable retracement levels $3100 / $ 3075 / $3025 / 2950
If it sustains above $3170-$3200 it gets v strong and will attempt $3300
Gold Price Today: Sharp Drop Followed by a Sudden SurgeLast night, the global gold price briefly dropped to 2,865 USD/ounce, but it quickly surged back to 2,905 USD/ounce by the morning of February 13, 2025, driven by an increase in demand for safe-haven assets. The initial drop in gold prices was triggered by inflation data from the U.S., with the January 2025 Consumer Price Index (CPI) rising by 0.5%, higher than the expected 0.3%, sparking concerns about the FED's ability to maintain low interest rates. This information dampened expectations of a rate cut, putting pressure on the gold market. However, despite a slight sell-off, concerns about rising inflation and geopolitical tensions continue to fuel strong demand for gold as a safe-haven asset.
The recovery in gold prices indicates that investors still trust the value of this precious metal as a hedge against global economic instability. From a technical chart perspective, gold is currently supported by the 2,879 USD/ounce level, setting the stage for a potential upward trend. The next target is to challenge the resistance level of 2,933 USD/ounce. If gold surpasses this level, it could quickly move toward the 2,950 USD/ounce mark. Breaking through the 2,933 USD/ounce resistance would open the door for a stronger rally in the short term, pushing gold toward higher levels and solidifying its position as an essential safe-haven asset in investment portfolios.

Harmonic Pattern Analysis of Axis Bank
Harmonic Pattern Analysis of Axis Bank.
this pattern is called as Bartley pattern as it perfectly following rules of gartely pattern.
I have marked reversal area.
Target I will comment later.. IF IT REVERSES SUCCESFULLY.
This is only for educational purpose.

Finolex Industries LTD view based on harmonic patternsMy view on Finolex Industries LTD, as you can see there is nice gartely pattern has been formed , alongwith that it has got support at 0.78% fib level.
Based on FIB level , target is marked and SL is also placed.
So, lets look how it turns.
Thank you.
#finolexindustries #harmonicpatterns #finolex #harmonictrader

AARTI INDUSTRIES TECHNICAL VIEWThis is my view on Aarti Industries based on harmonic patterns.
On daily time frame Gartely pattern is visible, along with that bullish pattern is seen, 2 targets have identified, lets see how it goes.
Thank u, This is just my view and not recommendation for trade.
Please trade with the help of your financial advisor.
#aartiindustries #harmonicpatterns #technicalanalysis

BAJAJ FINSERVE Hello & welcome to this analysis
Stock is completing its triangle and appears all set to break above it.
Accumulation between 1550-1650 looks like a good idea for upside potential of 2300.
View negates below 1325
Happy Investing

Titan - Weekly TF - Long Term0.5 Retracement point found in previous swings.
Potential AB=CD pattern marked in the chart. Supply and demand zones identified.
If resistance is broken then the potential target is marked.
Until then it is sideways between supply and demand zones.

HIGHER HIGH IN BHARTI AIRTELBharti Airtel is near its ATH; an attempt has been made to break it but still below the breakout level. This week's closing will decide whether to consider it for a mid-long term swing. Target is calculated according the ABCD pattern of Harmonics.

ONGC -Turning Upside Down (Picked 60 for 200 / 300)- Careful!Disclaimer:
Trading in financial markets involves substantial risks. Consult your financial advisor before making decisions. This commentary is not a solicitation to buy or sell.
WaveTalks - Market Whispers: Can you hear them?
April 2024
Stock reached close to 300 & completed all its target as expected in 2020 .
Time to be careful ? Why ?
Close to Resistance of 314 . Unfolding Bearish Bat with PRZ 88.6% classic zone 300-275 . Stock topped at 287
Stop loss
Pattern invalidates above 287 .
June 2020
Video Idea ( Short Term Sell & Long Term Pick holding 55-60 for 200+ & 300+)
Dec 2020
Follow up - Did you pick this stock for your portfolio
Nov 2021
Reaching close to 210 Target

LONG TERM VIEW FOR "DELHIVERY"The current monthly chart is showing a perfect price-action for value-investing. The main advantage why we should consider reversal trading as our best-shot strategy is a good risk-to-reward ratio. The XABCD patterns for the current impulse wave helps us to find out the potential long term targets for the scrip.

BankNifty - The Last Leg in Bearish Bat 45600 to 47000 Disclaimer:
Trading in financial markets involves substantial risks. Please consult your financial advisor before making any trading decisions. This message is not a solicitation to buy or sell. Perform your due diligence.
WaveTalks - Market Whispers: Can you hear them?
As discussed in the last idea today - 19th jan 2024 during last hour of trading. Index holded 45550-45600 zone rallied upside towards 45700+
We suggested to have patience & buy close to 45600
Strict Stops below 45550
Happy Saturday Trading !!!

ABCD under formation in AUBANKAUBANK is forming a harmonic pattern (possible) ABCD.
The projected completion point is 788.20 spot price.
The invalidation point for this pattern will be 758.35, the price if rejected from here and breaking the B level will invalidate this pattern.
The stock is for analysis for possible trade opportunities for SELL on the completion of this pattern.

long tradeusingharmonic method
buy trigger for target range 2600-50
stop as per comfort
supportive indicator used for this buy entry are
ichimoku, rsi
disclaimer - trade @ own risk

SBI Card buying strategyNot so perfect but ABCD pattern is finished and now it is a buying opportunity above 796 with targets of 806.50, 815, 823, 849.50
Stop loss will be below 786 and once the T2 is reached it will be shifted to entry to safeguard the capital.

MARUTI Hello and welcome to this analysis
Maruti has been a rank outperformer now for 2 decades. Stock has currently reacted to a resistance suggesting probability of some more pullback.
Overall stock has tremendous potential for further upside over medium to long term. Investors could look at an opportunity to add via SIP in the broader range 9500-11000 while traders can look for swing trading opportunities with resistance near 10400-500 and support at 9800-9600.
Happy Investing

Long PIIND for Target of 3698PIIND on daily chart has formed harmonic pattern and has potential for bullish run now.
Stop Loss on closing basis - 2899
Target 1 - 3289
Target 2 - 3630
Target 3 - 3698
If target 3 is achieved then 4051 is next target after retracement.

EXXARO TILE 190 ?we can long exxaro tile from long time we can see good consolidation in this particular scripts, lower swings are getting upper day by day. and upper swing are getting compressed. we can see a good move as per harmonic upto 190 in this particualr script
thanks

DOLLAR INDEXHello & welcome to this analysis
In the daily time frame it has now come to a falling trendline resistance which has also activated a Bearish Harmonic Reciprocal ABCD pattern. Coincidentally, the swing low was also formed with a Bullish Harmonic ABCD pattern.
A retracement from here could take it to 102.75 and below that 102.15. The pattern would be considered negated above 103.90

#AARTIIND LongAARTI INDUSTRIES creating a wonderful opportunity for a LRHR trade setup with only one down leg pending. Considerable buying range is 450-440 with a stoploss of 425. The Double zig-zag corrective waves is in its final leg supported by a classic Gartley harmonic pattern and also a classic crab in DTF.
