Simple Trend Analysis with BreakoutDisclaimer: This is just an a price action analysis of stock Tata Motors. Don't consider this as an stock tip or advice. Invest/Trade at your own risk.
HAVELLS
Havells: ABC Correction Complete… Is the Big Wave 5 Rally Next?
🧠 Market Structure & Elliott Wave Context
Havells India has completed a classic corrective Wave 4 (A–B–C) and is now trading inside the most important Wave C completion zone (₹1,391–₹1,412).
This zone aligns with the extended structure of Wave 4 and represents a high-probability reversal area 🔥.
Price has:
Formed a clean impulsive Wave 3 top
Retraced into a wide Wave 4 demand zone
Completed the A → B → C corrective pattern
Retested liquidity pockets multiple times — indicating seller exhaustion
This is exactly where Wave 5 rallies often begin 📈.
📚 Educational Insights
📘 Why Wave 4 Takes Longer & Looks Messy:
Wave 4 is naturally slow, overlapping, and tricky — designed to trap impatient traders.
That’s why identifying the end of Wave 4 can create a strong risk–reward setup.
📉 The ABC Structure (Textbook Correction):
• Wave A = first drop
• Wave B = retracement
• Wave C = final flush
Havells completed all three waves clearly inside the demand zone.
🎯 Fib-Based Completion Zone (1,391–1,412):
This range aligns with the correction depth expected for Wave 4 (38.2%–50% retracement of Wave 3).
It’s also previous structure support → increasing reversal probability.
🌀 Wave 5 Logic:
Wave 5 tends to be trend-resuming and often extends to 0.618–1.0 Fibonacci extensions of Wave 4.
Targets on the chart align with this perfectly.
🎯 Upside Prediction & Wave 5 Targets
If Havells reverses from the zone and breaks structure:
🚀 First Swing Target: ₹1,744
(At 0.50 Fibonacci retracement of Wave 4)
🚀 Second Target: ₹1,950
🚀 Mid to Long-Term Target: ₹2,200+
(Wave 5 extended projection)
🛑 Stop Loss (Daily Close): ₹1,375
A close below this invalidates Wave 4 structure & ABC completion.
📈 Risk–Reward Calculation
Entry Zone: ₹1,391–₹1,412
SL: ₹1,375
Target 1: ₹1,744
👉 Approx Reward = ₹330
👉 Approx Risk = ₹20–₹30
🔥 Risk–Reward Ratio = 1 : 10 to 1 : 15
(One of the strongest R:R setups based on wave structure)
💡 Trading Strategy (Educational Only)
🟢 Entry Strategy:
Wait for bullish reversal candles (Hammer / Engulfing / ChoCH) inside ₹1,391–₹1,412.
Aggressive traders may enter on positive momentum candles.
📈 Confirmation Strategy:
A close above ₹1,568–₹1,600 strengthens Wave 5 activation.
🎯 Targets:
• Partial at ₹1,744
• Hold remaining for ₹1,950 and ₹2,200
⚖️ Risk Management:
• Hard SL: ₹1,375
• Risk max 1–2% of capital
• Trail SL as price makes higher lows
🧩 Summary
Havells is sitting right inside a high-probability Wave 4 completion zone, with the full A–B–C correction now complete.
If structure confirms bullish, a powerful Wave 5 rally targeting ₹1,744 → ₹1,950 → ₹2,200 could unfold.
This setup offers exceptional risk–reward and aligns seamlessly with Elliott Wave theory ⚡.
⚠️ Disclaimer
Not a SEBI-registered analyst.
This analysis is for educational purposes only, not investment advice.

HAVELLS 🧩 Havells India – Inverse Head & Shoulders Breakout Formation (Bullish Reversal Setup)
🧠 Description:
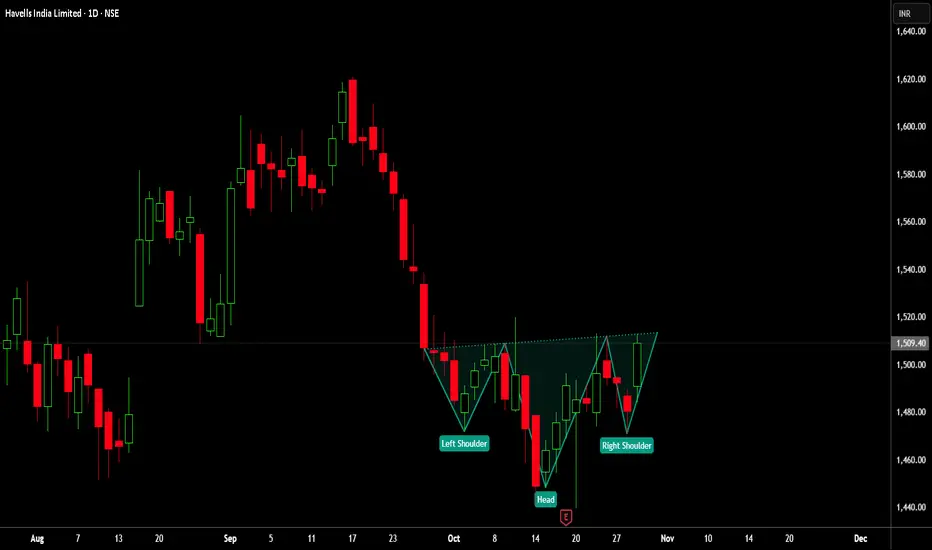
The Havells India Ltd (Daily) chart is displaying a potential Inverse Head & Shoulders pattern — a classic bullish reversal formation often seen near market bottoms.
🏗️ Pattern Structure:
The Left Shoulder formed in early October 2025.
The Head was completed near mid-October with a strong rejection candle around ₹1,440.
The Right Shoulder is now shaping up with consistent higher lows, showing accumulation signs.
The Neckline Resistance lies near ₹1,515–₹1,520.
A breakout and daily close above the neckline could trigger further upside momentum.
📊 Technical Highlights:
RSI: Recovered from oversold zone and sustaining above 50 — confirming bullish momentum.
Volume: Gradual rise in volume indicates possible institutional participation.
Trend Structure: Formation of higher highs and higher lows post-head formation.
🔑 Key Levels:
📍 Neckline Zone: ₹1,515–₹1,520
📍 Breakout Confirmation: Daily close above ₹1,520
📍 Immediate Target: ₹1,560
📍 Extended Target: ₹1,600–₹1,625
📍 Stop Loss: Below ₹1,470 (Right Shoulder low)
🧭 Trading Plan:
✅ Entry: On sustained move or daily close above ₹1,520
🔒 Stop Loss: Below ₹1,470
🎯 Targets: ₹1,560 → ₹1,625
📈 View:
Bullish (Swing/Positional) — If the neckline breakout sustains, Havells India could see momentum continuation toward higher resistance levels.
📰 Watchlist Note:
Keep this setup under your watchlist for breakout confirmation.
Always Do Your Own Research (DOYR) before acting.
❌ No Buy/Sell Recommendation.
🙏 Thank You for Reading!
👍 BOOST if you found this useful.
📌 FOLLOW for more market setups.
💬 COMMENT below with your analysis or feedback.
⚠️ Disclaimer:
I am not a SEBI REGISTERED RESEARCH ANALYST AND INVESTMENT ADVISER.
This analysis is intended solely for informational purposes and should not be interpreted as financial advice.
Please consult a qualified financial advisor or conduct thorough research before making investment decisions.
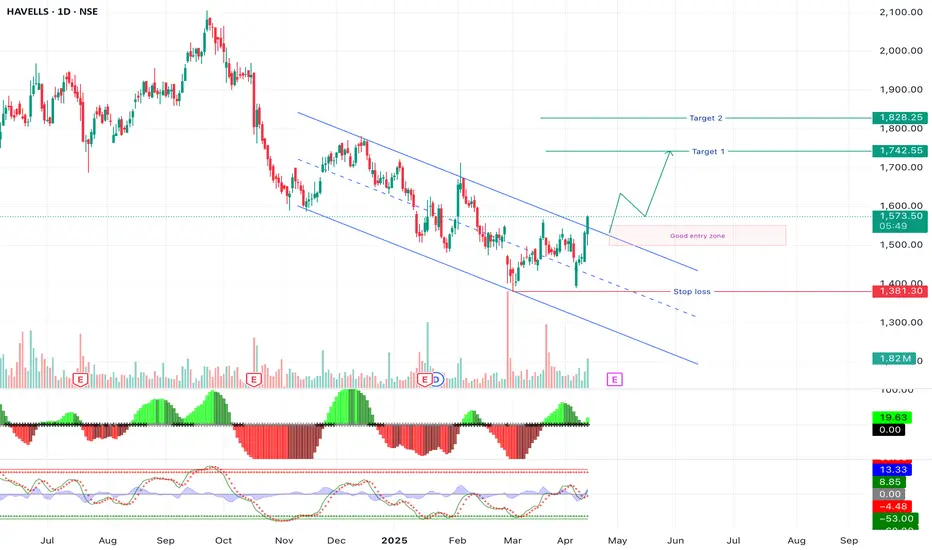
Havells Bullish Flag Breakout: Can We See a Rally to 1680+?Havells India Ltd. is currently showing a classic bullish technical setup—a Bullish Flag Pattern—that could lead to a potential breakout and strong upside movement in the short term. Traders who favor breakout-based strategies should pay close attention to this chart, especially considering the structured parallel channel and previous rally that preceded it.
1. Bullish Flag Pattern: Anatomy of the Setup
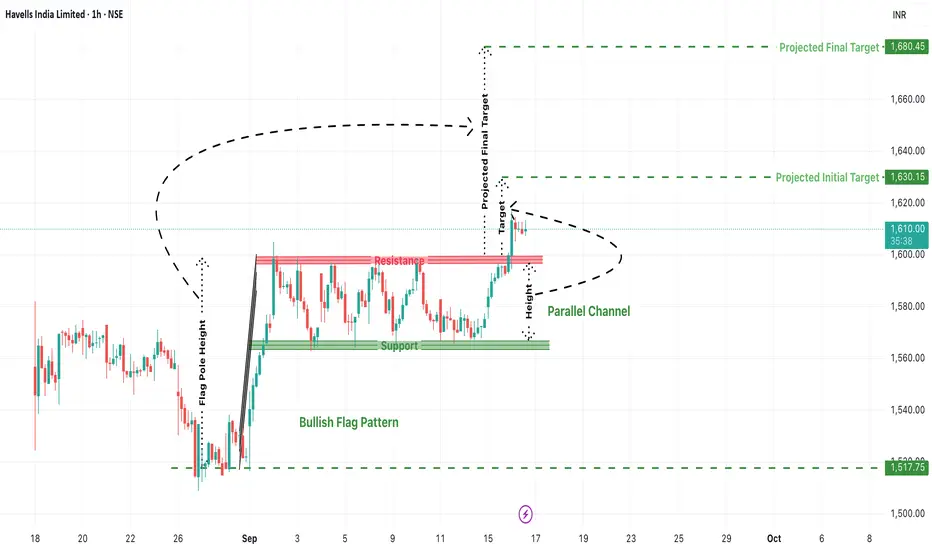
A bull flag is a continuation pattern that occurs after a sharp price rise (flagpole), followed by a period of consolidation within a narrow parallel channel (the flag). This structure typically suggests that the bullish trend will resume once the price breaks out of the flag range.
In Havells:
Flag Pole: The stock surged sharply from the 1517 zone to near 1610, forming a vertical rise.
Flag/Channel: Price moved sideways within a narrow support at ~1570 and resistance at ~1610, creating a clean parallel channel.
This shows price compression after a strong move, typically a sign of healthy consolidation before another leg up.
2. Breakout Levels and Price Action Confirmation
As per the current chart:
Havells has broken above the resistance zone around 1610, signaling a potential breakout.
The breakout candle is attempting to close above the red resistance band, and follow-up candles will be crucial to confirm strength.
A retest of this breakout zone could offer ideal long entries.
3. Projected Targets from the Pattern
Using the flagpole height, we can project upside targets from the breakout point:
Initial Target: ₹1630.15
A conservative target based on minor resistance and pole extension.
Final Projected Target: ₹1680.45
This marks the full measured move and could be achieved if the rally sustains momentum.
4. Ideal Trading Plan (For Traders)
Entry:
After confirmed breakout above ₹1610
Or on retest near ₹1600–1610 zone with bullish price action.
Stop Loss:
Below the flag support zone at around ₹1570
Aggressive traders can keep it below ₹1585.
Targets:
T1: ₹1630
T2: ₹1680+
Risk-Reward Ratio:
Minimum 1:2 depending on entry price.
5. Risk Scenarios to Watch For
False Breakouts: If the breakout doesn’t sustain and price falls back into the channel, it may trap early longs.
Macro Events: Broader market volatility (Nifty moves or global cues) can impact momentum.
Volume: Lack of volume on breakout candles can reduce conviction—always monitor volume to confirm strength.
Conclusion: Havells Looks Set for a Fresh Rally
This is a textbook bullish flag breakout in formation, with clear upside potential. If the momentum sustains, Havells could very well reach 1680+ in the coming sessions. However, traders must practice disciplined risk management, wait for confirmation, and avoid chasing without a proper plan.
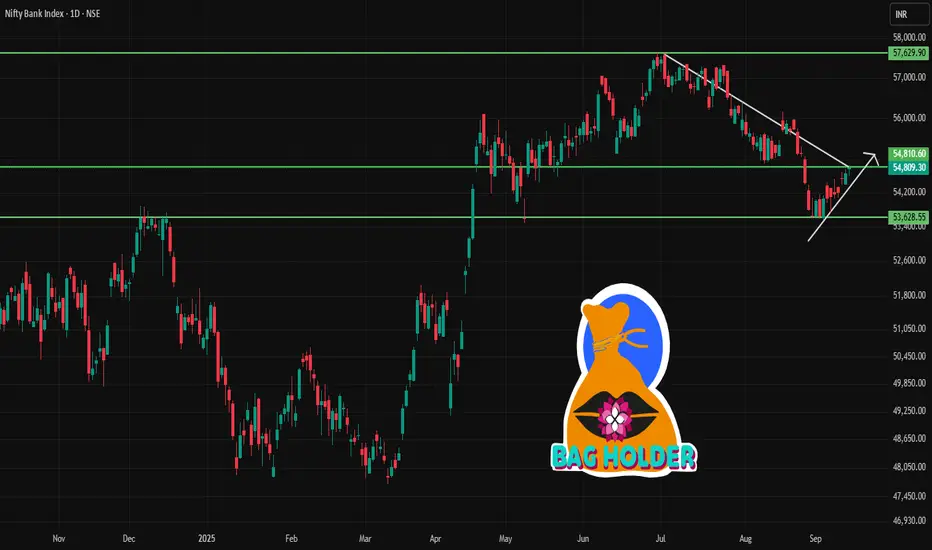
BANKNIFTY 1D Time frame📉 Current Market Snapshot
Closing Price: ₹54,809.30
Day's Range: ₹54,580.35 – ₹54,852.25
52-Week Range: ₹47,702.90 – ₹57,628.40
Market Cap: ₹45,50,788 crore
P/E Ratio: 14.9
Dividend Yield: 1.09%
Price-to-Book Ratio: 2.03
1-Year Return: +5.87%
5-Year Return: +147.36%
10-Year Return: +12.5%
ICICIBANK 1D Time frame📍 Current Price
₹1,417.70 (closing price)
Short-Term Outlook
Bullish Scenario: A sustained move above ₹1,430 could lead to a test of the 52-week high around ₹1,500.
Bearish Scenario: A drop below ₹1,390 may signal a potential pullback toward ₹1,350.

KOTAKBANK 1D Time frame📍 Current Price
₹1,972.30 (unchanged from previous close)
Short-Term Outlook
Bullish Scenario: A sustained move above ₹2,000 could lead to a test of the 52-week high around ₹2,301.90.
Bearish Scenario: A drop below ₹1,950 may signal a potential pullback toward ₹1,900.

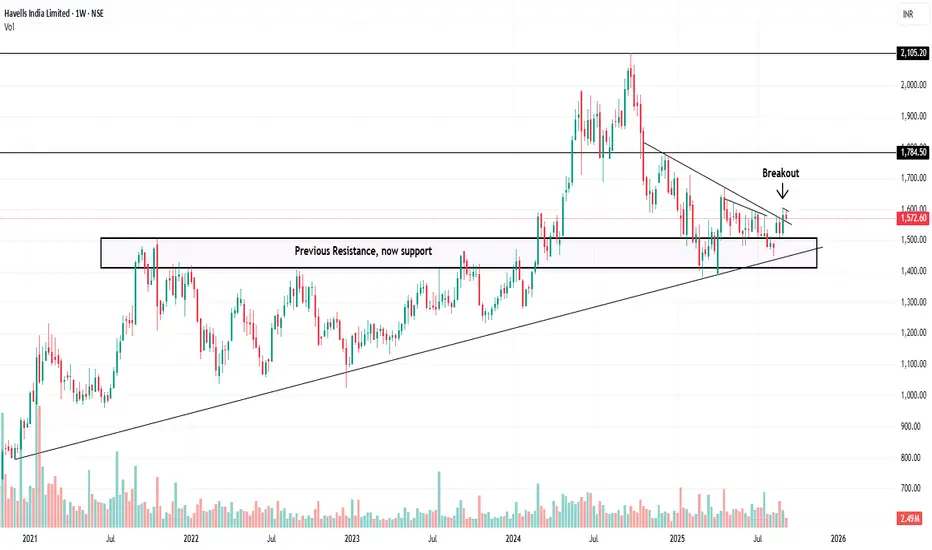
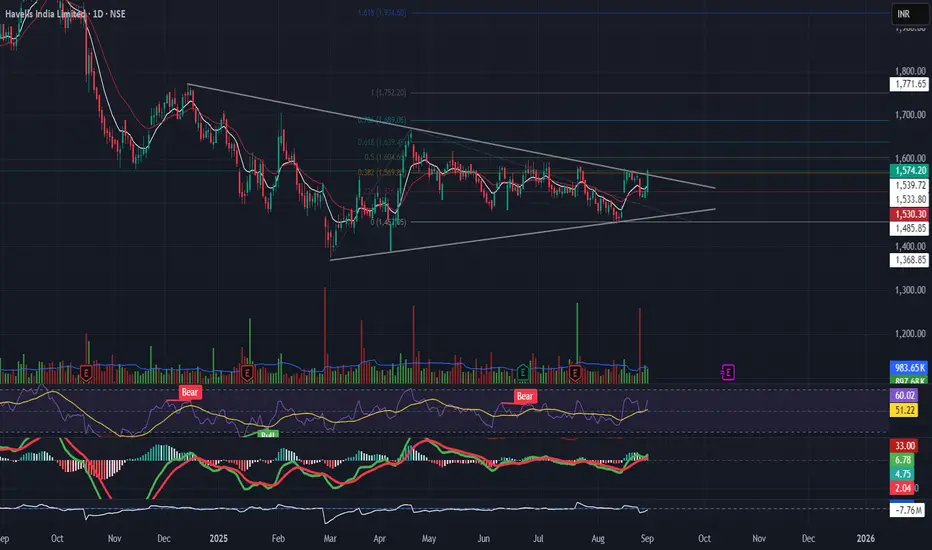
Havells breakout from symmetrical triangle patternHavells had Breakout from symmetrical triangle at the ₹1,570 descending resistance. RSI near 60, MACD recovering and moving up. Watch for volume-backed breakout.
Breakout above can fuel a move to ₹1,690–₹1,750.
Stop near ₹1,485.
🔌 Electrical sector needs confirmation for momentum entry."
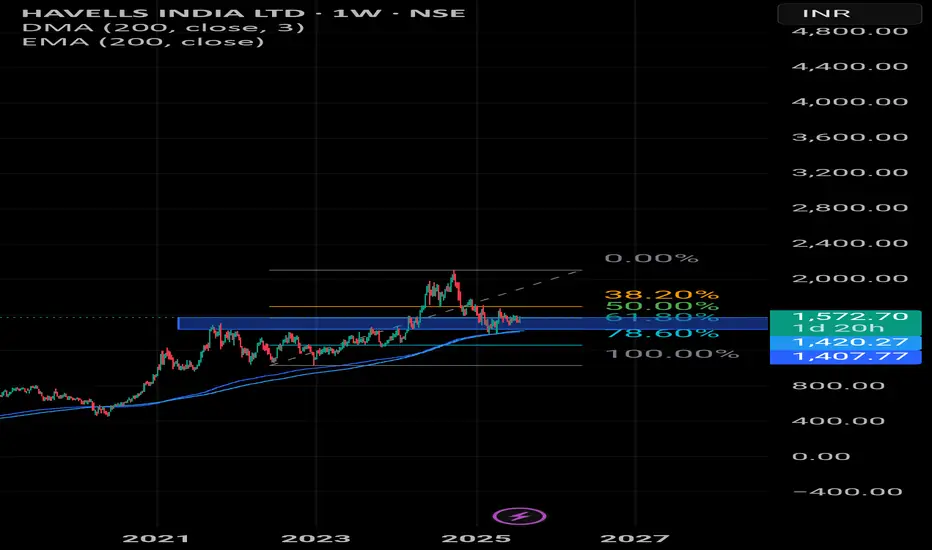
HAVELLS INDIA This stock is looking looking for reversal on weekly timeframe with Fibonacci retracment levels with Ema and dma of 200.
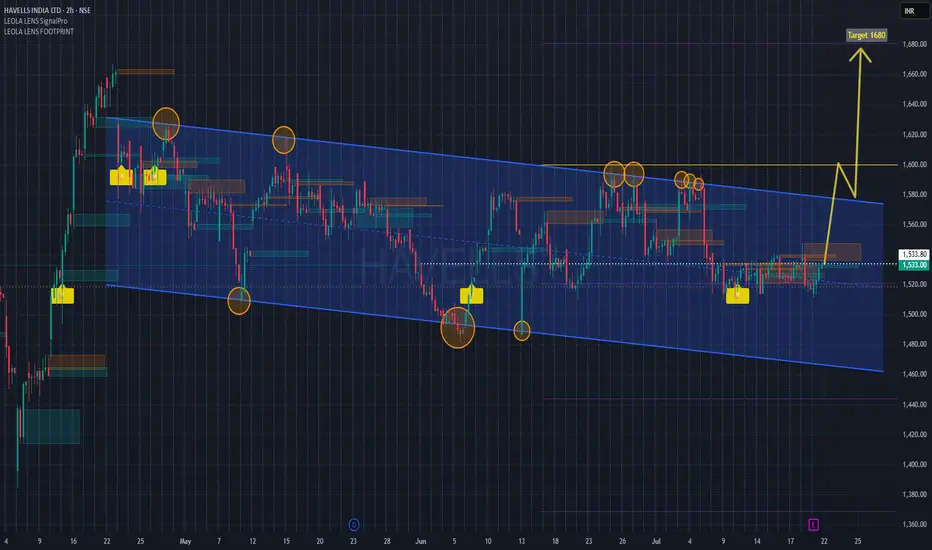
HAVELLS Channel Breakout Setup with Earnings Ahead Havells is approaching a crucial resistance trendline within a well-defined downward sloping channel. Price currently tests mid-channel and historical supply zones, with multiple Leola Lens SignalPro yellow caution labels plotted—historically seen before directional reversals.
📌 Structure Highlights:
Clear channel formation since April
Multiple resistance rejections near 1580 zone
Buy interest seen near lower boundary with SignalPro confirmation
Breakout projection suggests target zone near 1680, aligning with prior volume gap
📅 Earnings event likely to be a catalyst. Monitor price behavior post-results for potential breakout confirmation above 1580.
🧠 Leola Lens™ SignalPro Notes:
Yellow caution labels have repeatedly appeared near key turning points within the channel, suggesting possible trend transition zones. These zones highlight moments of institutional activity, where smart money behavior often shifts.
The yellow caution markers indicate potential trend change zones, based on historical conditions where price has shown institutional interest or liquidity shifts. These zones are not direct buy/sell signals, but highlight areas to monitor closely for structural confirmation.
🧠 This chart is intended for educational and structural analysis only. No financial advice.
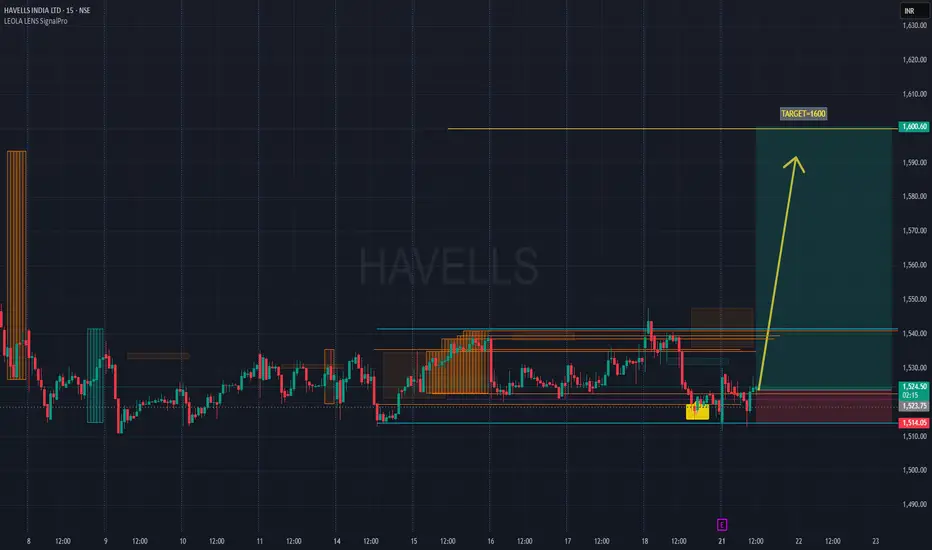
HAVELLS Pre-Result Reversal Watch I Holds for Potential 1600Chart Type: 15-minute | Tool Used: Leola Lens SignalPro
Price action has rebounded from a key liquidity zone (highlighted yellow) with visible accumulation below ₹1,520.
Key Observations:
Price retested prior demand zone (marked by SignalPro with structure and volume signals).
Potential bottom formation visible intraday with higher low attempt post 12 PM.
Rejection of downside wick near ₹1,514, aligning with earlier liquidity pockets.
Idea View:
If price sustains above ₹1,525–₹1,530, possible momentum expansion toward resistance zone at ₹1,600.60.
Clean structure break above previous order blocks may attract trend traders.
Result-based volatility expected — manage risk, especially with expected earnings post-market today.
Risk Reference Zone:
Invalid below ₹1,510 (red shaded zone)
This is not financial advice. Chart is for educational and structural reference only.
#HAVELLS #PriceAction #ChartAnalysis #MarketStructure #SignalPro #LiquidityZones #TechnicalAnalysis #TrendReversal #NSEStocks #EarningsSetup
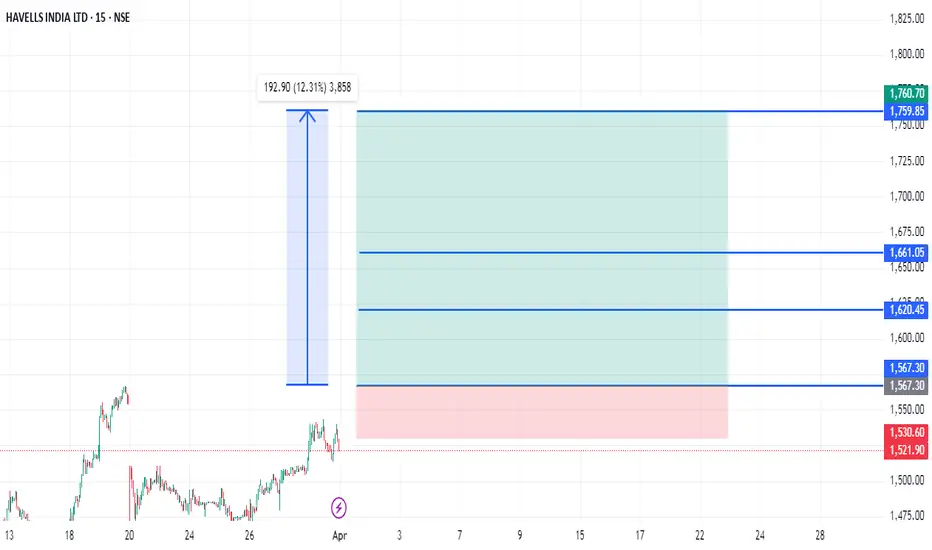
HAVELLS STRONG READY TO FLY 193 POINTS Havells strong zone above only 1567
Short term buy zone
Wait for Active
Buy above 1567
Stoploss.......1530....37 points
Target1.........1620...53 points
Target2.........1660...93 points
Target3.........1760...193 points
Disclaimer- This level only educational purpose and paper trade only. Do ur own analysis
Havells Long l Swing Moving out of channel
Volume greater than average volume
Making higher high, change of character
Can wait for some reversal for better risk rewards
Targets and SL as given in the chart
HAVELLS DOUBLE BOTTOM REVERSALHavells breaking double bottom reversal
with good volume building up
bullish rsi,macd crossover done
#resistance at 1670-1700
NO BUY SELL RECOMENDATION

Price action analysis that will give you edge over othersI daily make educational content videos for swing / positional trading

W Pattern Neckline & Falling Trendline Breakout seen in HavellsHello Everyone, i hope you all will be doing good in your trading and your life as well. Today i have brought a stock which has taken perfectly support at upward support trendline and formed a double bottom (W) pattern and also given a faliing resistance trendline breakout on daily timeframe price is still above to neckline and falling resistance trendline. Stock is giving good discounted entry price at these levels. Stock is down almost 17% from all time high., stock name is Havells India Limited and it is a leading Fast Moving Electrical Goods (FMEG) Company and a major power distribution equipment manufacturer with a strong global presence. It enjoys enviable market dominance across a wide spectrum of products, including Industrial & Domestic Circuit Protection Devices, Cables & Wires, Motors, Fans, Modular Switches, Home Appliances, Air Conditioners, Electric Water Heaters, Power Capacitors, Luminaires for Domestic, Commercial and Industrial Applicationsand.
Company is almost debt free.
Company has been maintaining a healthy dividend payout of 42.5%.
Company's working capital requirements have reduced from 16.7 days to 12.6 days.
Stock is good for short term to long term, Company is consistent profit maker every year it is posting exponantial growth on profits.
Market Share
The company has a market share of 10-15% for products like modular switches, SDA, Lighting, cables, and ACs and a 15-20% market share in the water heaters, MCBs, fans, and wires business.
Fundamental Analysis
P/E ratio is 76.3379 which is lower than it's Industry P/E 76.34
Interest Coverage ratio is 21.28
Stock has given a return of 30.9% in last 52 Weeks
ROCE is 25.46%
ROCE 25.46% has increased as compared to last year's ROCE 23.07%
ROE is 18.07%
ROE 25.46% has increased as compared to last year's ROE 23.07%
Operating Profit Margin (EBITDA Margin) is 10.12%
Operating Profit Margin (EBITDA Margin) 10.12% has improved as compared to last year's OPM 9.58%
Net Profit Margin (PAT Margin) 6.84% has improved as compared to last year's NPM 6.34%
Free Cash Flow yield is 1.32%
Free Cash Flow yield 1.32% has improved as compared to 5 Yrs avg FCF yield 1.19%
Cash Conversion Days 10.39 has improved as compared to 5 Yrs avg Cash Conversion Days 11.24
Annual Profit has grown over by 18.56%
3 Years Sales CAGR is 25.34%
3 Years Profit CAGR is 20.03%
Quarterly Sales has grown over by 16.38% YoY
DII have increased their stakes by 0.39% in the latest quarter (8.28% to 8.67%)
Promoters + FIIs + DIIs hold 92.84% in the company
Disclaimer:- Please always do your own analysis or consult with your financial advisor before taking any kind of trades.
Dear traders, If you like my work then do not forget to hit like and follow me, and guy's let me know what do you think about this idea in comment box, i would be love to reply all of you guy's.

Havells - Low Risk IdeaCMP 1614 on 05.11.24
The chart is self-explanatory. Since 2021, the blue-colored parallel channel has been turned into a support ( if works like ). If the price bounces back from the support, may go into a bullish phase. targets may be 1700/1800/1900.
MACD histogram also shows some reversal.
The setup goes weak if sustains below 1550.
Keep your position size according to the stop loss and your trading strategy.
All this illustration is my own view, only for learning and sharing purposes, not a trading recommendation in any form.
All the best.

Havells India - At strong support areaStrong support area at 1685 - 1700
Target areas 1900 - 2100
View negates below 1670
Wait for at least a base candle to be formed
It may start with D-B-R

HAVELLS - Ichimoku Breakout📈 Stock Name - Havells India Limited
🌐 Ichimoku Cloud Setup:
1️⃣ Today's close is above the Conversion Line.
2️⃣ Future Kumo is Turning Bullish.
3️⃣ Chikou span is slanting upwards.
All these parameters are shouting BULLISH at the Current Market Price and even more bullishness anticipated AFTER crossing 2050.
🚨Disclaimer: This is not a Buy or Sell recommendation. It's for educational purposes and a guiding light to learn trading in the market.
#CloudTrading
#IchimokuCloud
#IchimokuFollowers
#Ichimokuexpert
Excited about this analysis? Share your thoughts in the comments below!
👍 Like, Share, and Subscribe for daily market insights! 🚀
#StockAnalysis #MarketWatch #TradingEducation #ichimoku #midcap #smallcap #largecap #HAVELLS

Havells cmp 2006.55 by Weekly Chart viewsHavells cmp 2006.55 by Weekly Chart views
- Volumes are steady to increasing regularly on demand based buying
- Weekly basis Support at 1815 > 1585 > 1370 with Resistance only ATH 2023 and each New ATH
- *Price movement traversing within an assumed combination of Darvas Box + a Bullish Rising Parallel Price Channel*

HAVELLS F&P BREAKOUT WCBHAVELLS breaking f&p pattern weekly basis
with good volume building up
rsi in bullish zone
#target 2300
EDUCATIONAL IDEA

HAVELLS - Ascending triangle - Breakout - DailyName - HAVELLS
Pattern - Ascending triangle Breakout
Timeframe - Daily
Volume - Good volume
Cmp - 1996
Target - 2351
SL - 1957
Always welcome for any comments with your feedback or give it a like if you find it useful.

Havells - Tf 75 - Mid Term - Elliot wavesHello Friends,
Currently, movement is sideways to bullish. Stock is taking support on 61.8% retracement of A wave.
Stock is completing corrective fall in B wave, hence the speed/movement is slow.
Wave C has mostly started, invalidation level is marked too.
Targets as per Fib extension given.
