Trading With AI Is Easy1. AI Simplifies Market Analysis
One of the biggest challenges in trading is understanding the market. Human traders spend hours studying charts, indicators, and historical data. AI solves this challenge by processing vast amounts of information within seconds. Machine learning algorithms can analyze:
Price trends
Volume patterns
Global news
Social media sentiment
Economic indicators
Historical correlations
This allows AI systems to provide a deeper and more accurate view of market conditions. Instead of manually reading dozens of charts, traders simply rely on AI-generated insights that highlight trends, warn of risks, and predict probable outcomes. This drastically reduces the time and effort required to make decisions.
2. AI-Powered Predictions Improve Accuracy
AI excels at recognizing patterns that humans often overlook. Advanced models such as neural networks observe millions of data points simultaneously and forecast price movements based on probability. Although AI cannot guarantee 100% accuracy, it significantly improves the reliability of predictions compared to traditional manual analysis.
For example:
AI can identify early signs of trend reversals before they appear clearly on charts.
Predictive algorithms can estimate the strength of momentum, volatility, and breakout potential.
Sentiment analysis tools can detect market mood shifts in real time.
These capabilities help traders make more informed decisions and avoid emotional pitfalls like fear, greed, and panic.
3. Automation Makes Trading Easier
AI's greatest advantage lies in automation. Automated trading—often called algorithmic trading—uses AI systems to execute trades without human intervention. Traders simply set the rules, and the AI executes them flawlessly. This leads to:
Faster order execution
Reduced slippage
Removal of emotional bias
Consistent performance
24/7 trading even when the trader is offline
Automated systems handle multiple indicators, timeframes, and markets simultaneously, something humans cannot manage manually. This makes trading easier and more efficient for both beginners and professionals.
4. AI Helps Eliminate Emotional Trading
Humans are naturally influenced by emotions such as fear, hope, and excitement. These emotions often lead to bad decisions—entering trades too early, exiting too late, or over-trading.
AI, on the other hand, is emotionless.
It operates purely on data and logic, ensuring:
Discipline
Consistency
Accuracy
Strict adherence to strategy
This helps traders avoid common psychological traps and maintain a stable, long-term approach.
5. AI Reduces the Learning Curve
For beginners, trading can feel overwhelming. Understanding technical indicators, chart patterns, and market fundamentals usually requires months of learning. AI tools simplify this process by offering:
Ready-made strategies
Automated signals
Visual dashboards
Clear buy/sell suggestions
Real-time risk assessment
Instead of learning everything manually, traders can rely on AI tools to guide them. This shortens the learning curve and makes trading accessible even to those without deep financial knowledge.
6. AI Enhances Risk Management
Risk management is the foundation of successful trading. Many traders fail not because their strategy is wrong, but because their risk management is weak. AI enhances risk control by:
Automatically adjusting position sizes
Setting optimal stop-loss and take-profit levels
Predicting potential drawdowns
Detecting high-risk market conditions
Avoiding trades during unpredictable volatility
AI’s ability to quantify and manage risk makes trading far safer and more predictable.
7. Real-Time Market Monitoring
Markets change quickly. A sudden news event can cause massive price movements. No human can monitor markets every second, but AI can. It constantly scans:
Charts
Data feeds
News
Economic calendars
Sentiment trends
AI then instantly alerts traders or automatically executes strategies. This ensures traders never miss opportunities or fail to react during major events.
8. AI Provides Personalized Trading Experience
Modern AI tools learn from each trader’s behavior. They adjust based on:
Trading style
Risk tolerance
Preferred markets
Timeframe selection
Past performance
This personalization creates a trading system that evolves over time and becomes smarter every day. Beginners get guidance, while experienced traders get advanced insights tailored to their strategies.
9. AI Supports All Markets
AI is not limited to one market. It works across:
Stocks
Forex
Cryptocurrencies
Commodities
Indices
Derivatives (options & futures)
The same AI engine can track global markets simultaneously, giving traders a diversified edge.
10. Backtesting and Strategy Optimization Become Easy
Before using a trading strategy, it must be tested. AI makes this easy by running backtests using years of historical data. It can simulate thousands of trades within minutes. Traders can instantly see:
Profit and loss potential
Drawdowns
Win rate
Strategy performance in different market conditions
AI can also fine-tune strategies by optimizing parameters automatically, producing better results over time.
11. Time-Saving and Efficient
Trading used to require hours of chart analysis daily. With AI:
Daily analysis takes seconds
Signals are instant
Trades can run automatically
Risk is calculated in real time
This allows traders to maintain their career, studies, or business while trading part-time or passively.
12. AI Levels the Playing Field
Earlier, only big institutions had access to advanced tools. Now AI technology is widely available through:
Trading platforms
Mobile apps
Cloud-based systems
Retail AI bots
Online broker tools
This gives small traders the same processing power previously available only to hedge funds.
Conclusion: Trading With AI Is Easier, Smarter, and More Accessible
AI does not eliminate all risks, and it does not guarantee profits. But it dramatically simplifies the entire process of trading by providing:
Deep market insights
Advanced predictions
Automated decision-making
Personalized strategies
Emotion-free execution
24/7 monitoring
Optimized performance
Trading will always involve uncertainty, but with AI, traders can navigate markets with far more confidence, clarity, and efficiency. AI has changed trading forever—making it easier, smarter, and more accessible for everyone.
HCLTECH

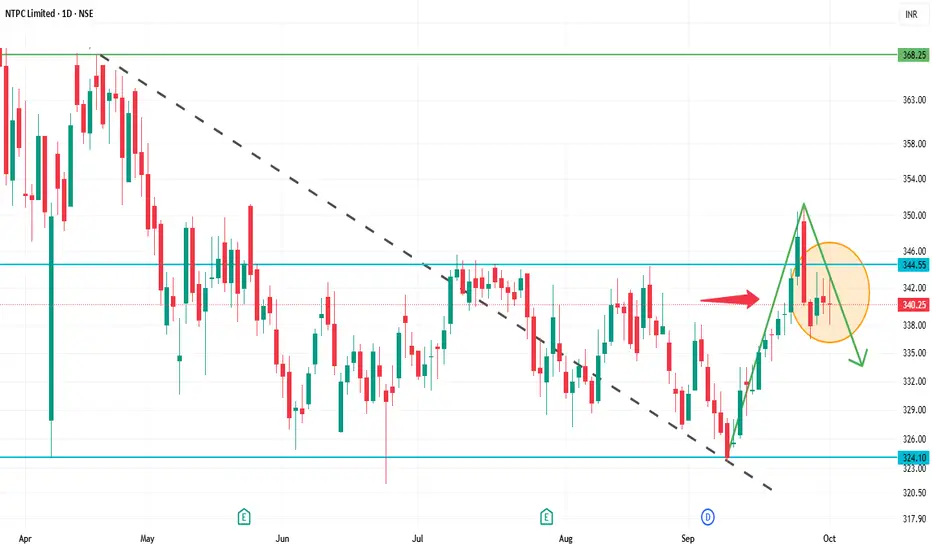
NTPC 1D Time frameCurrent Snapshot
Current Price: ₹340.25
52-Week High: ₹447.75
52-Week Low: ₹292.80
Strategy & Outlook
Bearish Bias: The stock is in a short-term downtrend with negative momentum indicators.
Selling Opportunity: Consider selling near resistance zones (₹343–₹345) with a target towards ₹335–₹340.
Risk Management: Place stop-loss orders above the resistance levels to manage potential upside risks.
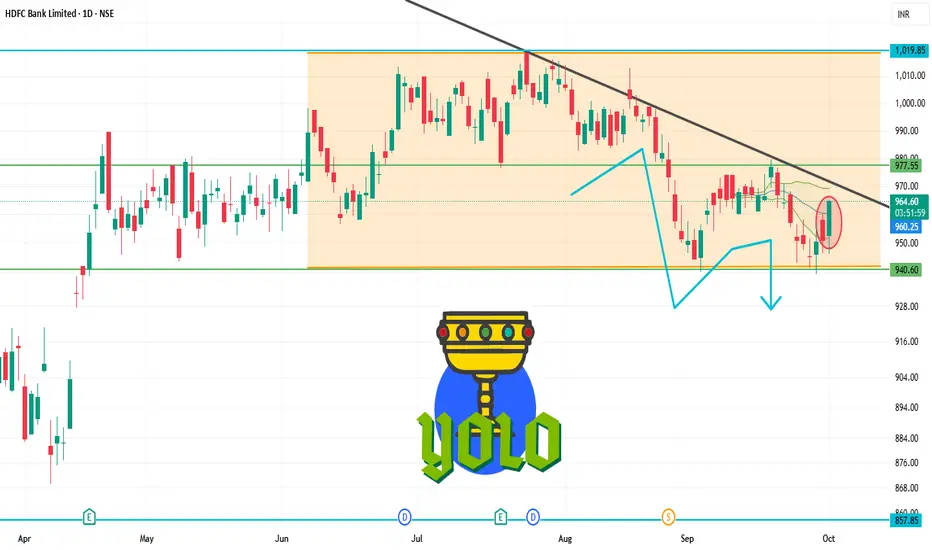
HDFCBANK 1D Time frameOpening Price: ₹950.30
Closing Price: ₹960.45
Day Range: ₹946.00 – ₹961.40
Previous Close: ₹950.30
🧠 Price Action Insights
The stock is trading below key moving averages, confirming the bearish trend.
No significant reversal pattern has formed, suggesting the downtrend may continue.
Watch for a breakout above ₹970.00 for a potential trend reversal.
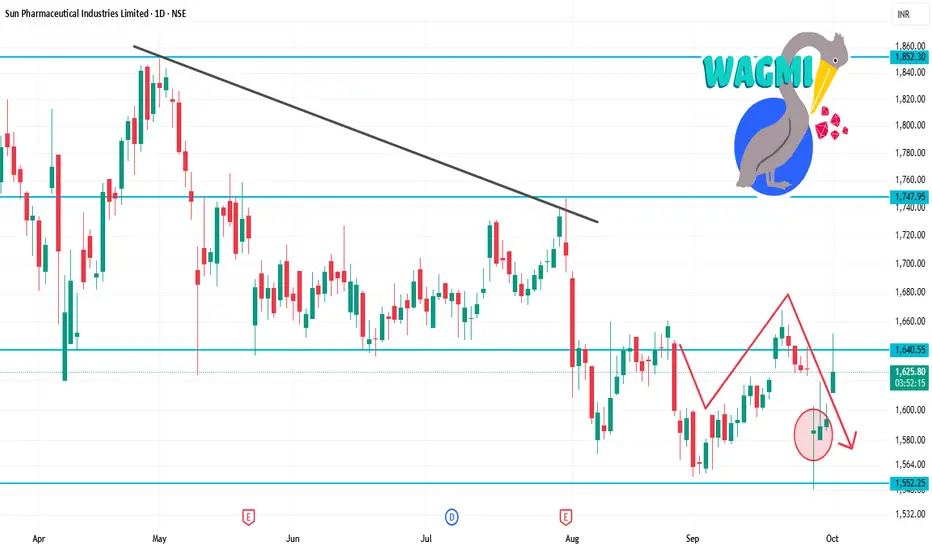
SUNPHARMA 1D Time frameOpening Price: ₹1,611.90
Closing Price: ₹1,628.20
Day Range: ₹1,611.90 – ₹1,651.50
Previous Close: ₹1,594.30
📉 Trend Analysis
Short-Term Trend: Bearish — The stock is trading below key moving averages, confirming the bearish trend.
Medium-Term Trend: Neutral — The stock is in a consolidation phase, characterized by lower highs and lower lows.
Long-Term Trend: Neutral — No significant trend identified; the stock is trading within a range.
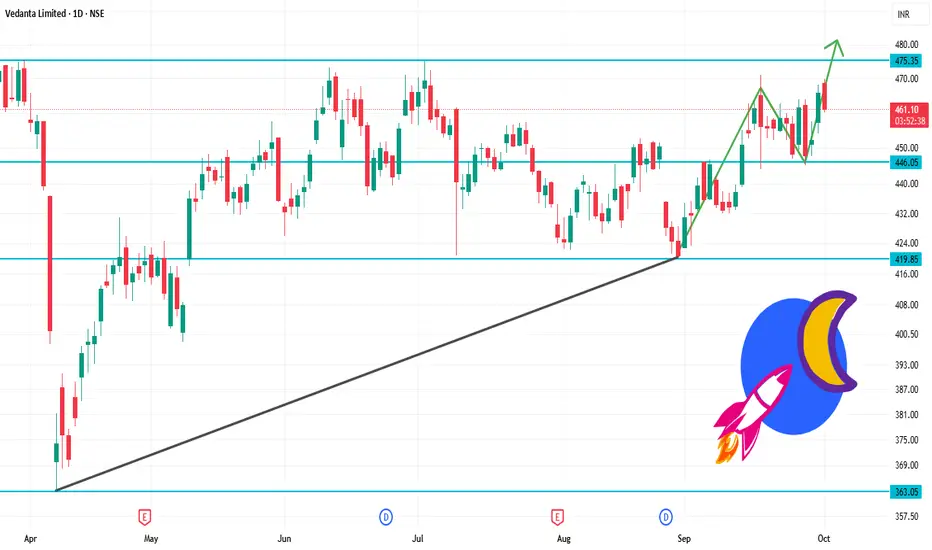
VEDL 1D Time frameOpening Price: ₹468.55
Closing Price: ₹461.40
Day Range: ₹463.00 – ₹469.85
Volume: 2,730,213 shares traded
📉 Trend Analysis
Short-Term Trend: Bearish – The stock is trading below key moving averages, confirming the bearish trend.
Medium-Term Trend: Neutral – The stock is in a consolidation phase, characterized by lower highs and lower lows.
Long-Term Trend: Neutral – No significant trend identified; the stock is trading within a range.
🔮 Conclusion
Vedanta Ltd. is in a bearish trend with weak momentum.
Break below ₹460.00 could lead to further decline toward ₹455.00.
Break above ₹475.00 would indicate a potential trend reversal.
HEROMOTOCO 1D Time frame📌 Current Status
Closing Price: ₹5,410
Day Change: –35 points (–0.64%)
Day’s High: ₹5,470
Day’s Low: ₹5,380
52-Week Range: ₹4,800 – ₹6,050
🔍 Chart & Price Action Insights
Price is moving sideways, bouncing between support and resistance.
Bulls are defending ₹5,380
Sellers resist above ₹5,470
Watch for a break above ₹5,470 for potential upward momentum
Break below ₹5,380 may trigger a short-term decline toward ₹5,330

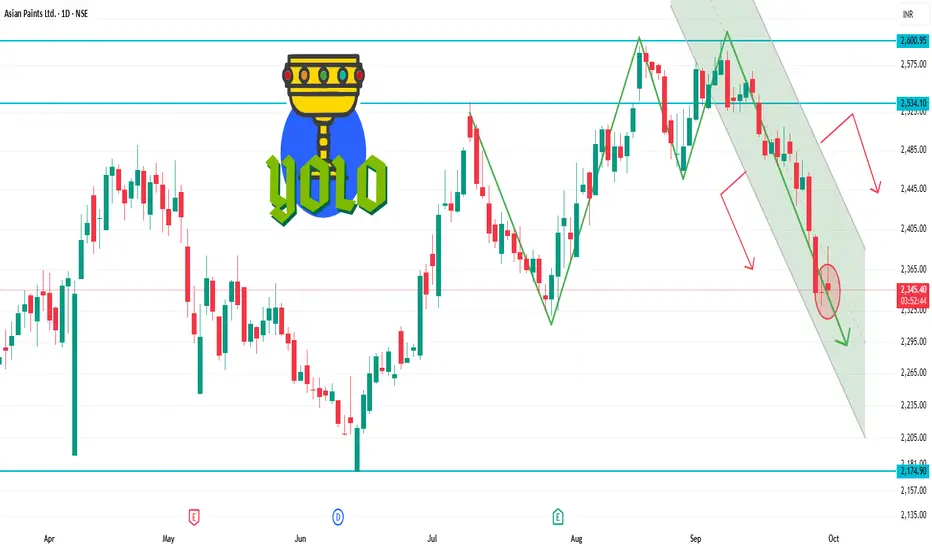
ASIANPAINT 1D Time frameCurrent Price Snapshot
Current Price: ₹2,345.50
Day’s Range: ₹2,342.00 – ₹2,388.80
52-Week Range: ₹2,124.75 – ₹3,358.00
Technical Indicators
RSI (14-day): 44.19 — indicates a neutral to slightly bearish momentum.
MACD: -4.010 — suggests bearish momentum.
Moving Averages:
5-day: ₹2,396.00 — indicates a Sell signal.
50-day: ₹2,389.00 — indicates a Sell signal.
200-day: ₹2,350.00 — indicates a Neutral signal.
Technical Summary: Predominantly Sell signals across various indicators.
Summary
Above ₹2,388.80: Potential rise toward ₹2,400 – ₹2,420.
Below ₹2,342.00: Potential fall toward ₹2,320 – ₹2,300.
Between ₹2,300 – ₹2,380: Likely range-bound movement.
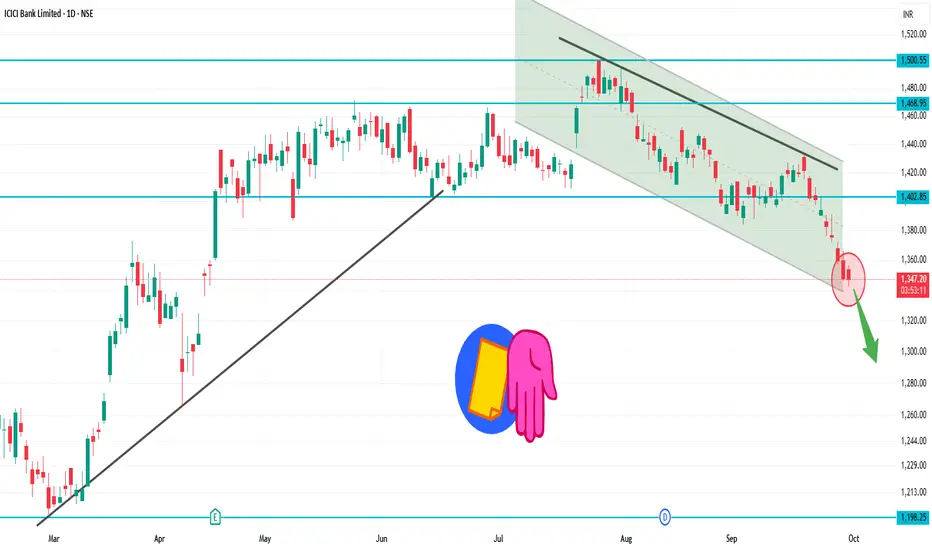
ICICIBANK 1D Time frame₹1,345.80 (NSE)
Day’s Range: ₹1,342.60 – ₹1,356.60
52-Week Range: ₹1,186.00 – ₹1,500.00
📉 Technical Overview
Trend: The stock is trading below its 200-day moving average, indicating a mildly bearish trend.
RSI: Currently at 26.6, suggesting the stock is in the oversold zone.
MACD: At -10.01, reinforcing the bearish momentum.
Moving Averages: A strong sell signal is indicated, with 0 buy signals and 12 sell signals across various timeframes.
🔼 Potential Upside (Rise)
Immediate Resistance: ₹1,355 – ₹1,365
Breakout Target: Above ₹1,365, the next resistance is around ₹1,380 – ₹1,390.
Bullish Confirmation: A close above ₹1,390 could signal a reversal or consolidation.
🔽 Potential Downside (Fall)
Immediate Support: ₹1,340 – ₹1,330
Breakdown Target: Below ₹1,330, the stock may test ₹1,310 – ₹1,300.
Bearish Confirmation: A close below ₹1,300 would strengthen the bearish outlook.
✅ Summary
Above ₹1,365: Potential rise toward ₹1,380 – ₹1,390.
Below ₹1,330: Potential fall toward ₹1,310 – ₹1,300.
Between ₹1,330 – ₹1,365: Likely range-bound movement.
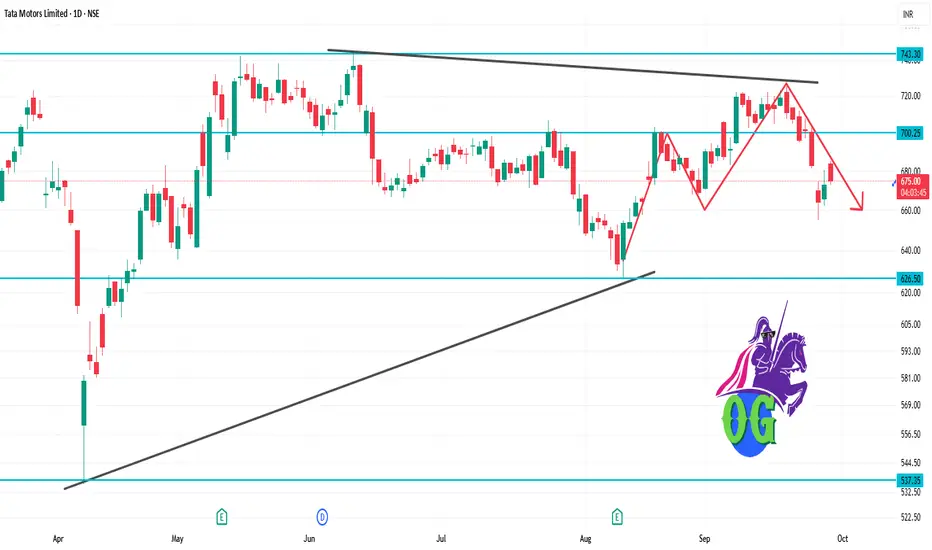
TATAMOTORS 1D Time frameCurrent Market Snapshot
Current Price: ₹675.60
Opening Price: ₹684.00
Day’s Range: ₹673.00 – ₹685.00
Previous Close: ₹672.90
🔑 Technical Indicators
Relative Strength Index (RSI): 48.5 – indicating a neutral condition.
Moving Average Convergence Divergence (MACD): -3.20 – suggesting bearish momentum.
Moving Averages: Trading below the 50-day and 200-day moving averages, indicating a bearish trend.
📈 Key Support & Resistance Levels
Immediate Support: ₹673
Immediate Resistance: ₹685
Pivot Point: ₹679
📉 Market Sentiment
Trend: The stock is trading below its 50-day and 200-day moving averages, indicating a bearish trend.
Volume: Trading volume is higher than average, suggesting increased investor activity.
📈 Strategy (1D Timeframe)
1. Bullish Scenario
Entry: Above ₹685
Stop-Loss: ₹673
Target: ₹690 → ₹695
2. Bearish Scenario
Entry: Below ₹673
Stop-Loss: ₹685
Target: ₹665 → ₹660
⚠️ Risk Management
Limit risk to 1% of capital per trade.
Always use stop-loss to protect against unexpected market movements.
Monitor broader market trends and sector-specific news that may impact stock performance.
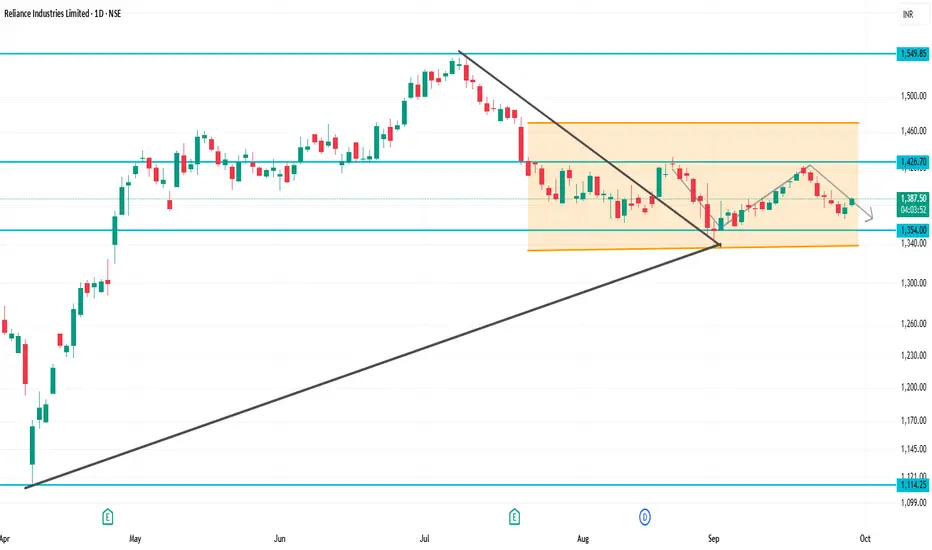
RELIANCE 1D Time frameCurrent Market Snapshot
Current Price: ₹1,383.30
Opening Price: ₹1,381.60
Day’s Range: ₹1,379.00 – ₹1,386.90
Previous Close: ₹1,377.60
🔑 Technical Indicators
Relative Strength Index (RSI): 49.76 – indicating a neutral condition.
Moving Average Convergence Divergence (MACD): -3.20 – suggesting bearish momentum.
Moving Averages: Mixed signals; trading slightly below the 50-day and 200-day moving averages, indicating a neutral to bearish trend.
📈 Key Support & Resistance Levels
Immediate Support: ₹1,379
Immediate Resistance: ₹1,387
Pivot Point: ₹1,383
📉 Market Sentiment
Recent Performance: Reliance Industries experienced a decline of 0.82% on September 25, 2025, underperforming the broader market.
Volume: Trading volume is higher than average, suggesting increased investor activity.
📈 Strategy (1D Timeframe)
1. Bullish Scenario
Entry: Above ₹1,387
Stop-Loss: ₹1,379
Target: ₹1,395 → ₹1,400
2. Bearish Scenario
Entry: Below ₹1,379
Stop-Loss: ₹1,387
Target: ₹1,370 → ₹1,365
⚠️ Risk Management
Limit risk to 1% of capital per trade.
Always use stop-loss to protect against unexpected market movements.
Monitor broader market trends and sector-specific news that may impact stock performance.
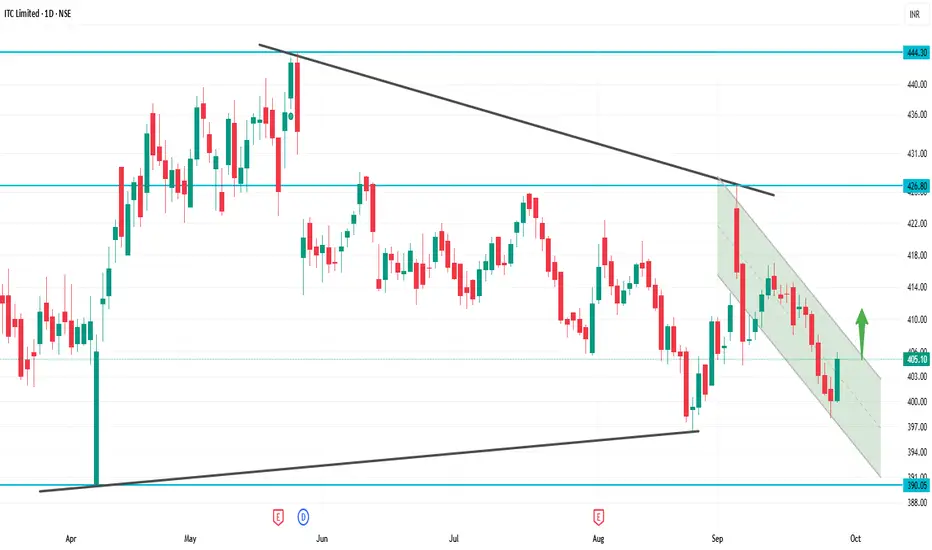
ITC 1D Time frame📊 Updated Snapshot
Current Price: ~₹405
Day Range: ₹402 – ₹410
52-Week High: ₹499
52-Week Low: ₹399
📈 Technical Outlook
Support Zones:
Strong support at ₹405 (current zone)
Next support at ₹398
Resistance Zones:
Immediate resistance at ₹410–₹416
Next resistance at ₹421
Trend Bias: Weak bearish → stock is near 52-week low, testing crucial support.
📌 Step-by-Step View
If it holds above ₹405–₹398: Buyers may step in, possible bounce toward ₹416–₹421.
If it breaks below ₹398: More downside risk opens, weakness can extend further.
Upside revival only above ₹421 closing: That will change trend toward bullish.
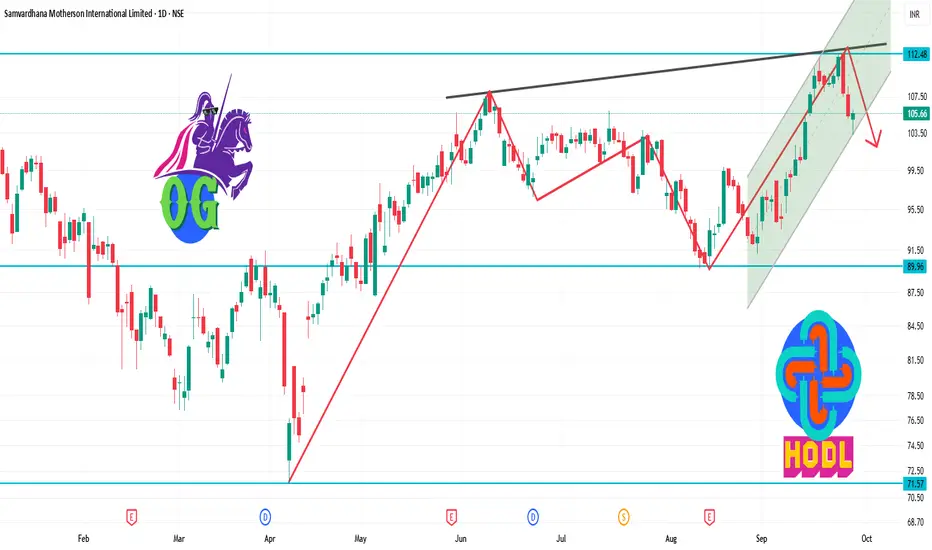
MOTHERSON 1D Time frameStock Snapshot
Closing Price: ₹105.66
Day's Range: ₹103.26 – ₹106.01
52-Week Range: ₹71.50 – ₹144.66
Market Cap: ₹1,11,518 crore
P/E Ratio (TTM): 33.54
P/B Ratio: 3.20
Dividend Yield: 0.80%
Book Value: ₹33.05
Beta: 1.64
Volume: 24,534,407 shares traded
VWAP: ₹104.93
Face Value: ₹1.00
📈 Performance Overview
1-Week Return: -3.14%
1-Month Return: +13.27%
YTD Return: +22.73%
1-Year Return: -11.16%
3-Year Return: +28.45%
5-Year Return: 0.00%
🧾 Financial Highlights
TTM EPS: ₹3.15
Net Sales (Latest Four Quarters): ₹9,271.58 crore
Net Profit (Latest Four Quarters): ₹605.86 crore
Shareholder's Funds: ₹1,676.80 crore
Total Assets: ₹3,089.00 crore
🔍 Technical Insights
Trend: Currently in a downtrend; price below VWAP indicates bearish momentum.
Support Levels: ₹103.26, ₹100.00
Resistance Levels: ₹106.01, ₹110.00
📌 Key Takeaways
Dividend: 50% (₹0.50 per share)
Bonus Issue: 1:2 ratio
Market Position: Strong over 3 years despite short-term volatility
Analyst Sentiment: Positive overall, short-term corrections possible
LT 1D Time framePrevious Close: ₹ 3,644
Today Open: ₹ 3,664
Day’s High: ₹ 3,795
Day’s Low: ₹ 3,661
Current / Last Traded Price: around ₹ 3,730
⚡ Strategy
Bullish Side:
Buy on dips near ₹ 3,700 – 3,720 with stop loss below ₹ 3,660. Target ₹ 3,760 → ₹ 3,795.
Bearish Side (Only if Weakness):
If price falls below ₹ 3,660, short opportunities may open toward ₹ 3,600.
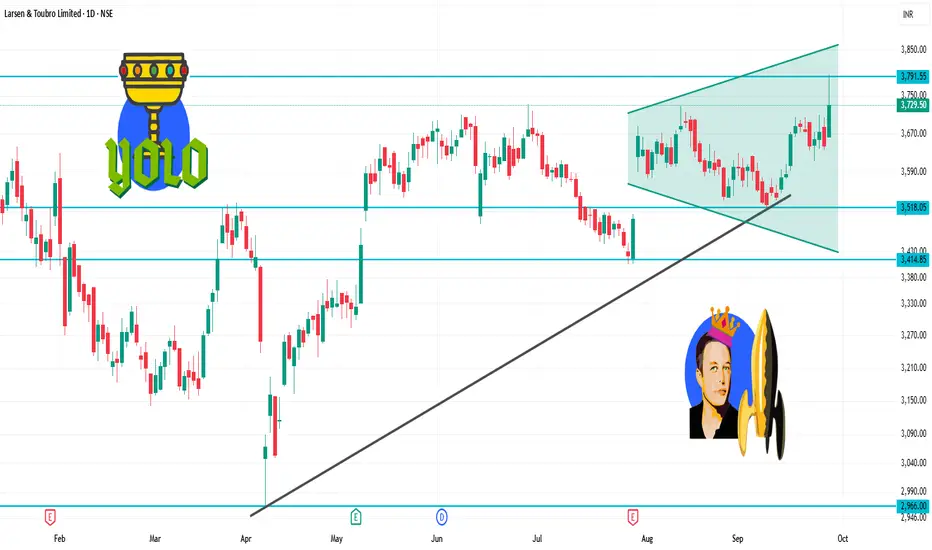
LT 1D Time frameClosing Price: ₹3,644.40
Day’s Range: ₹3,635.70 – ₹3,704.00
Previous Close: ₹3,657.60
Change: Down –0.80%
52-Week Range: ₹2,965.30 – ₹3,963.50
Market Cap: ₹5.13 lakh crore
P/E Ratio (TTM): 32.31
Dividend Yield: 0.93%
EPS (TTM): ₹112.81
Beta: 1.20 (indicating moderate volatility)
🔑 Key Technical Levels
Immediate Support: ₹3,635 – ₹3,640
Immediate Resistance: ₹3,700 – ₹3,710
52-Week High: ₹3,963.50
52-Week Low: ₹2,965.30
📈 Technical Indicators
RSI (14-day): 45.2 – indicating a neutral condition.
MACD: Negative, suggesting bearish momentum.
Moving Averages: Trading below the 50-day and 200-day moving averages, indicating a bearish trend.
📉 Market Sentiment
Recent Performance: L&T experienced a decline of 0.80% on September 25, 2025, underperforming the broader market.
Volume: Trading volume was significantly higher than its 20-day average, indicating increased investor activity.
📈 Strategy (1D Timeframe)
1. Bullish Scenario
Entry: Above ₹3,700
Stop-Loss: ₹3,635
Target: ₹3,750 → ₹3,800
2. Bearish Scenario
Entry: Below ₹3,635
Stop-Loss: ₹3,700
Target: ₹3,600 → ₹3,550

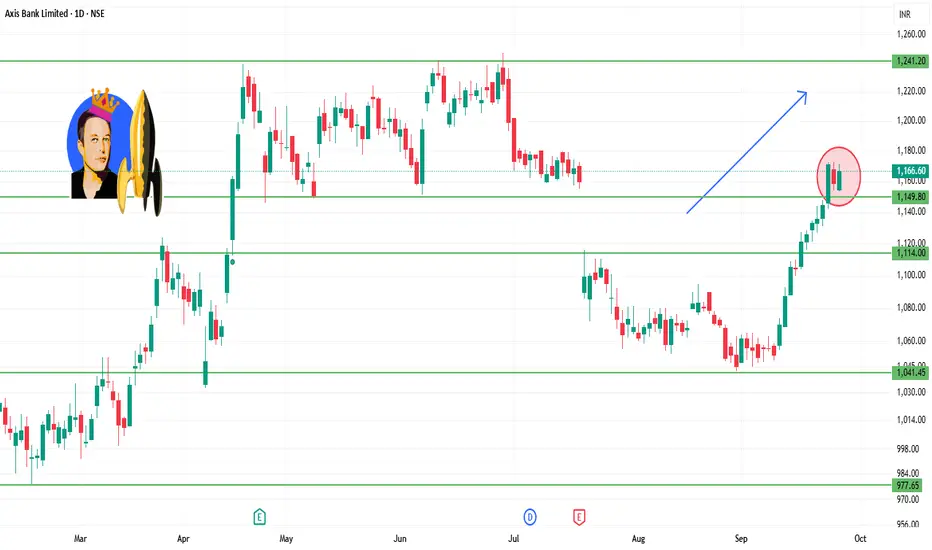
AXISBANK 1D Time frame📊 Daily Snapshot
Closing Price: ₹1,166.10
Day’s Range: ₹1,153.40 – ₹1,171.80
Previous Close: ₹1,158.80
Change: Up +0.28%
52-Week Range: ₹933.50 – ₹1,281.65
Market Cap: ₹3.59 lakh crore
P/E Ratio: 12.9
Dividend Yield: 1.2%
EPS (TTM): ₹90.00
Beta: 1.1 (moderate volatility)
🔑 Key Technical Levels
Immediate Support: ₹1,153.33
Immediate Resistance: ₹1,153.33
Weekly Outlook: Immediate support at ₹1,109.23; major support at ₹1,082.57; immediate resistance at ₹1,153.33; major resistance at ₹1,170.77.
📈 Analyst Insights
Intrinsic Value: Estimated at ₹1,511.77 based on median valuation models, suggesting the stock is trading below its fair value.
📈 Strategy (1D Timeframe)
1. Bullish Scenario
Entry: Above ₹1,153.33
Stop-Loss: ₹1,109.23
Target: ₹1,170.77 → ₹1,200.00
2. Bearish Scenario
Entry: Below ₹1,109.23
Stop-Loss: ₹1,153.33
Target: ₹1,082.57 → ₹1,050.00
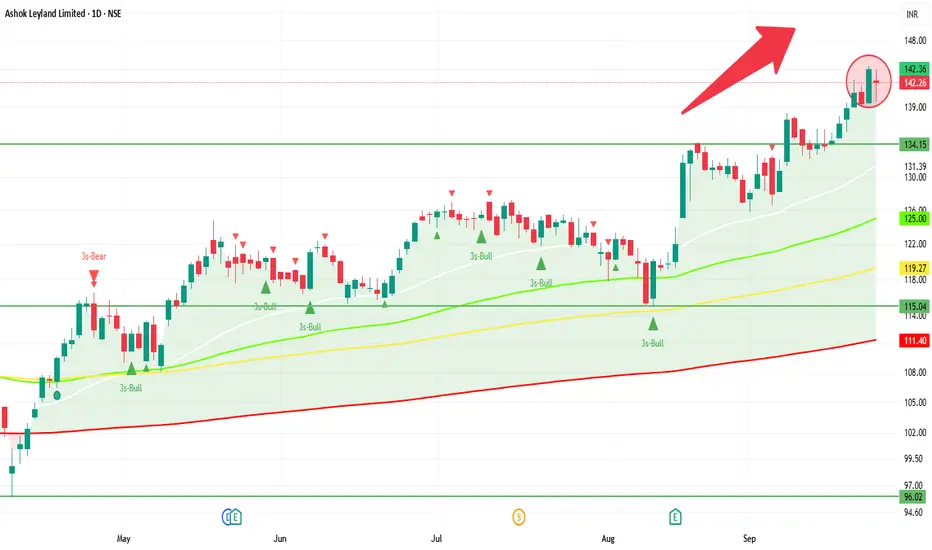
ASHOKLEY 1D Time frame📊 Today's Performance
Closing Price: ₹142.26
Day’s Range: ₹139.60 – ₹143.99
Previous Close: ₹144.04
Change: Down ~ –1.24%
52-Week Range: ₹95.93 – ₹144.50
Volume: ~36.96 million shares
Market Cap: ₹83,556 crore
P/E Ratio: 26.05
Dividend Yield: 4.39%
EPS (TTM): ₹5.46
🔍 Key Technical Levels
Support Zone: ₹139.60 – ₹140.00
Resistance Zone: ₹143.50 – ₹144.50
All-Time High: ₹144.50
📈 Strategy (1D Timeframe)
1. Bullish Scenario
Entry: Above ₹143.50
Stop-Loss: ₹141.50
Target: ₹146.00 – ₹148.00
2. Bearish Scenario
Entry: Below ₹139.60
Stop-Loss: ₹141.50
Target: ₹136.00 – ₹134.00
SBIN 1D Time frame📍 Today’s Expected Range (Intraday Approximation)
Expected High: ₹861–₹865
Expected Low: ₹855–₹850
These are approximate intraday levels. Actual prices may fluctuate slightly due to volatility.
🔍 Key Points
Current price: ₹860–₹861, close to resistance.
If price breaks above ₹861–₹865 with strong volume → bullish momentum likely.
If price drops below ₹855–₹850 → short-term correction or pullback possible.
📊 Suggested Trading Strategy
Bullish Scenario
If SBIN breaks ₹861–₹865, you can buy, targeting ₹870–₹875.
Stop-loss: ₹855
Bearish Scenario
If SBIN drops below ₹855, you can sell/short, targeting ₹850–₹845.
Stop-loss: ₹860
Range-Bound / Sideways
If SBIN trades between ₹855–₹861, it’s better to wait and avoid trading until a clear breakout occurs.
💡 Summary
Resistance Zone: ₹861–₹865
Support Zone: ₹855–₹850
Strategy: Trade in the direction of the breakout, and always use stop-loss to manage risk.

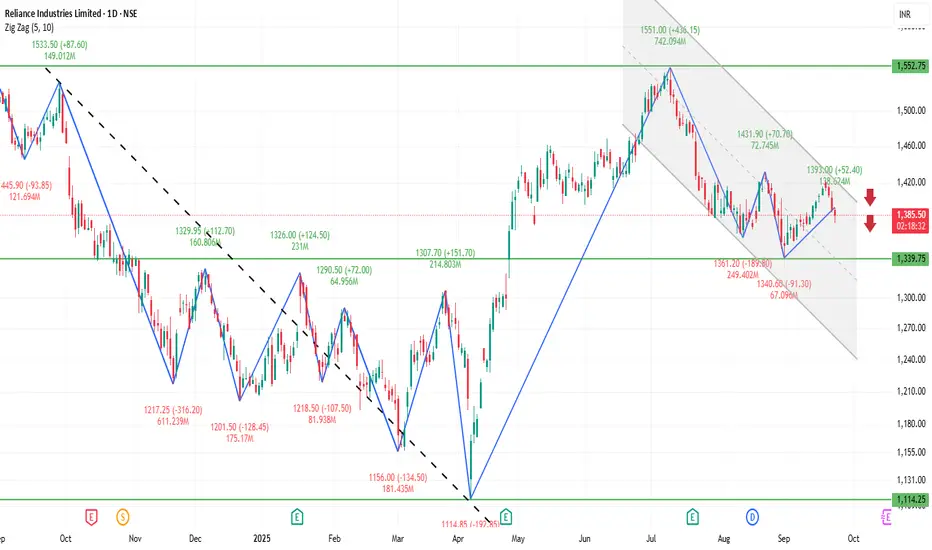
RELIANCE 1D Time frame📍 Current Price Context
Trading around ₹1,386
Price is near a resistance zone → important level to watch.
🔍 Key Levels
Immediate resistance: ₹1,380–₹1,390 (current zone)
Next resistance: ₹1,420–₹1,450 (if breakout happens)
Immediate support: ₹1,350–₹1,360
Stronger support: ₹1,320–₹1,330
📊 Indicators & Trend
Price is just below resistance, so breakout or rejection will decide the move.
RSI near neutral → neither overbought nor oversold.
Structure looks range-bound, but slightly bullish as long as it holds above ₹1,350.
🔮 Possible Scenarios
Bullish breakout → If Reliance sustains above ₹1,390–₹1,400 with volume, next upside target is ₹1,420–₹1,450.
Sideways move → May trade between ₹1,350–₹1,390 until momentum builds.
Bearish pullback → If it fails at resistance, price could slip toward ₹1,350, and if broken, then ₹1,320.
👉 At the current level (₹1,386), Reliance is at a decisive zone. Breakout above ₹1,390 will be bullish, while rejection could send it back to supports.
KOTAKBANK 1D Time frame🔍 Current Price & Context
Current Price: ₹2,034.10
Day’s Range: ₹2,027.40 – ₹2,054.60
52-Week Range: ₹1,679.05 – ₹2,301.90
Previous Close: ₹2,031.00
Market Cap: ₹4,04,634 Cr
P/E Ratio: 21.10
Dividend Yield: 0.12%
Beta: 0.97
📊 Technical Indicators
Relative Strength Index (RSI): Approximately 49.64, indicating a neutral stance.
MACD: Positive, suggesting bullish momentum.
Moving Averages:
5-Day: ₹2,032.84
50-Day: ₹2,012.95
200-Day: ₹1,984.69
Pivot Points:
S1: ₹2,029.97
Pivot: ₹2,036.07
R1: ₹2,042.17
🧮 Strategy / Trade Ideas
Long Setup:
Entry: Consider entering near support levels (~₹2,020) if bullish reversal signals appear.
Stop Loss: Place below ₹1,980 to manage risk.
Target: First resistance around ₹2,042, then ₹2,070.
Short Setup:
Entry: If price fails to break above resistance (~₹2,042) and shows signs of reversal.
Stop Loss: Above ₹2,080.
Target: Downside toward ₹2,020, then ₹1,990.

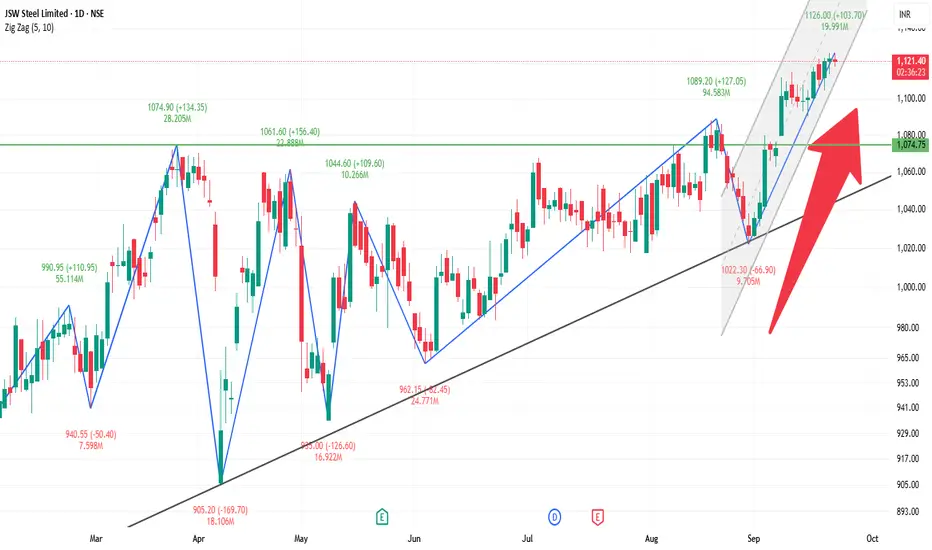
JSWSTEEL 1D Time frame🔍 Current Price
Trading around ₹1,119 – ₹1,120
⚙️ Key Levels (Daily)
Immediate Resistance 1: ₹1,125 – ₹1,130
Next Resistance 2: ₹1,133
Immediate Support 1: ₹1,116 – ₹1,117
Support 2: ₹1,110 – ₹1,113
Deeper Support (Positional): ₹1,072
🧮 Base Strategy Application
Long Setup:
Entry: Near current levels (~₹1,120) if it holds above ₹1,116
Stop Loss: Below ₹1,110
Targets: ₹1,125 – ₹1,130 (short-term), then ₹1,133
Short Setup (Reversal):
If rejection happens near ₹1,125 – ₹1,130 zone
Target: ₹1,116 first, then ₹1,110
Breakout Setup:
If price breaks and sustains above ₹1,133 with volume
Potential for further upside beyond recent highs
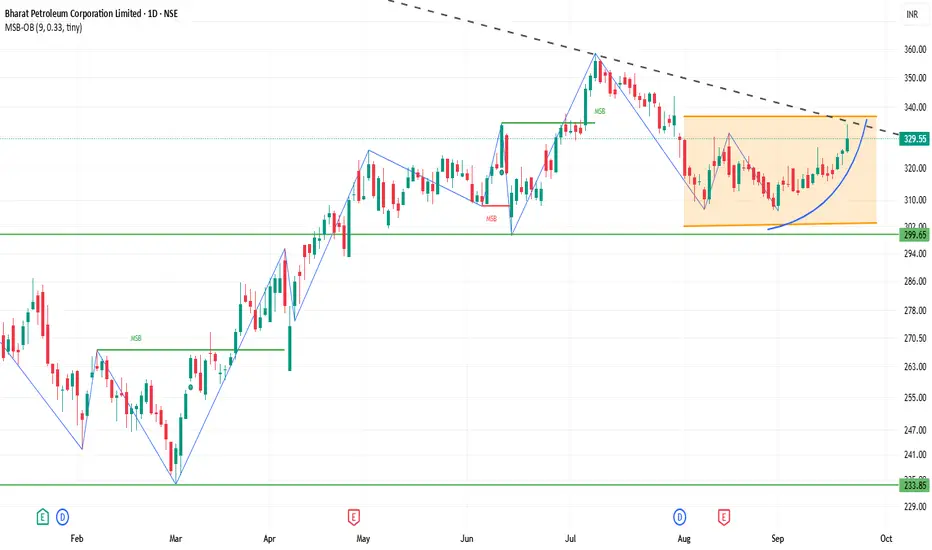
BPCL 1D Time frame📊 Current Snapshot
Closing Price: ₹329.55
Day's Range: ₹324.80 – ₹334.00
52-Week Range: ₹234.01 – ₹376.00
Market Capitalization: ₹1,42,975 Crores
Volume: Approximately 10 million shares traded
P/E Ratio: 8.14
Dividend Yield: 2.99%
⚙️ Technical Indicators
Relative Strength Index (RSI): 60.31 – Neutral to slightly bullish
Moving Average Convergence Divergence (MACD): 0.29 – Neutral
Moving Averages: Short-term averages (5, 10, 20, 50, 100, 200-day) are above the current price, indicating potential resistance.
Pivot Points: Central pivot around ₹322.30, suggesting a balanced market sentiment.
🎯 Possible Scenarios
Bullish Scenario: A breakout above ₹328.25 with strong volume could target ₹331.80 and higher levels.
Bearish Scenario: Failure to hold above ₹325.85 may lead to a decline toward ₹322.30.
⚠️ Key Considerations
Market Sentiment: BPCL has shown strong performance recently, but broader market conditions can impact its movement.
Volume Analysis: Watch for volume spikes to confirm breakout or breakdown signals.
Technical Indicators: While the RSI indicates a neutral to slightly bullish stance, the MACD and moving averages suggest caution.
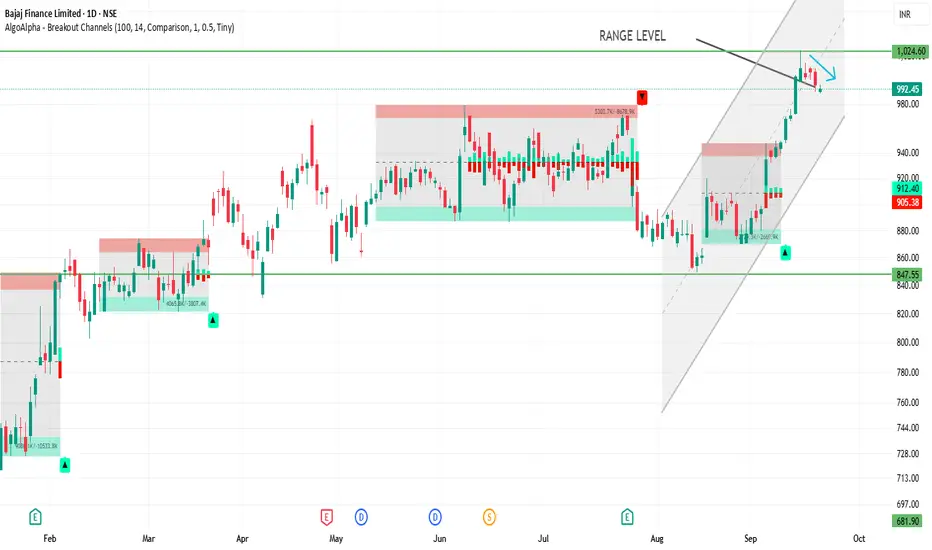
BAJFINANCE 1D Time frame📊 Current Snapshot
Current Price: Around ₹993
52‑Week High: ~ ₹1,025
52‑Week Low: ~ ₹640
Recent Trend: Positive short-term momentum with weekly gain ~2% and monthly gain ~10%
🔍 Support & Resistance
Immediate Support: ₹960 – ₹954
Next Support: ₹946
Immediate Resistance: ₹975 – ₹983
Higher Resistance: ₹989 – ₹990
⚙️ Technical Indicators
RSI (14): ~45–46, neutral stance
MACD: Slightly negative, indicating weak bearish momentum
Moving Averages: Mixed; short-term MAs below price (support), long-term MAs above price (resistance)
🎯 Possible Scenarios
Bullish: Break above ₹983 with volume could push toward ₹990+
Bearish: Fall below ₹960 may lead toward ₹946
⚠️ Key Points
Price is near support/resistance zones; breakout requires strong volume
Trend is positive in the short term, but caution needed near resistance levels
Combine with market sentiment and risk management before trading
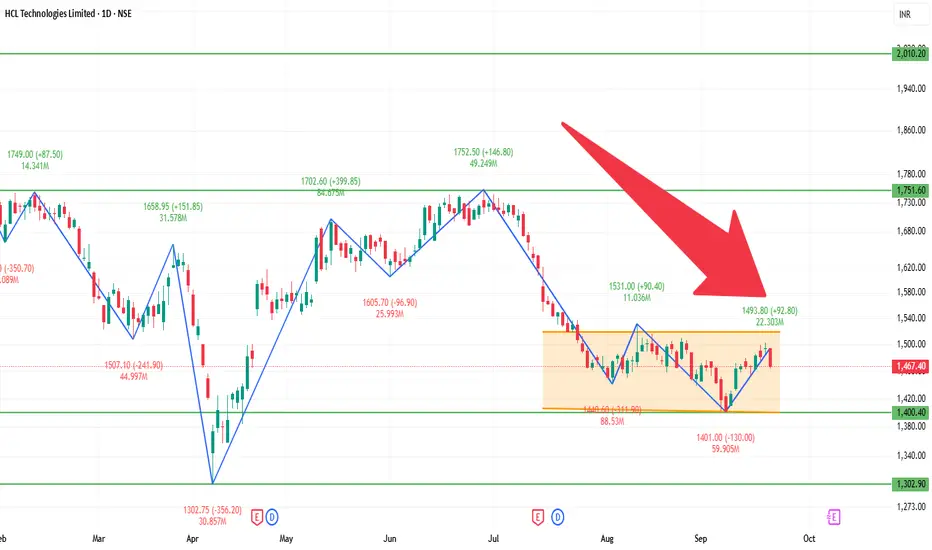
HCLTECH 1D Time frame📊 Current Overview
Price is trading near ₹1,460 – ₹1,470 range.
Trend on the daily chart is showing weakness.
Stock is trading below most key moving averages (50-day, 100-day, 200-day).
🔍 Support & Resistance
Immediate Support: ₹1,450
Next Support: ₹1,430 – ₹1,420
Immediate Resistance: ₹1,470 – ₹1,475
Higher Resistance: ₹1,490 – ₹1,500
📈 Indicators
RSI (14): Neutral to slightly bearish, around mid-40s.
MACD: Weak, showing bearish crossover or flat momentum.
Trend: More sideways to bearish unless resistance levels break.
🎯 Possible Scenarios
Bullish: If HCLTECH breaks and sustains above ₹1,475, it could target ₹1,490 – ₹1,500.
Bearish: If it fails and slips below ₹1,450, it may fall towards ₹1,430 – ₹1,420.