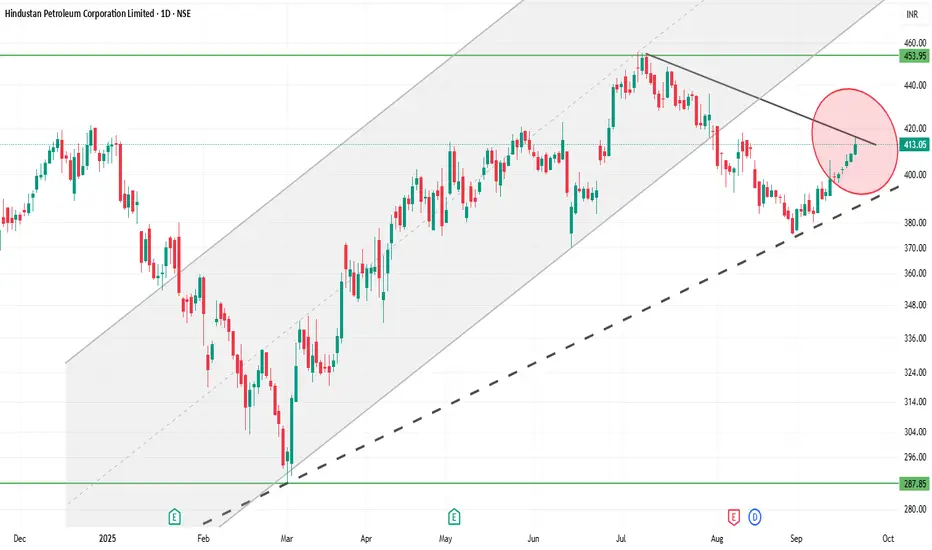
HINDPETRO 1D Time frameCurrent Price: 413
Current Trend: Strong bullish momentum; stock is trading near recent highs.
Support Zone: Immediate support at 405 – 410. If this holds, uptrend remains intact.
Resistance Zone: Next resistance at 420 – 425. A breakout above this can push toward 435+.
Indicators: Daily candles are bullish with strong buying interest; higher highs and higher lows visible.
Outlook:
Above 420 → continuation of bullish rally likely.
Below 405 → minor correction possible toward 395–400.
👉 In short (with 413 current price):
Bullish tone.
Range to watch: 405 – 425.
HCLTECH
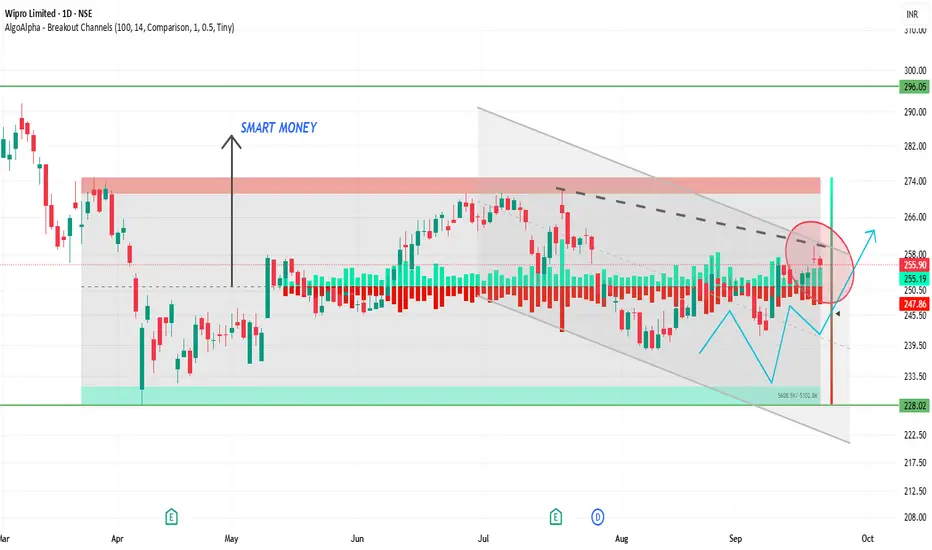
WIPRO 1D Time frameCurrent Price: WIPRO is trading near the 520 – 525 zone (recent levels).
Current Trend: Stock is moving sideways after a sharp move earlier, showing consolidation.
Support Zone: Strong support at 510 – 515. Buyers likely to defend this area.
Resistance Zone: Key resistance around 530 – 535. A breakout above 535 can lead to upward momentum.
Indicators: Daily candles indicate indecision; volumes are stable, showing accumulation at lower levels.
Outlook:
Above 535 → bullish momentum possible toward 550+.
Below 510 → weakness may extend toward 495.
👉 In short:
Range: 510 – 535.
Neutral to bullish tone if it breaks above resistance.
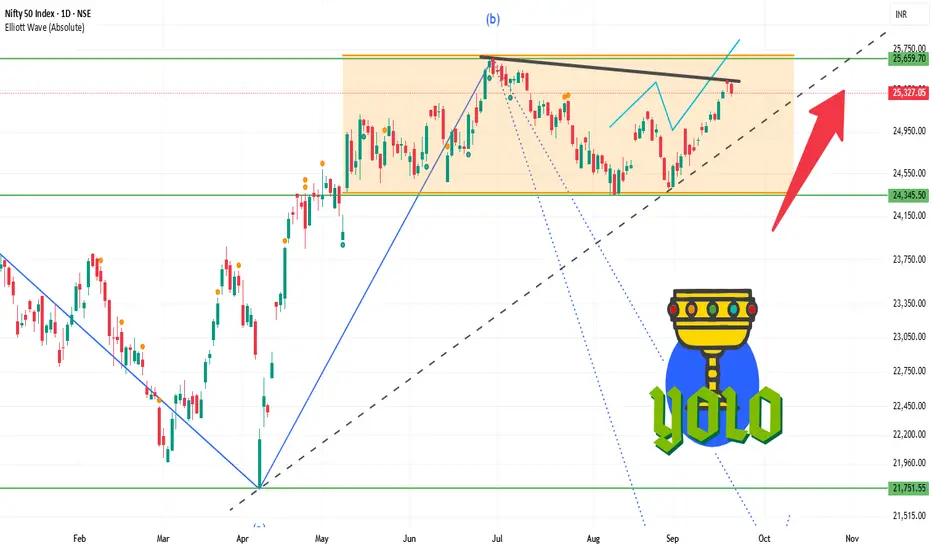
NIFTY 1D Time frameCurrent Trend: Market is moving sideways with limited momentum.
Support Zone: Strong support is around 25,200 – 25,250; bounce is possible from here.
Resistance Zone: If NIFTY sustains above 25,350 – 25,400, fresh upward momentum may come.
Indicators: Daily candle shows buyers are slightly in control, but resistance breakout is important.
Outlook: As long as NIFTY holds above 25,200, the uptrend remains safe. A close above 25,400 can trigger new buying.
👉 In short:
Sideways to bullish tone.
Weakness below 25,200, strength above 25,400.
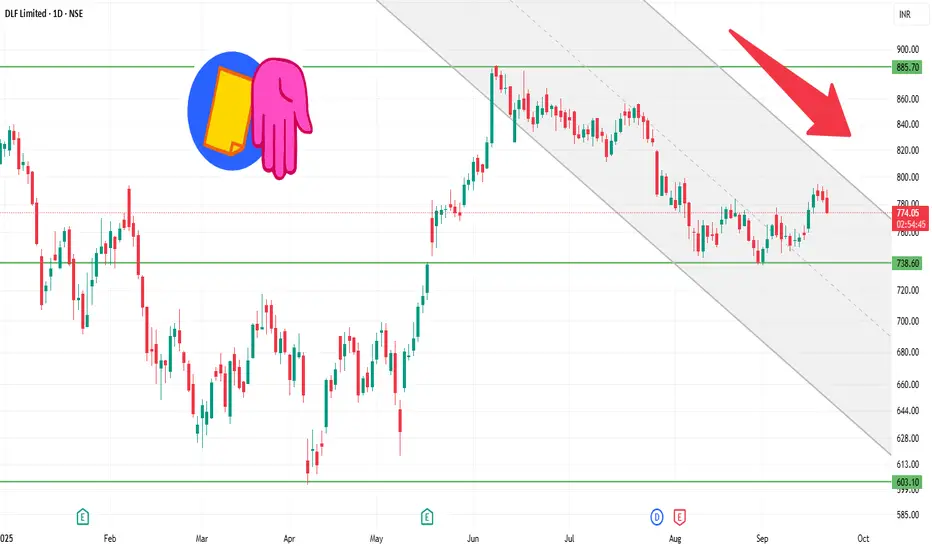
DLF 1D Time frameCurrent
Price: ₹783.10 (as of last close)
52-Week Range: ₹601.20 – ₹929.00
Market Cap: ₹1.94 lakh crore
P/E Ratio: 43.26 (lower than sector average)
EPS (TTM): ₹18.12
Dividend Yield: 0.77%
Debt-to-Equity: 0.10 (very low)
ROE: 10.76%
ROCE: 6.51%
⚙️ Technical Indicators
RSI (14-day): 56.38 — Neutral to slightly bullish.
MACD: 4.28 — Positive, supporting bullish momentum.
Moving Averages: Trading above both 50-day and 200-day EMAs, indicating a long-term uptrend.
Trend Rating: Strong Buy, according to daily technical analysis.
📈 Short-Term Outlook
Bullish Scenario:
Entry: Above ₹800 with strong volume.
Targets: ₹820–₹825, ₹840–₹850.
Stop Loss: ₹780.
Bearish Scenario:
Entry: Below ₹780 with confirmation.
Targets: ₹760–₹765, ₹740–₹745.
Stop Loss: ₹800.
⚠️ Risks
Breakdown below ₹780: Could lead to a short-term correction toward ₹760–₹765.
Failure to break above ₹800: May result in consolidation or minor pullback.
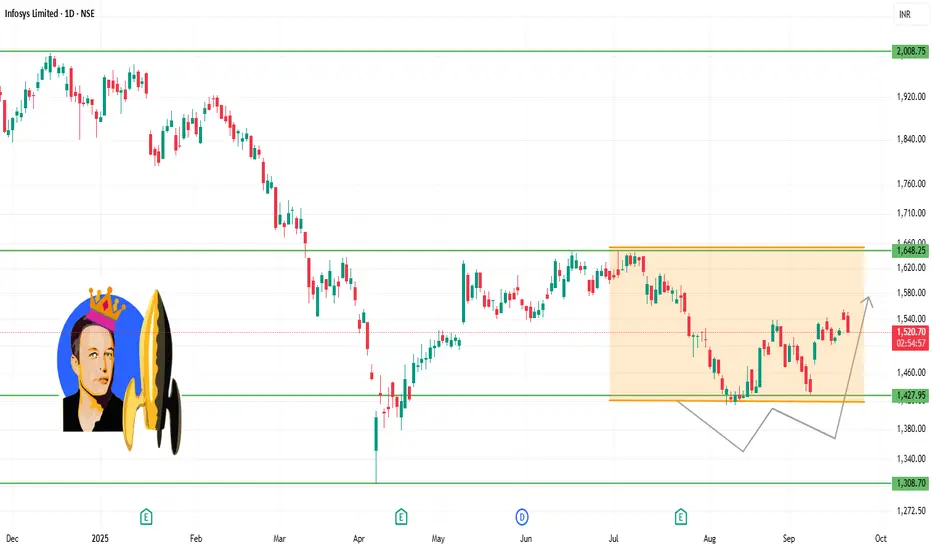
INFY 1D Time frameCurrent Facts
INFY is trading around ₹1,525-₹1,530.
Recent high / resistance being tested around ₹1,540-₹1,550.
The stock has a 52-week low around ₹1,307 and a high near ₹2,006.
Technical momentum is neutral to mildly bullish. Indicators like MACD are positive but RSI is not yet overbought.
🔍 Key Support & Resistance Levels
Immediate Support: ~ ₹1,500-₹1,510 — this is the level to watch closely. If INFY remains above this, it helps maintain bullish bias.
Secondary Support: ~ ₹1,470-₹1,490, in case the nearer support fails.
Immediate Resistance: ~ ₹1,540-₹1,550 — price is facing supply pressure here.
Stronger Resistance: ~ ₹1,560-₹1,570 if INFY manages to break above the nearer resistance.
⚙️ Interpretation & Outlook
As long as INFY stays above the ~₹1,500 support, bulls have a chance to push toward resistance.
Selling pressure is visible near the resistance zone; repeated failures at that zone could lead to consolidation or a pullback.
If INFY breaks above ₹1,550 with strong volume, the upside may extend toward ~₹1,560-₹1,570 and beyond.
⚠️ Risk Points
Breakdown below ₹1,500 may drag INFY toward the ~₹1,470-₹1,490 support.
If that too fails, deeper weakness may set in, possibly toward lower zones depending on market sentiment.
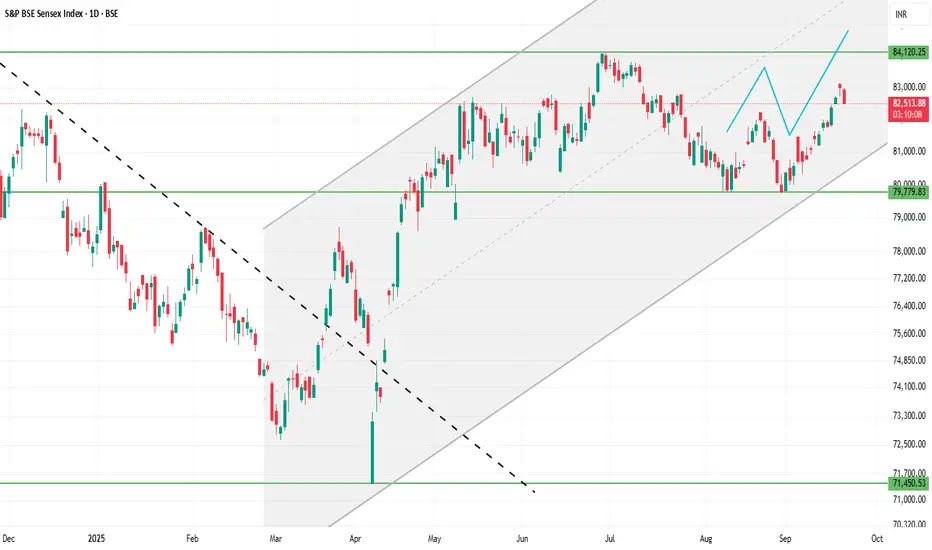
SENSEX 1D Time frameCurrent Facts
Current Level: 82,590.45 - 82,616.13
Trend: Mildly bullish; trading above short-term moving averages (20-day & 50-day EMA).
Momentum Indicators:
RSI (14-day): ~60 → bullish but not overbought.
MACD: Positive → supporting the uptrend.
Price Action: Daily candles show small upper wicks → minor profit-taking near resistance.
⚙️ Outlook
Bullish Scenario:
Holding above 82,450 → retest 82,650–82,700 and possibly 82,850–82,900.
Range / Consolidation:
Price oscillates between 82,400 – 82,650 → sideways trading likely.
Bearish Scenario:
Close below 82,400 → downside risk toward 82,250–82,300 or lower.
⚠️ Key Facts
82,500–82,600 acts as a short-term pivot: above it favors bulls, below it favors bears.
Resistance at 82,650–82,700 is key; breakout here may trigger further upside.
Support at 82,400–82,450 is critical; failing to hold may lead to short-term correction.
INFY 1D Time frameCurrent Snapshot
Price is trading near ₹1,545.
Stock is holding above the 50-day moving average, showing underlying strength.
Near medium-term averages (100-day and 200-day), so trend is stable with mild bullish bias.
⚙️ Indicators / Momentum
RSI (14): Mid-to-high range, showing steady strength but not overbought yet.
MACD: Positive, suggesting upward momentum is intact.
Overall Momentum: Slightly bullish with chances of consolidation near resistance.
📌 Key Levels
Immediate Resistance: ₹1,550 – ₹1,560.
Immediate Support: ₹1,510 – ₹1,520.
Stronger Support: ₹1,450 – ₹1,480 zone if bigger pullback happens.
✅ Outlook
As long as the stock stays above ₹1,510, trend remains bullish.
Breakout above ₹1,560 could open further upside targets.
If price slips below ₹1,510, short-term weakness may pull it toward ₹1,450 – ₹1,480.

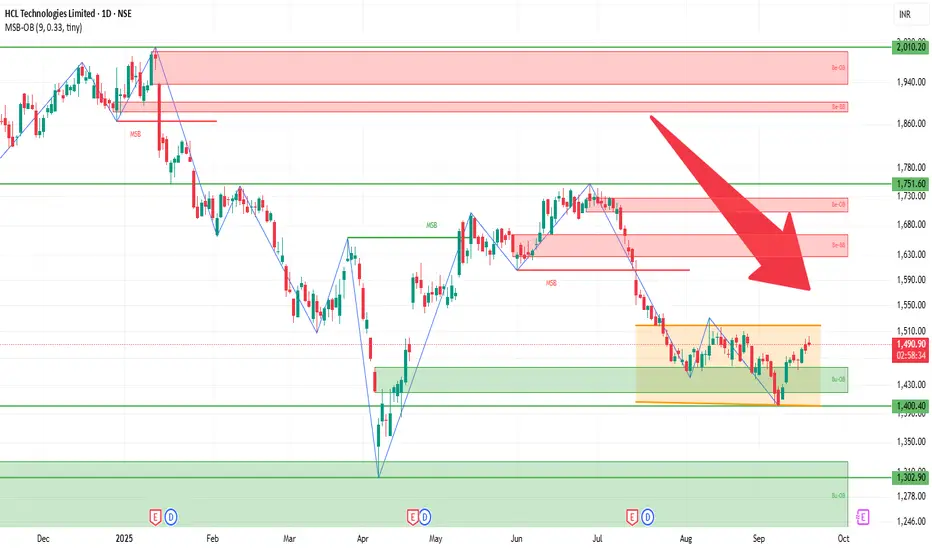
HCLTECH 1D Time frameCurrent Picture
Share price is ~ ₹1,499-₹1,505.
Recent momentum has been upward; the stock is trading above most moving averages—short-, medium-, and long-term.
Indicators are generally favoring continuation of the uptrend.
⚙️ Indicators / Momentum
Many oscillators (RSI, MACD, CCI etc.) are in bullish territory.
Moving averages from 5-, 10-, 20-, 50-, 100- to 200‐day are all aligned bullish (price above them).
Volatility is moderate to high — good movement, but also risk of pullbacks.
📌 Key Support & Resistance Levels
Immediate Resistance: around ₹1,505-₹1,515.
Immediate Support: near ₹1,480-₹1,490.
Stronger support further down around ₹1,400-₹1,420 in case of sharper correction.
✅ Outlook & Risks
Short term bias is bullish as long as price holds above the immediate support (≈ ₹1,480).
If resistance around ₹1,510 breaks decisively, more upside is likely.
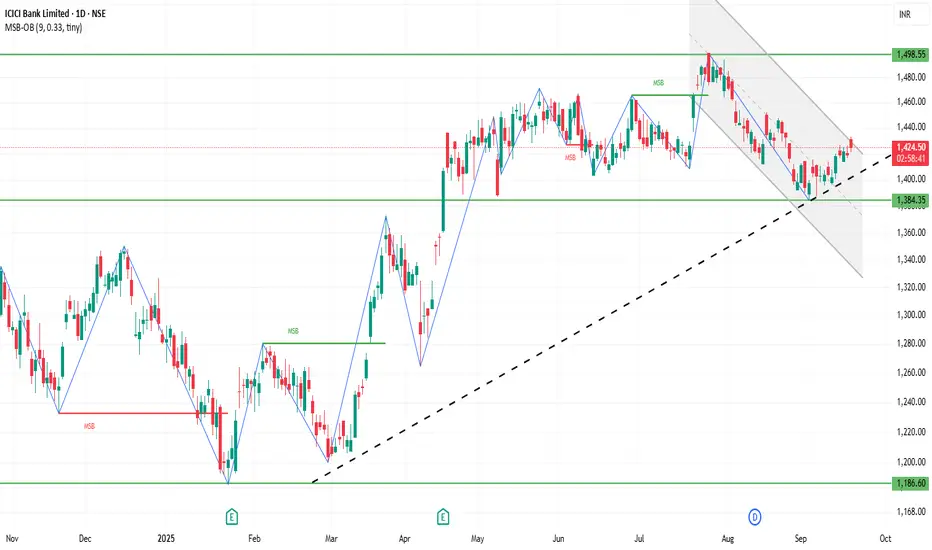
ICICIBANK 1D Time frameCurrent Snapshot
Price is around ₹1,402 – ₹1,420.
Stock is facing some short-term weakness, trading close to or slightly below short-term averages.
Longer-term trend is still stable as the price is well above its 200-day moving average.
⚙️ Indicators / Momentum
RSI (14): Neutral zone, not overbought or oversold.
MACD: Mixed, showing weak bearish pressure in the short term.
Moving Averages:
Short-term (5–10 day) → Mixed / sideways.
Medium-term (50–100 day) → Acting as resistance.
Long-term (200 day) → Still supportive, trend remains intact.
📌 Key Levels
Immediate Resistance: ₹1,440 – ₹1,450.
Immediate Support: ₹1,394 – ₹1,400.
Stronger Support: ₹1,340 – ₹1,350 zone.
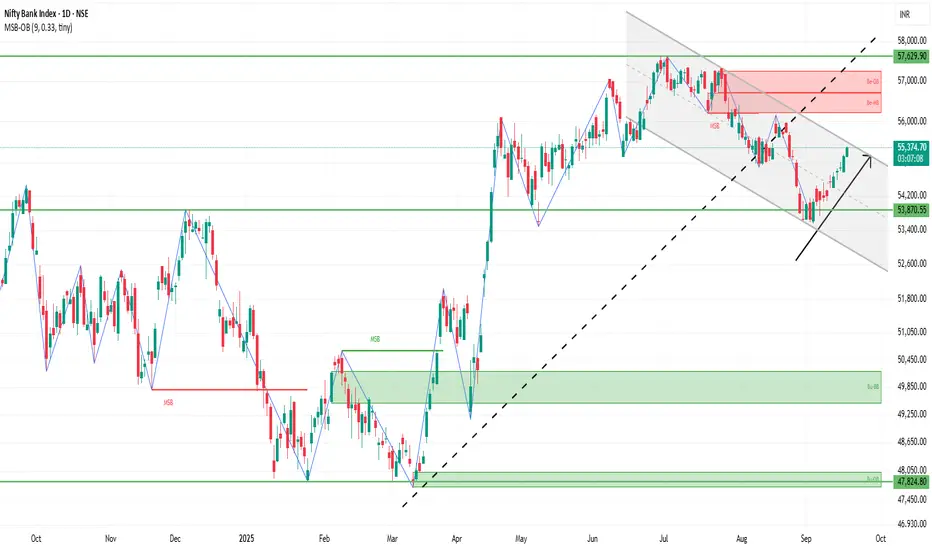
BANKNIFTY 1D Time frame📍 Current Price
BANKNIFTY is trading around 55,319.55, up 0.31% for the day.
🛑 Support Levels (Downside)
55,146.55: Recent low; immediate support.
55,000: Psychological level; key support zone.
54,777.75: Stronger support; breaking this may trigger a larger sell-off.
🔺 Resistance Levels (Upside)
55,397.05: Recent high; near-term resistance.
55,500: Round number resistance; next hurdle.
55,628.40: Strong resistance; breakout here may extend uptrend.
✅ Trend & Outlook
The trend is mildly bullish; price is above key support zones and moving averages.
Resistance is nearby; unless BANKNIFTY breaks 55,500–55,628 decisively, upward move may face pressure.
Downside risk exists if it falls below 55,146–55,000.
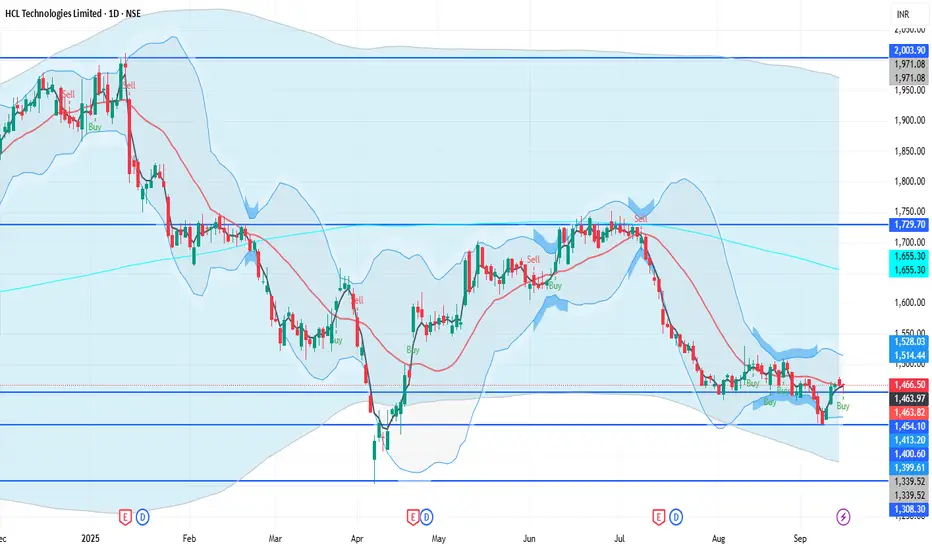
HCLTECH 1D Time frameUpdated Snapshot
Current Price: ₹1,466
Day’s Range: ₹1,452 – ₹1,467
Previous Close: ₹1,467.20
🔹 Support & Resistance
Support 1: ₹1,452 – ₹1,450
Support 2: ₹1,430 – ₹1,420
Resistance 1: ₹1,470 – ₹1,475
Resistance 2: ₹1,490 – ₹1,500
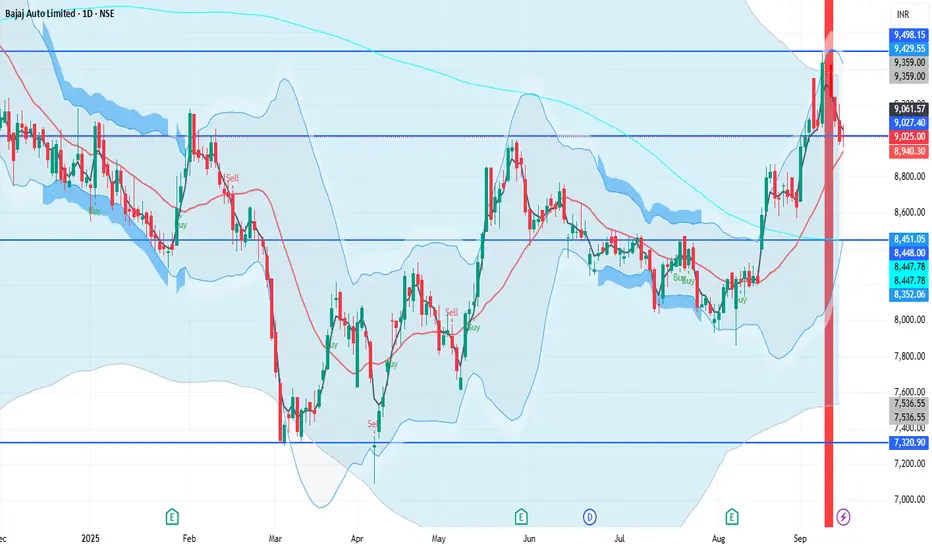
BAJAJ_AUTO 1D Time frameCurrent Price: ₹9,000 – ₹9,025
Day’s Range: ₹8,964 – ₹9,091.50
Previous Close: ₹8,999.50
🔹 Support & Resistance
Support 1: ₹8,950 – ₹8,900
Support 2: ₹8,800 – ₹8,750
Resistance 1: ₹9,050 – ₹9,100
Resistance 2: ₹9,200 – ₹9,250
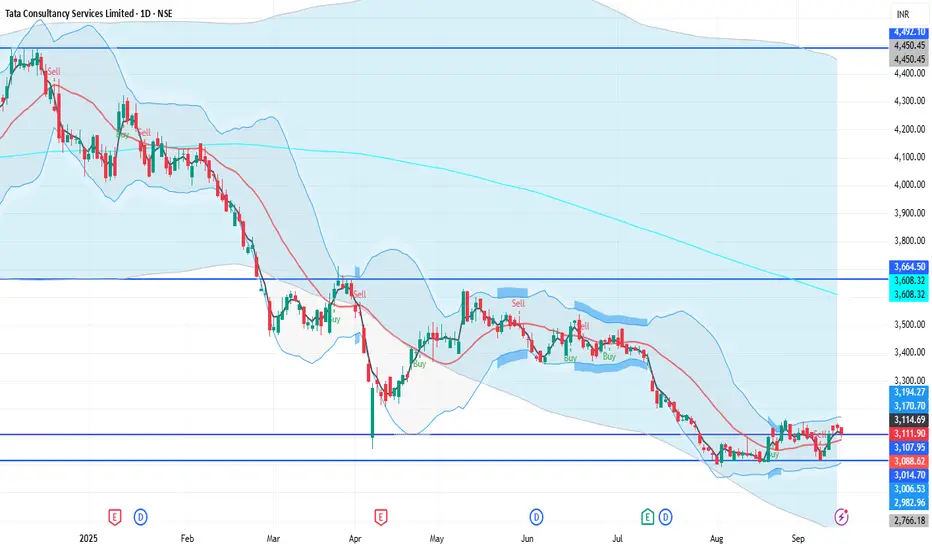
TCS 1D Time framePrice Action
Current Price: ₹3,111.60
Previous Close: ₹3,124.20
Day’s Range: ₹3,096 – ₹3,134
52-Week Range: ₹2,991.60 – ₹4,546.05
🔹 Support & Resistance
Support 1: ₹3,096
Support 2: ₹3,050 – ₹3,060
Resistance 1: ₹3,134
Resistance 2: ₹3,150 – ₹3,160
HDFCBANK 1D Time framePrice Action
Current Price: ₹967.10 (approx)
Day’s Range: ₹965 – ₹970
52-Week Range: ₹806.50 – ₹1,018.85
🔹 Support & Resistance
Immediate Support: ₹960 – ₹958
Next Support: ₹954 – ₹950
Immediate Resistance: ₹970 – ₹975
Higher Resistance: ₹980

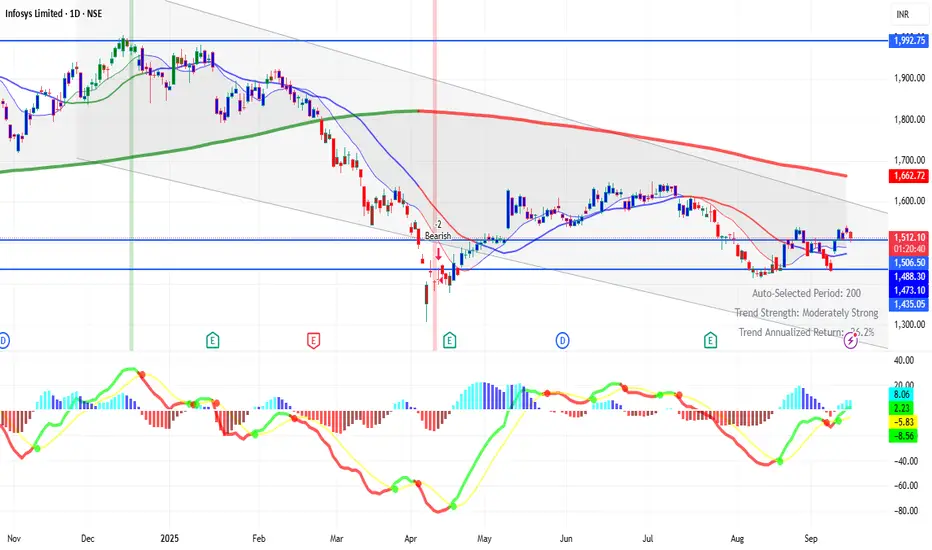
INFY 1D Time frameCurrent Price: ₹1507 (approx)
Day’s Range: ₹1507 – ₹1543
Previous Close: ₹1509.10
🔹 Support & Resistance
Support 1: ₹1500
Support 2: ₹1490 – ₹1470
Resistance 1: ₹1539 – ₹1552
Resistance 2: ₹1560 – ₹1570
KOTAKBANK 1D Time frameCurrent Price: ₹1970.40 (approx)
Day Range: ₹1968 – ₹1981.60
Previous Close: ₹1972.30
🔹 Support & Resistance
Pivot: ₹1975.70
Resistance 1: ₹1983.40
Resistance 2: ₹1989.30
Resistance 3: ₹2002.90
Support 1: ₹1969.80
Support 2: ₹1962.10
Support 3: ₹1948.50

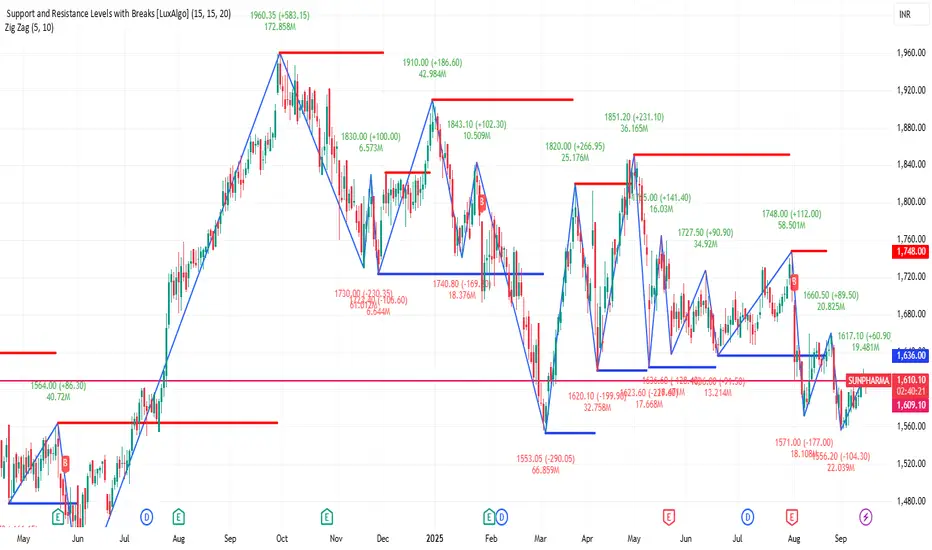
SUNPHARMA 1D Time frameUpdated Snapshot
Current Price: ₹1,607
Day’s Range: ₹1,595 – ₹1,617
Previous Close: ₹1,610
🔹 Support & Resistance
Immediate Support (S1): ₹1,600 – ₹1,595
Next Support (S2): ₹1,585 – ₹1,580
Immediate Resistance (R1): ₹1,615 – ₹1,617
Next Resistance (R2): ₹1,630 – ₹1,635
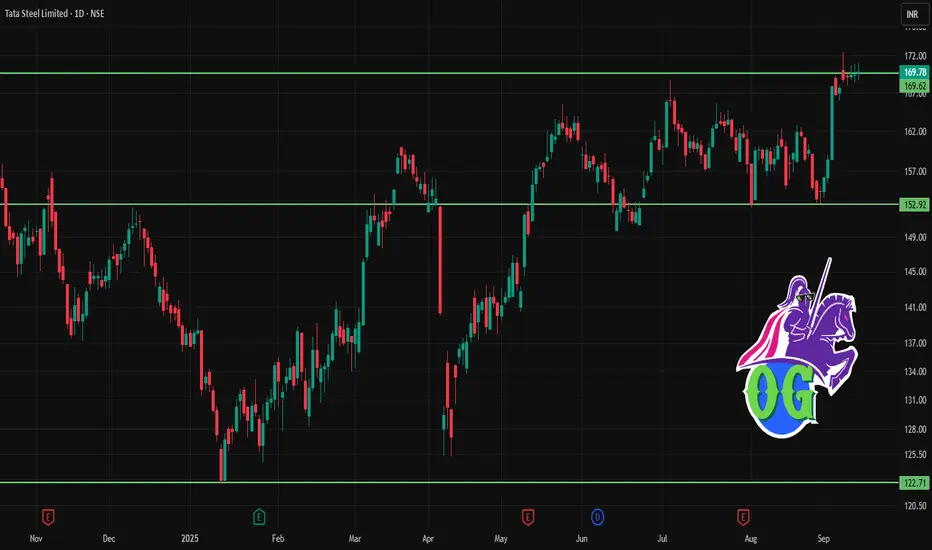
TATASTEEL 1D Time frameCurrent Price & Trend
Current Level: ₹169
Trend: Neutral to slightly bullish → stock is consolidating near support.
Momentum: Price is holding above strong support, but resistance is close.
RSI: Around 55 → neutral, leaning positive.
MACD: Flat to mildly bullish.
Moving Averages: Price is hovering around 20-day average; still above 50-day average → medium-term strength intact.
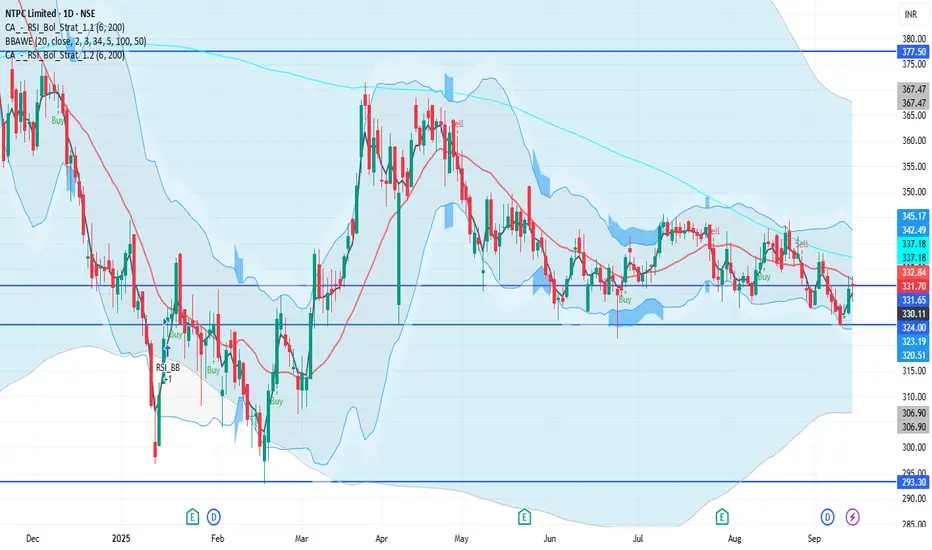
NTPC 1D Time frameCurrent Price & Trend
Price: ₹331.75
Trend: Neutral; trading approximately 26% below its 52-week high of ₹448.30, achieved on September 30, 2024.
Momentum: Indicators suggest a neutral to slightly bullish outlook.
Bullish Scenario
Breakout Above ₹340: A sustained move above ₹340 could target ₹345 – ₹350 in the short term.
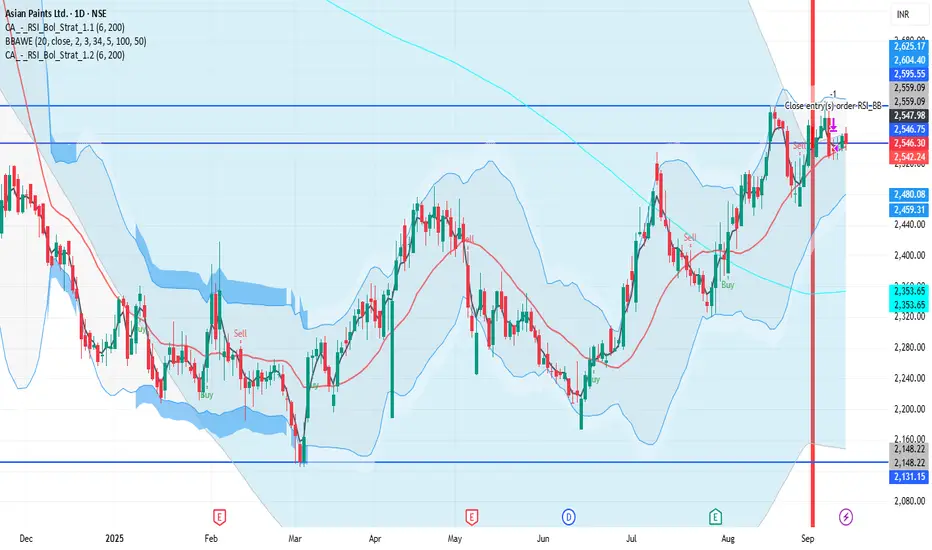
ASIANPAINT 1D Time frameCurrent Price & Trend
Price: ₹2,546.30
Trend: Consolidating near recent highs; trading approximately 25% below its 52-week high of ₹3,394.90.
Momentum: Indicators suggest a neutral to slightly bearish outlook.
Bullish Scenario
Breakout Above ₹2,580: A sustained move above ₹2,580 could target ₹2,600 – ₹2,620 in the short term.
⚠ Bearish Scenario
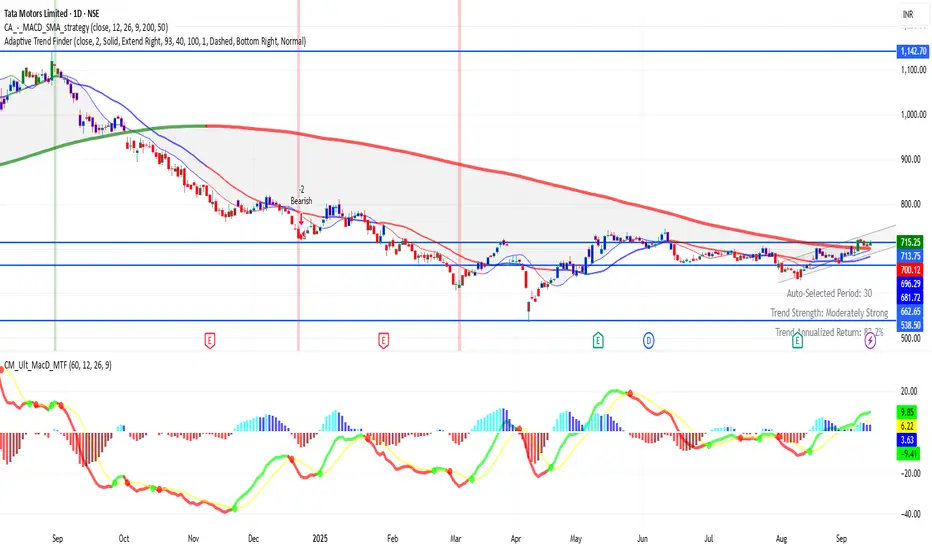
TATAMOTORS 1D Time frameCurrent Status
Price is around ₹715
The stock has been showing strength recently, with many of its moving averages (short- to long-term) supporting the rise.
Technical indicators like RSI, MACD, ADX etc. lean positive — buyers seem to have the upper hand.
There’s an inverted Head & Shoulders pattern forming, which is a bullish reversal signal if confirmed. Support zones are holding up so far.
Bullish Scenario
If Tata Motors stays above ₹700–705 support and breaks past ~₹720–725 with volume:
Possible upside to ~₹730-₹740
SBIN 1D Time frameCurrent Price Action (Daily Chart)
Price Range: Stock is moving between ₹815 – ₹830 right now.
Trend: Consolidation with mild bullish bias.
Key Levels
Immediate Resistance: ₹830
Next Resistance: ₹840 – ₹850
Major Resistance: Around ₹875 (previous high)
Immediate Support: ₹815 – ₹820
Strong Support: ₹800 – ₹805
Critical Support: ₹785

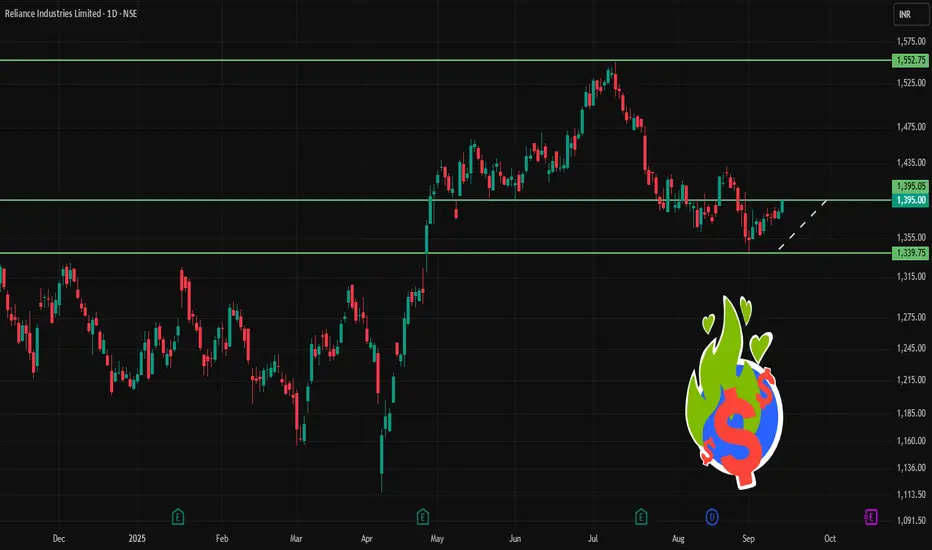
RELIANCE 1D Time frameClosing Price: ₹1,395.00
Day's Range: ₹1,380.50 – ₹1,396.30
52-Week High: ₹1,551.00
52-Week Low: ₹1,114.85
Market Cap: ₹18,87,780 crore
P/E Ratio (TTM): 25.30
Dividend Yield: 0.85%
Book Value: ₹1,100.00
EPS (TTM): ₹55.00
Face Value: ₹10.00
Volume: 7.4 million shares
VWAP: ₹1,388.40