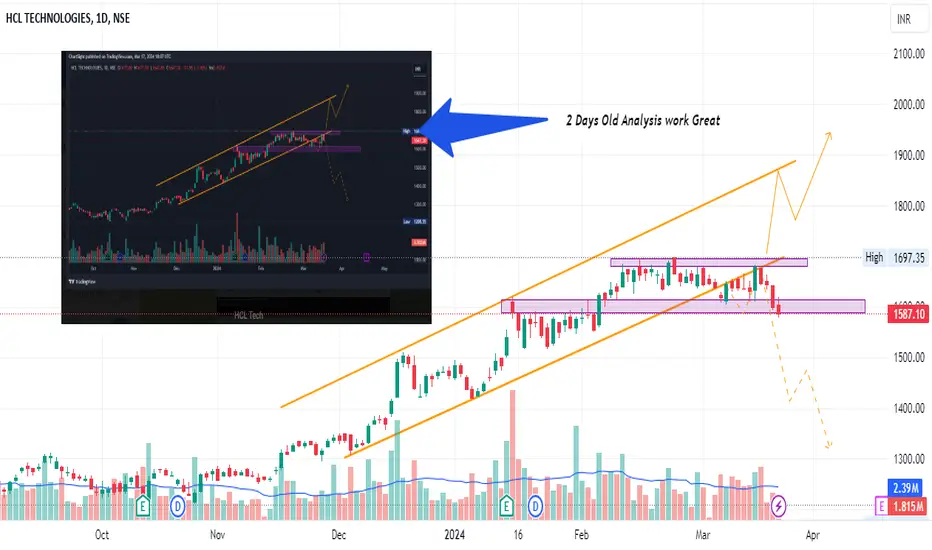
HCL TECH - Bullish Outlook | Min 25%+ upside potentialPrice Analysis & Overview:
1. Breakout & Retest of the previous ATH levels.
2. Tapped Weekly demand area.
3. EMA support taken.
4. Showing good strength in buying.
5. RRR is favourable.
Trade Plan:
ENTRY = CMP 1440
SL= 10% 1300
TP = 1:2,1:3,1:4
- Stay tuned for further insights, updates and trade safely!
- These are my personal views.
- If you liked the analysis, don't forget to leave a comment and boost the post. Happy trading!
Disclaimer: This is NOT a buy/sell recommendation. This post is meant for learning purposes only. Please, do your due diligence before investing.
Thanks & Regards,
Anubrata Ray
HCLTECH

HCLTECHHCLTECH :- Keep an eye on the stock, the stock has given a breakout
Hello traders,
As always, simple and neat charts so everyone can understand and not make it too complicated.
rest details mentioned in the chart.
will be posting more such ideas like this. Until that, like share and follow :)
check my other ideas to get to know about all the successful trades based on price action.
Thanks,
Ajay.
keep learning and keep earning.

HCLTECH |Upcoming Trade set up|Hey Family, there is a one more stock Which is showing a great opportunity.
Key Points:-
* Formation of Ascending Triangle Pattern in Daily TF.
* From Sep 2024 to Nov 2024 Tested & Moving Near Resistance Many times.
* It's Near resistance Zone and trying to Sustain Near Resistance Zone with good volume good closing required.
* Volume Accumulation (Volume is Rising).
What is your view please comment it down and also boost the idea this help to motivate us. We are Certified. All views shared on this channel are my personal opinion and is shared for educational purpose and should not be considered advise of any nature.

RCF CHART IS LOOKING GOODRCF chart is looking good for long term as its reacted from strong demand area. All my views are oersonal. These charts are not a buy or sell recommendation

HCLTECH Breakout with a good upside potentialHey Family, there is a one more stock Which is showing a great opportunity.
Key Points:-
* Formation of Ascending Triangle Pattern in Daily TF.
* From Sep 2024 to Oct 2024 Tested & Moving Near Resistance Many times.
* It's Break resistance Zone and trying to Sustain above Resistance Zone with good volume good closing required.
* Volume Accumulation (Volume is Rising).
What is your view please comment it down and also boost the idea this help to motivate us. We are Certified. All views shared on this channel are my personal opinion and is shared for educational purpose and should not be considered advise of any nature.

HCLTECH - STOCK ON RADAR#HCLTECH
Day Trendlyne Momentum Score
66.3
Score is 66.29, stock is technically moderately strong. Stocks with score between 60 and 70 are considered as technically Moderately Strong.
Day RSI(14)
RSI is 67.8, RSI below 30 is considered oversold and above 70 overbought.
HCL Technologies Ltd. has made a new 52 week high today.

Strong breakout in HCL TechAs per harmonic pattern, AB=CD gives upside confirmation by breaking B point.
As per price action pattern, there is a pennant breakout.
Here we have DOUBLE confirmation, so we can try long position with immediate target of 1900.
This is for educational purposes only.

HCL TECH Bullish Now!1. 50 EMA shows clear uptrend direction.
2. A nice pin bar formed at strong support area.
3. Resistance area near at 1810.
4. Let's see what happens at end.

HCLTECH RESISTANCE BREAKOUT WCBHcltech breaking resistance weekly basis
with good volume,trading at ATH
V shape recovery
#target 2000 after breaking 1835
EDUCATIONAL IDEA

HCL TechnologiesImportant points marked.
*********Investing in equity is subjected to market risk do own research before investing********
Education purpose only.

HCL TECH - SWING TRADE ON LONG SIDESymbol - HCLTECH
HCL Tech is currently trading at 1360
1300 - 1360 is a good support area for HCL Technologies Ltd.
I'm seeing a trading opportunity on buy side.
Buying HCL Tech Futures at CMP 1360
I will be adding more if 1330 comes & hold with SL of 1295
Targets I'm expecting are 1440 - 1485 & beyond.
Disclaimer - Do not consider this as a buy/sell recommendation. I'm sharing my analysis & my trading position. You can track it for educational purposes. Thanks!

HCLTECH Near Support Hold or Break NSE:HCLTECH This Guys Fall 24% in 77 - Days Now Near Support and FIB 50% also We Need Wait For Reversal and Candle Closing ---- Add to Your Watchlist

HCL Correction looks overNSE:HCLTECH
Weekly and Daily TF analysis
Wave 4 correction looks getting over
Wave 5 Rally shall resume

HCL Tech at Do or Die LevelThere is a one more stock Which is showing a great opportunity, stock is near Support it's do or die. what is your view please comment it down. We are NISM Certified. All views shared on this channel are my personal opinion and is shared for educational purpose and should not be considered advise of any nature.
Pasted a image from my private idea because daily idea post limit is reached.
HCLTECH - 1 Year targetsThis post is for educational purpose only, please take any trade at your own risk.
C&H pattern targets already achieved, now flag pattern on monthly need to be achieved, for now 1680 seems near term target, 1880 medium term target and 2080 long term target (6 months to 1 Yr most likely)

HCLTECH Trade plan for coming weeks1. ATH Breakout - Confirmed
2. Potential Target 1921+
3. Trend Bullish
4. Market Trend - Bullish

15 Jan ’24 — BankNifty stance change from neutral to bullish 🐂BankNifty Analysis - Stance Bullish ⬆️
BankNifty also gets a stance upgrade from neutral to bullish today. After we crossed the 47539 resistance, its level as support never got tested. Today’s gap-up was not so visible for the banks - but the price action was more healthy.
4mts chart
The stance change came only in the last 15 minutes or so when BankNifty started to shift the gears. 48250 was a level I was watching for. Even though we did not breach it today, the momentum banknifty showed in the last 1 hour was more than satisfactory to change the stance.
63mts chart
The last candle made all the difference today, that is the secret ingredient for the change of stance. For tomorrow, the first thing BN has to do is take out the 48422 levels and if possible get a new ATH. The quarterly results from the component stocks will have a huge role to play. Look what the results of TCS, INFY, WIPRO, HCLTECH did to the NiftyIT sector - it almost went up 9% in the last 2 sessions.

HCLTech (Weekly Breakout Stock)HCLTech can give a breakout above the 1377 level. The stock needs to close above the 1377 level. The chart looks good on weekly and monthly time frames. It has a possible upside of 1483 and 1650. One can place a stop loss of 1357 on a weekly closing basis. The level of 1377 can act as a support zone. Also, a round bottom pattern can be seen on a weekly time frame.
Disclaimer: I am not a SEBI registered analyst. All the stocks are for educational purposes. Investors must consult a financial advisor before making any investment. It is not a buy or sell recommendation

HCLTECH DOUBLE BOTTOM BREAKOUTHcltech breaking double bottom
with huge volume
trading around ATH
EDUCATIONAL IDEA

HCL TECH looks bullish on breakout* ABCD pattern active
* mid term to lone term target goal 1878
* best entry after a healthy pullback
* entry from current level has big stoploss on monthly timeframe

LONG | HCL TECHThis is a weekly time frame analysis of Hcl tech.
The stock looks good for the short term.
accumulation can be done till 1150.

HCL Technologies Ltd | A IT Sector Momentum StockHCL Technologies Ltd | A IT Sector Momentum Stock
HCL Tech is a leading global IT services company, which is ranked amongst the top five Indian IT services companies in terms of revenues
Financial :Strong
Market Cap n= 3,96,928 Cr. ROCE = 28.3 % ROE = 23.0 %
Debt to equity = 0.08 Promoter holding = 60.8 % Quick ratio = 2.56
Current ratio = 2.56 Piotroski score = 8.00 Profit Var 3Yrs = 10.2 %
Sales growth 3Years = 12.8 % Return on assets = 16.1 %
HCL Tech is strong fundamental stock with right now in monthly basis have strong momentum.
also all IT sector is in bullish trend .This is ready to going in uncharted territory space.
so we have to closely watch this stock for future.
Note: I am not SEBI registered financial Adviser. I solely present my views on chart .I do not charge any kind of service. This is not buy sell recommendation.
If you like my ideas than like boost and follow me for more ideas.
Thanks and comment freely

22nd Dec ’23 - Nifty’s levels today are skewed by NiftyIT 🚀🚀🚀Nifty Analysis
Recap from yesterday: “I am inclined to change my stance to neutral with the developments of today. Giving the bears one more opportunity to prove their mettle, hence going with the bearish stance for tomorrow as well. All they have to do is keep Nifty50 below 21200 in the opening 2hrs for the momentum to kick in”
4mts chart link - click here
Nifty’s price action was deceptive today, mainly because of the outperformance by NiftyIT(+2.27%). The real action today happened in BankNifty (-0.73%). Let me try to elaborate. Between 13.59 and 15.03 NiftyIT rallied 799pts ~ 2.29% in a surprising move. This skewed the Nifty50 numbers too. INFY, Wipro, HCL, TCS, and LTIM contributed 44pts out of 94 today.
NiftyIT 4mts chart link - click here
NiftyIT even though it started negative had a total swing range of 1029pts today. I guess NSE has to consider opening up FnO on NiftyIT seriously and set the expiries on Mondays. After all, we have 6 stocks of Nifty50 in BankNifty. Similarly, we have 6 stocks of Nifty50 in NiftyIT.
63mts chart link - click here.
Since Monday is a holiday, it gives us added uncertainty on what to expect on Tuesday. Despite the 94pts gain by Nifty - I still see the price action as negative. I would like to go with a bearish stance for 26th Dec. A gap-up or gap-down possibility cannot be ruled out as we are going for the extended weekend with bad geo-political macros.
