Support and Resistance Support Level:
A price level where demand is strong enough to prevent the price from falling further. It's like a floor—buyers enter here expecting prices to rise.
Example: If Nifty falls to 22,000 repeatedly and bounces back, 22,000 becomes a support level.
🔹 Resistance Level:
A price level where selling pressure overcomes buying, preventing prices from rising. It's like a ceiling—sellers dominate at this level.
Example: If Bank Nifty rises to 50,000 but fails to move above, 50,000 is resistance.
📊 How to Identify Them:
Historical price charts
Trendlines
Moving averages
Fibonacci levels
Volume analysis
📈 Use in Trading:
Buy near support
Sell near resistance
Use breakout strategy when price breaches either level
HDF

Advanced Institutions Option Trading - Part 6 Volatility Tools in Options
Understanding volatility is central to success in option trading:
🌀 Types of Volatility:
Historical Volatility (HV): Based on past prices
Implied Volatility (IV): Market’s expectation of future movement
📊 Volatility-Based Strategies:
High IV: Sell premium – strategies like Iron Condor, Credit Spreads
Low IV: Buy premium – strategies like Long Straddle, Long Call/Put
Tools like IV Rank and IV Percentile help traders choose the right strategy based on volatility regime.

Divergence SecretsDivergence moves in the opposite direction of the technical indicator.
Divergence occurs when there is a high probability of price retracement.
Divergence analysis is recommended only if you observe double top, double bottom, higher high, and lower low formation.

MARUTI SUZUKI INDIA LTD.MARUTI SUZUKI INDIA LTD.
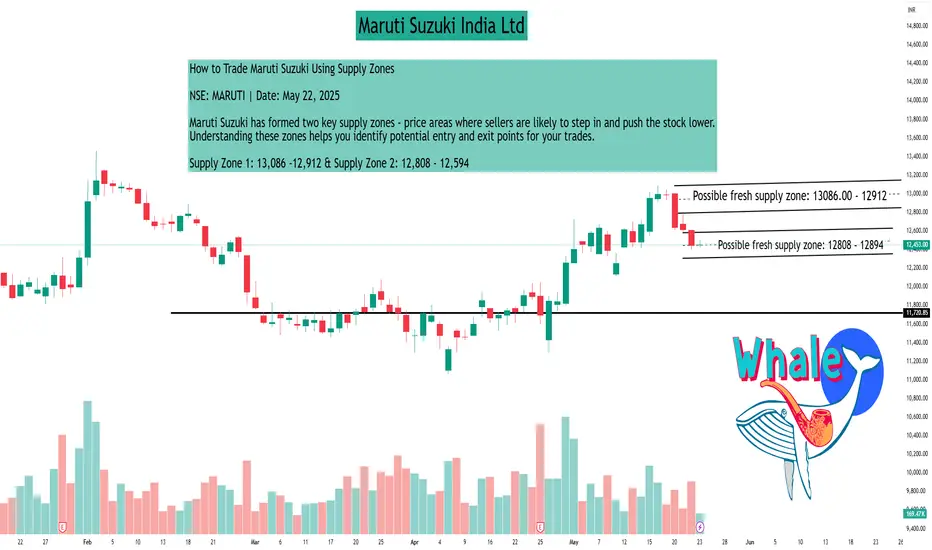
How to Trade Maruti Suzuki Using Supply Zones
NSE: MARUTI | Date: May 22, 2025
Maruti Suzuki has formed two key supply zones - price areas where sellers are likely to step in and push the stock lower. Understanding these zones helps you identify potential entry and exit points for your trades.
Supply Zone 1: 13,086 -12,912 & Supply Zone 2: 12,808 - 12,594
Bearish Scenario:
Maruti is currently trading near 12,445, below both identified supply zones. Recent price action shows a strong bearish candle accompanied by above- average volume, indicating active selling pressure around these resistance levels. If the price continues to remain below 12,800, selling pressure may persist. Traders could consider cautious short-selling strategies either at current levels or wait for the price to move back into the supply zones for confirmation before initiating short positions. It is important to follow proper risk management practices, including placing stop-loss orders above the supply zones, to manage potential downside risks.
Bullish Scenario:
A sustained breakout above 13,100 with strong volume confirmation would indicate that buying interest has surpassed selling pressure within the supply zones. Such a breakout may invalidate the resistance levels and signal renewed upward momentum in the stock, presenting potential opportunities for long positions. Traders may consider initiating or increasing long positions once the breakout is confirmed through price action and volume. It is important to use appropriate risk management measures, such as placing stop-loss orders below the breakout level.
For Learners:
Think of supply zones like traffic jams for bulls - when the price enters these zones, you can expect potential slowdowns or reversals unless there's strong momentum to push through. Always combine supply zone analysis with other confirmations like volume, candlestick patterns, and broader market context.
▲ Risk Management Tip: Always trade with a clearly defined stop loss. Avoid entering positions impulsively. It is advisable to start with a smaller quantity and increase your exposure only if the price action confirms the continuation of the trend. Capital protection should always be the priority.
Disclaimer
This content is created purely for educational and informational purposes. It is not intended as investment advice, stock recommendations, or trading tips. Trading and investing in the stock market involves risk. Please consult with a SEBI- registered financial advisor before making any investment decisions. The author/creator is not registered with SEBI and shall not be held responsible for any losses incurred based on this information. Always do your own research and use proper risk management.
If you found this analysis helpful, don't forget to Follow, so you never miss out on a trade-worthy setup, breakout opportunity, or valuable educational insight again. Stay updated and trade smarter!?
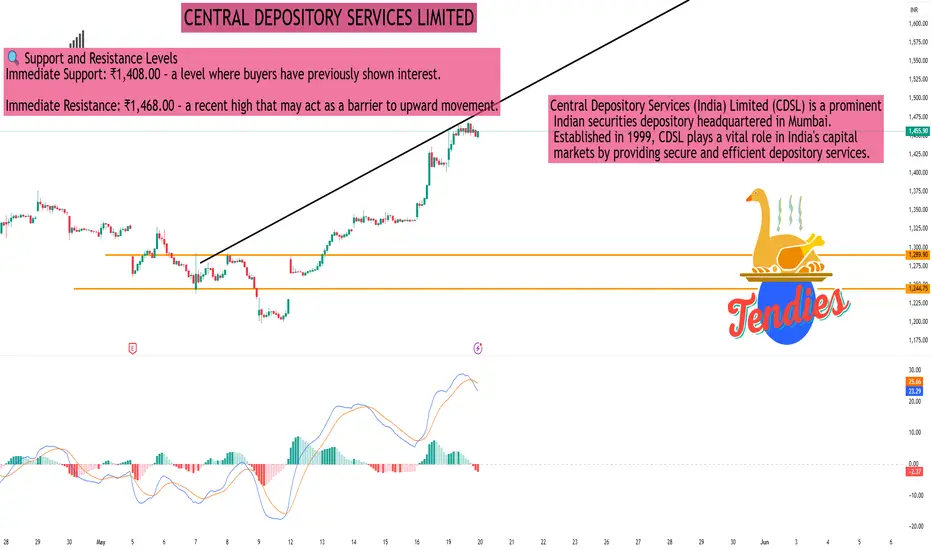
CENTRAL DEPOSITORY SERVICES LIMITEDAs of the close on Monday, May 19, 2025, Central Depository Services (India) Ltd (NSE: CDSL) was trading at ₹1,450.80, marking a 2.98% increase from the previous session.
📊 30-Minute Timeframe Technical Overview
Price Action:
Day's Range: ₹1,408.00 – ₹1,468.00
52-Week Range: ₹1,047.45 – ₹2,989.00
Volume: Approximately 9.5 million shares traded, indicating heightened market activity.
Technical Indicators:
Relative Strength Index (RSI): 69.89 – approaching overbought territory, suggesting caution.
Moving Average Convergence Divergence (MACD): 36.23 – indicating bullish momentum.
Average Directional Index (ADX): 16.44 – suggesting a weak trend strength.
Stochastic Oscillator: 80.92 – in the overbought zone, which may precede a price correction.
Indicator: ₹1,280.03 – acting as a support level.
Parabolic SAR (PSAR): ₹1,209.57 – indicating an upward trend.
🔍 Support and Resistance Levels
Immediate Support: ₹1,408.00 – a level where buyers have previously shown interest.
Immediate Resistance: ₹1,468.00 – a recent high that may act as a barrier to upward movement.
🔭 Outlook
The technical indicators suggest that CDSL is experiencing a strong bullish trend. However, the RSI and Stochastic Oscillator indicate that the stock is nearing overbought conditions, which could lead to a short-term consolidation or minor correction. Investors should monitor the support and resistance levels closely and consider the heightened trading volume, which may affect the strength of the current trend.
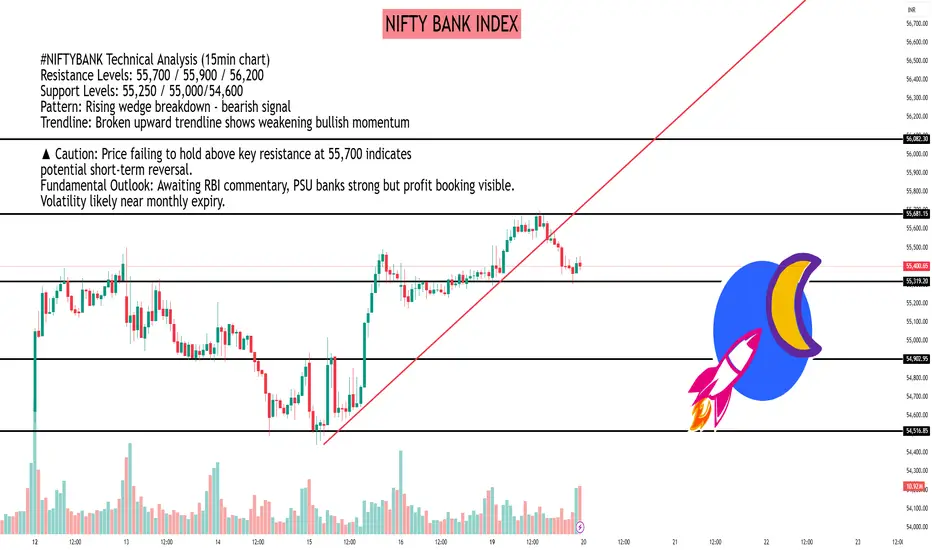
NIFTY BANK INDEX #NIFTYBANK Technical Analysis (15min chart)
Resistance Levels: 55,700 / 55,900 / 56,200
Support Levels: 55,250 / 55,000/54,600
Pattern: Rising wedge breakdown - bearish signal
Trendline: Broken upward trendline shows weakening bullish momentum
▲ Caution: Price failing to hold above key resistance at 55,700 indicates
potential short-term reversal.
Fundamental Outlook: Awaiting RBI commentary, PSU banks strong but profit booking visible. Volatility likely near monthly expiry.
RSI ( Relative Strength Index)In trading, RSI stands for Relative Strength Index, a momentum indicator used to assess overbought or oversold conditions in a market. It measures the speed and change of price movements, providing traders with insights into potential entry and exit points.

IOC LTDIOC
BUY
Entry price above: 145 Target 155/165
Stop loss 138
Time period: Swing/Positional call
After crossing 145 levels stock can show a good up move. Good reports are also there.
I am just representing my views For educational purposes only.
