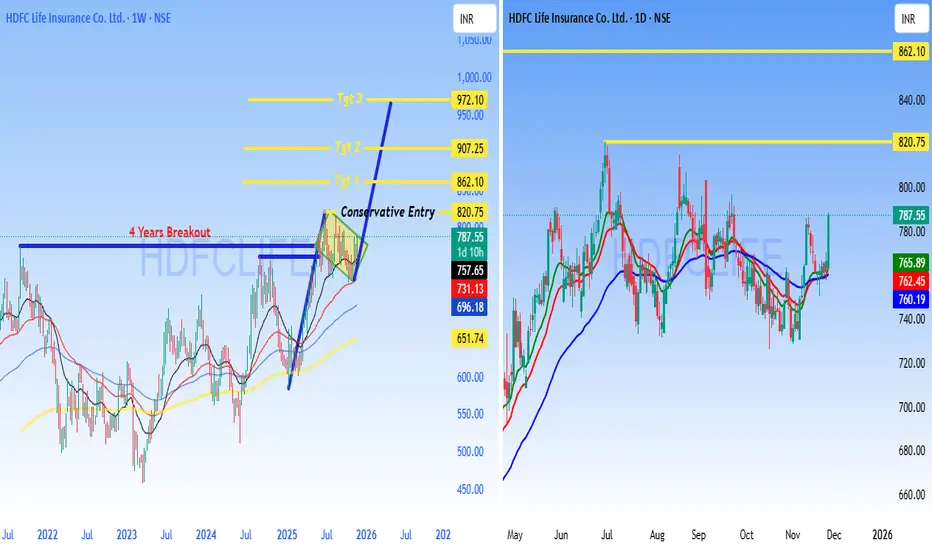
HDFCLIFE - BUY - Technical AnalysisHDFC Life Insurance - 4-Year Breakout Setup
HDFCLIFE (NSE) Current Price: 787.55
Date: November 27, 2025
Key Highlight: 4-YEAR BREAKOUT CONFIRMED
HDFC Life has broken out from a **4-year consolidation zone** around 787, signaling a major technical development with significant upside potential.
Technical Setup
4-Year Resistance Breakout - Stock cleared multi-year hurdle
Strong Volume Confirmation - Breakout supported by buying interest
Higher Highs Pattern - Bullish structure on daily chart
Moving Averages Aligned - Trending above key EMAs
Price Targets
Target 1: 862.10
Target 2: 907.25
Target 3: 972.10
Conservative Entry: 820.75 (post-retest confirmation)
Trading Plan
Entry Zone: 787-820
Stop Loss: Below 757 (breakout invalidation)
Risk:Reward: 1:3+ favorable setup
Strategy: Long-term breakout traders can accumulate; conservative traders wait for pullback to ₹820 zone.
- 4-year resistance breakouts often lead to sustained rallies
- Insurance sector showing strength
- Strong institutional interest in HDFC Life
- Technical + fundamental alignment
Risk Management
- Use stop loss below 757
- Position size: Risk only 1-2% capital
- Trail stop loss as targets are achieved
- Monitor broader market conditions
DISCLAIMER
**NOT investment advice. For educational purposes only.** I am NOT a SEBI registered analyst. This is technical analysis based on chart patterns. Trading involves substantial risk. Do your own research (DYOR). Consult a financial advisor before investing. Trade at your own risk.
**#HDFCLIFE #Breakout #StockMarket #NSE #TechnicalAnalysis #Insurance #Trading #IndianStocks #ChartAnalysis #SwingTrading #BreakoutTrading #TradingView #StockAlert #BullishSetup #PriceAction**
HDFC
Real Knowledge of MarketCore Foundational Knowledge
Derivatives Basics: Options are derivative contracts, meaning their value is derived from an underlying asset (stocks, indices, commodities, etc.).
Key Terminology: A trader must be fluent in terms like call options (right to buy), put options (right to sell), strike price, premium, expiration date, intrinsic value, and time value.
Rights vs. Obligations: Understanding that option buyers have the right, but not the obligation, to exercise, while option sellers (writers) have the obligation if exercised, is fundamental to risk assessment.
Leverage: Options offer significant leverage, meaning a small amount of capital can control a large position in the underlying asset, which amplifies both potential profits and losses.

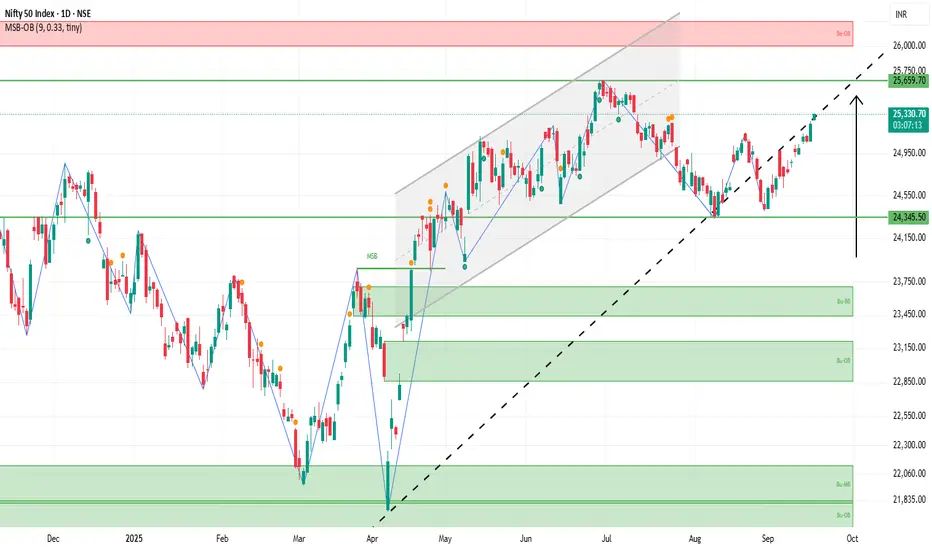
NIFTY 1D Time frame Today’s Nifty
Nifty is around 25,326.
It started higher than yesterday, so buyers are slightly stronger.
The trend is mildly bullish, not too strong.
Support (Where Nifty may stop falling)
25,229 → first safety net.
25,200 → key round number support.
25,000 → strong support; big drop if broken.
Resistance (Where Nifty may stop rising)
25,261 → small ceiling.
25,316 → bigger hurdle; breaking means bulls are strong.
25,350–25,360 → tough ceiling; breakout may continue uptrend.
Trend & Simple View
Mildly bullish now.
If Nifty breaks resistance, it may go higher.
If it falls below support, it may drop more.
Easy analogy: Nifty is like a ball bouncing between floor (support) and ceiling (resistance).
RELIANCE 1D Time frame📍 Current Price
₹1,395.00 (closing price)
Short-Term Outlook
Bullish Scenario: A sustained move above ₹1,400.00 could lead to a test of the 52-week high around ₹1,551.00.
Bearish Scenario: A drop below ₹1,375.00 may signal a potential pullback toward ₹1,350.00.

SENSEX 1D Time frame📊 Current Snapshot
Current Price: ₹81,571
Day’s Range: ₹81,500 – ₹81,600
Previous Close: ₹81,425.15
Opening Price: ₹81,504.36
Volume: Moderate
📈 Trend & Indicators
Trend: Neutral to mildly bullish; trading near short-term resistance.
RSI (14): Neutral zone.
MACD: Positive → indicating mild bullish momentum.
Moving Averages: Short-term averages indicate neutral to slightly bullish outlook.
🔮 Outlook
Bullish Scenario: Break above ₹81,700 with strong volume could target ₹81,900.
Bearish Scenario: Drop below ₹81,400 may lead to further decline toward ₹81,200.
Neutral Scenario: Consolidation between ₹81,400 – ₹81,700; breakout needed for directional move.
📌 Key Factors to Watch
Economic Indicators: Interest rates, inflation, and RBI policy updates.
Sector Performance: Trends in the IT and financial sectors.
Global Cues: Global market trends, US indices, crude oil, and currency movements.

Primary Market vs Secondary MarketIntroduction
Financial markets form the backbone of modern economies, serving as a bridge between those who have surplus capital and those who need funds for productive purposes. They are not just places where securities are traded, but dynamic systems that drive economic growth, liquidity, and wealth distribution. At the heart of these systems lie two fundamental market segments: the primary market and the secondary market.
Understanding these two markets is critical for anyone interested in finance, investing, or the broader economy. While the primary market deals with the issuance of new securities, the secondary market provides the platform where those securities are subsequently traded among investors. Both markets are interdependent, yet they perform distinct roles in capital formation and liquidity.
This write-up explores in detail the concepts, functions, participants, instruments, advantages, disadvantages, examples, and global relevance of the primary and secondary markets, offering a clear comparative analysis.
1. What is the Primary Market?
The primary market, also known as the new issue market, is where securities are issued for the first time. It is the platform through which companies, governments, or other institutions raise funds by selling financial instruments like shares, bonds, debentures, or other securities directly to investors.
1.1 Key Features of the Primary Market
First-time issuance: Securities are sold for the very first time.
Funds directly to issuer: The proceeds go directly to the issuing company or government.
Capital raising function: Enables companies to fund projects, expansions, or repay debt.
Regulation: Highly regulated to protect investors (e.g., SEBI in India, SEC in the USA).
No trading: Securities are only issued, not resold in this market.
1.2 Methods of Raising Capital in the Primary Market
Initial Public Offering (IPO): When a private company offers its shares to the public for the first time.
Follow-on Public Offer (FPO): A listed company issues additional shares to raise more capital.
Rights Issue: Shares offered to existing shareholders at a discounted price.
Private Placement: Securities sold to a select group of investors (institutions, banks, HNIs).
Preferential Allotment: Issuing shares to specific investors at a fixed price.
1.3 Example of Primary Market Activity
When LIC (Life Insurance Corporation of India) launched its IPO in 2022, it raised capital by selling new shares to the public. The money collected went directly to LIC (or in some cases, to the government, which was the promoter).
2. What is the Secondary Market?
The secondary market, also known as the stock market or aftermarket, is where previously issued securities are traded among investors. Once securities are issued in the primary market, they get listed on stock exchanges, and investors can buy and sell them freely.
2.1 Key Features of the Secondary Market
Trading between investors: No fresh capital goes to the issuing company.
Liquidity: Provides a platform for investors to convert securities into cash.
Price discovery: Market forces (demand and supply) determine security prices.
Continuous trading: Investors can trade daily as long as exchanges are open.
Organized exchanges: Securities are traded on platforms like NSE, BSE, NYSE, NASDAQ, etc.
2.2 Types of Secondary Markets
Stock Exchanges: Organized markets where equity and debt securities are traded.
Examples: NSE, BSE (India); NYSE, NASDAQ (USA); LSE (UK).
Over-the-Counter (OTC) Market: A decentralized market where securities not listed on exchanges are traded directly between parties.
2.3 Example of Secondary Market Activity
If you buy Reliance Industries shares from another investor on NSE, that transaction occurs in the secondary market. Reliance does not receive the money from your purchase — it goes to the selling investor.
3. Participants in Primary and Secondary Markets
3.1 Participants in the Primary Market
Issuers: Companies, governments, or institutions raising capital.
Investors: Retail investors, institutional investors, mutual funds, pension funds.
Underwriters: Banks or investment firms that guarantee the sale of securities.
Regulators: SEBI, SEC, FCA, etc., ensuring fair play and transparency.
3.2 Participants in the Secondary Market
Buyers and Sellers (Investors): Retail, institutional, FIIs, mutual funds.
Stock Exchanges: Platforms enabling trading.
Brokers & Dealers: Intermediaries facilitating transactions.
Market Makers: Entities ensuring liquidity by quoting buy/sell prices.
Regulators: Ensure fair trading, prevent fraud, and monitor disclosures.
4. Instruments Traded
4.1 Primary Market Instruments
Equity Shares (IPOs, FPOs, Rights Issues).
Debt Instruments (Bonds, Debentures).
Hybrid Instruments (Convertible debentures, preference shares).
4.2 Secondary Market Instruments
Equity Shares.
Bonds & Debentures (already issued).
Derivatives (Futures, Options).
ETFs, Mutual Funds (listed ones).
5. Importance of the Primary Market
Capital Formation: Helps companies and governments raise funds.
Industrial Growth: Enables businesses to expand and innovate.
Encourages Savings & Investment: Channelizes savings into productive use.
Diversification of Ownership: Encourages public participation in ownership.
Government Funding: Governments raise money for infrastructure via bonds.
6. Importance of the Secondary Market
Liquidity Provider: Investors can exit investments anytime.
Price Discovery Mechanism: Market sets fair value of securities.
Encourages Investment in Primary Market: Investors buy IPOs because they know secondary markets provide exit options.
Wealth Creation: Allows investors to grow wealth through trading and long-term holdings.
Economic Indicator: Stock market performance reflects overall economic health.
7. Key Differences Between Primary and Secondary Market
Basis Primary Market Secondary Market
Meaning New securities issued for the first time Previously issued securities traded
Participants Issuers, investors, underwriters Buyers, sellers, brokers
Funds Flow Goes to the issuing company/government Goes to the selling investor
Price Fixed by issuer (through book-building or valuation) Determined by demand and supply
Purpose Capital raising Liquidity and wealth creation
Trading Platform Directly between company and investors Stock exchanges or OTC
Risk High (new issue, uncertain returns) Relatively lower (market data available)
8. Advantages & Disadvantages
8.1 Advantages of the Primary Market
Provides funds for business expansion.
Encourages entrepreneurship.
Offers investment opportunities for public.
Helps government raise money for development.
8.2 Disadvantages of the Primary Market
High risk (company’s future performance uncertain).
Heavy compliance and regulatory costs.
Limited exit options until securities are listed in the secondary market.
8.3 Advantages of the Secondary Market
Provides liquidity and flexibility.
Encourages savings and investments.
Facilitates portfolio diversification.
Reflects investor confidence and economic conditions.
8.4 Disadvantages of the Secondary Market
Market volatility and speculation.
Risk of losses due to sudden price movements.
Subject to manipulation and insider trading (if not regulated well).
9. Case Studies
Case Study 1: Infosys IPO (1993)
Infosys raised capital via its IPO in the primary market. Initially undervalued, the shares later grew multifold in the secondary market, rewarding long-term investors.
Case Study 2: Tesla, Inc. (USA)
Tesla raised billions through IPO and follow-on offerings in the primary market. In the secondary market, its stock witnessed massive growth, creating wealth for investors worldwide.
Case Study 3: Indian Government Bonds
The Indian government issues bonds in the primary market to finance fiscal needs. These bonds later trade in the secondary bond market, offering liquidity to investors.
10. Interrelationship Between Primary and Secondary Market
A vibrant secondary market encourages participation in the primary market because investors know they can exit later.
Strong primary market activity provides fresh investment opportunities for secondary market trading.
Both markets complement each other — one raises funds, the other ensures liquidity.
11. Global Perspective
USA: NYSE & NASDAQ dominate secondary markets; IPOs (primary market) attract global investors.
India: NSE & BSE secondary markets are vibrant; IPO activity growing (e.g., Zomato, Nykaa, Paytm IPOs).
China: Shanghai & Shenzhen exchanges are growing rapidly, supporting capital formation.
Europe: London Stock Exchange and Euronext play dual roles in both markets.
12. Conclusion
The primary and secondary markets are two integral pillars of the financial system. While the primary market focuses on capital formation by enabling issuers to raise funds, the secondary market provides liquidity, price discovery, and investment opportunities for participants.
Together, they create a cycle: companies raise funds, securities get listed, investors trade them, and capital continues to flow. Without the primary market, businesses would struggle to finance growth; without the secondary market, investors would lack exit options, and the primary market would lose appeal.
Thus, both markets complement each other and are essential for economic growth, financial stability, and wealth creation.

Part 6 Learn Institutional TradingOptions in Indian Markets
In India, options are traded on NSE and BSE, primarily on:
Index Options: Nifty, Bank Nifty (most liquid).
Stock Options: Reliance, TCS, Infosys, etc.
Weekly Expiry: Every Thursday (Nifty/Bank Nifty).
Lot Sizes: Fixed by exchanges (e.g., Nifty = 50 units).
Practical Example – Nifty Options Trade
Scenario:
Nifty at 20,000.
You expect big movement after RBI policy.
Strategy: Buy straddle (20,000 call + 20,000 put).
Cost = ₹200 (call) + ₹180 (put) = ₹380 × 50 = ₹19,000.
If Nifty moves to 20,800 → Call worth ₹800, Put worthless. Profit = ₹21,000.
If Nifty stays at 20,000 → Both expire worthless. Loss = ₹19,000.
Option Trading Psychology
Patience: Many options expire worthless, don’t chase every trade.
Discipline: Stick to stop-loss and position sizing.
Avoid Greed: Sellers earn small consistent income but risk blow-up if careless.
Stay Informed: News, earnings, and events impact volatility.

PCR Trading StrategyNon-Directional Strategies
Used when you expect low or high volatility but no clear trend.
Straddle
When to Use: Expecting big move either way.
Setup: Buy call + Buy put (same strike, same expiry).
Risk: High premium cost.
Reward: Large if price moves sharply.
Strangle
When to Use: Expect big move but want lower cost.
Setup: Buy OTM call + Buy OTM put.
Risk: Lower premium but needs bigger move to profit.
Iron Condor
When to Use: Expect sideways movement.
Setup: Sell OTM call + Buy higher OTM call, Sell OTM put + Buy lower OTM put.
Risk: Limited.
Reward: Premium income.
Butterfly Spread
When to Use: Expect price to stay near a target.
Setup: Combination of long and short calls/puts to profit from low volatility.

Part 4 Learn Institutional TradingProtective Put
When to Use: To insure against downside.
Setup: Own stock + Buy put option.
Risk: Premium paid.
Reward: Stock can rise, but downside is protected.
Example: Own TCS at ₹3,000, buy 2,900 PE for ₹50.
Bull Call Spread
When to Use: Expect moderate rise.
Setup: Buy lower strike call + Sell higher strike call.
Risk: Limited.
Reward: Limited.
Example: Buy 20,000 CE @ ₹100, Sell 20,200 CE @ ₹50.
Bear Put Spread
When to Use: Expect moderate fall.
Setup: Buy higher strike put + Sell lower strike put.
Risk: Limited.
Reward: Limited.

Part 3 Learn Institutional TradingDirectional Strategies
These are for traders with a clear market view.
Long Call (Bullish)
When to Use: Expecting significant upward movement.
Setup: Buy a call option.
Risk: Limited to premium paid.
Reward: Unlimited.
Example: NIFTY at 20,000, you buy 20,100 CE for ₹100 premium. If NIFTY closes at 20,500, your profit = ₹400 - ₹100 = ₹300.
Long Put (Bearish)
When to Use: Expecting price drop.
Setup: Buy a put option.
Risk: Limited to premium.
Reward: Large if the asset falls.
Example: Stock at ₹500, buy 480 PE for ₹10. If stock drops to ₹450, profit = ₹30 - ₹10 = ₹20.
Covered Call (Mildly Bullish)
When to Use: Own the stock but expect limited upside.
Setup: Hold stock + Sell call option.
Risk: Stock downside risk.
Reward: Premium income + stock gains until strike price.
Example: Own Reliance at ₹2,500, sell 2,600 CE for ₹20 premium.

Technical Analysis Concepts1. Introduction to Technical Analysis
Technical Analysis (TA) is the study of market price action—primarily through charts—to forecast future price movements.
It’s built on the idea that “Price discounts everything”, meaning that all known information—economic data, company performance, market sentiment—is already reflected in the price.
In simpler words:
If you want to know what’s happening in a market, don’t just listen to the news—look at the chart.
Key Principles of Technical Analysis
There are three main pillars:
Price Discounts Everything
Every fundamental factor—earnings, interest rates, political events—is already reflected in price.
Traders believe price moves because of demand and supply changes that show up on charts before news does.
Price Moves in Trends
Markets rarely move in random zig-zags—they tend to trend:
Uptrend: Higher highs and higher lows
Downtrend: Lower highs and lower lows
Sideways: No clear direction
History Tends to Repeat Itself
Human psychology—fear, greed, hope—hasn’t changed over centuries. Chart patterns that worked 50 years ago often still work today.
2. Types of Technical Analysis
Broadly, TA can be split into:
A. Chart Analysis (Price Action)
Patterns, trendlines, support, resistance
Focuses purely on price movements
B. Indicator-Based Analysis
Uses mathematical formulas applied to price/volume
Examples: RSI, MACD, Moving Averages
C. Volume Analysis
Studies how much activity supports a price move
Strong moves with high volume = higher reliability
D. Market Structure Analysis
Understanding swing highs/lows, liquidity zones, and institutional footprints
3. Charts and Timeframes
Technical analysis starts with a chart. There are different chart types:
Line Chart – Simplest, connects closing prices. Good for a big-picture view.
Bar Chart – Shows open, high, low, close (OHLC).
Candlestick Chart – The most popular, visually intuitive for traders.
Timeframes
Choosing the right timeframe depends on your trading style:
Scalpers: 1-min to 5-min charts
Intraday Traders: 5-min to 15-min
Swing Traders: 1-hour to daily
Position Traders/Investors: Weekly to monthly
Rule of thumb:
Higher timeframes = stronger signals, but slower trades.
Lower timeframes = faster signals, but more noise.
4. Trends and Trendlines
A trend is simply the market’s general direction.
Types of Trends
Uptrend → Higher highs, higher lows
Downtrend → Lower highs, lower lows
Sideways (Range-bound) → Price moves within a horizontal band
Trendlines
A trendline is drawn by connecting at least two significant highs or lows.
In an uptrend: Connect swing lows
In a downtrend: Connect swing highs
They act as dynamic support or resistance.
5. Support and Resistance
Support: A price level where buying pressure is strong enough to halt a downtrend.
Resistance: A price level where selling pressure stops an uptrend.
How They Work
Support → Demand > Supply → Price bounces
Resistance → Supply > Demand → Price drops
Pro Tip: Once broken, support often becomes resistance and vice versa—this is called role reversal.
6. Chart Patterns
Chart patterns are visual formations on a chart that indicate potential market moves.
A. Continuation Patterns (Trend likely to continue)
Flags – Short pauses after sharp moves
Pennants – Small symmetrical triangles
Rectangles – Price consolidates between parallel support/resistance
B. Reversal Patterns (Trend likely to change)
Head and Shoulders – Signals a bearish reversal
Double Top/Bottom – Two failed attempts to break a high/low
Triple Top/Bottom – Similar to double but with three attempts
C. Bilateral Patterns (Either direction possible)
Triangles – Symmetrical, ascending, descending
7. Candlestick Patterns
Candlestick patterns are short-term signals of buying or selling pressure.
Bullish Patterns
Hammer – Long lower shadow, small body
Bullish Engulfing – Large bullish candle covers previous bearish candle
Morning Star – Three-candle reversal pattern
Bearish Patterns
Shooting Star – Long upper shadow
Bearish Engulfing – Large bearish candle covers prior bullish candle
Evening Star – Three-candle bearish reversal
8. Technical Indicators
Indicators help confirm price action or generate signals.
A. Trend Indicators
Moving Averages (SMA, EMA)
MACD – Measures momentum and trend changes
Parabolic SAR – Trailing stop tool
B. Momentum Indicators
RSI – Overbought (>70) / Oversold (<30) conditions
Stochastic Oscillator – Compares closing price to price range
CCI – Commodity Channel Index for momentum shifts
C. Volatility Indicators
Bollinger Bands – Show price deviation from average
ATR (Average True Range) – Measures volatility strength
D. Volume Indicators
OBV (On-Balance Volume) – Volume flow analysis
VWAP – Volume-weighted average price, used by institutions
9. Volume Profile and Market Structure
Volume Profile shows how much trading occurred at each price level, not just over time.
It highlights:
High Volume Nodes (HVN) → Strong price acceptance
Low Volume Nodes (LVN) → Price rejection zones
Market Structure is about identifying:
Higher highs / higher lows (uptrend)
Lower highs / lower lows (downtrend)
Liquidity pools (where stops are likely)
10. Dow Theory
Dow Theory is the grandfather of trend analysis.
Its principles:
Market discounts everything.
Market has three trends: Primary, secondary, minor.
Trends have three phases: Accumulation, public participation, distribution.
A trend is valid until a clear reversal occurs.
Conclusion
Technical analysis is not about predicting the future with 100% accuracy—it’s about improving probabilities.
A good TA trader:
Understands trends and patterns
Combines multiple tools for confirmation
Manages risk and keeps emotions in check
Remember:
TA gives you the edge, risk management keeps you in the game.

Institutional Intraday option Trading High Volume Trades: Institutions trade in huge lots, often influencing Open Interest.
Data-Driven Strategy: Backed by proprietary models, AI, and sentiment analysis.
Smart Order Flow: Institutions use algorithms to hide their positions using Iceberg Orders, Delta Neutral Strategies, and Volatility Skew.
⚙️ Tools & Indicators Used:
Option Chain Analysis
Open Interest (OI) & OI%
Put Call Ratio (PCR)
Implied Volatility (IV)
Max Pain Theory
Gamma Exposure (GEX)
🧠 Common Institutional Strategies:
Covered Calls – Generate income on large stock holdings.
Protective Puts – Hedge downside risk.
Iron Condor / Butterfly Spread – Capture premium with neutral view.
Long Straddle/Strangle – Expecting big move post-news.
Synthetic Longs/Shorts – Replicating stock exposure using options.

Institutional Option Trading, Investing, and TradingInstitutional trading and investing significantly differ from retail activities. Institutions trade in large volumes, use complex strategies, and have access to exclusive information and tools. This guide will provide a comprehensive overview of institutional option trading, investing, and general trading practices, detailing their methodologies, tools, and market impacts.
Understanding Institutional Investors
Institutional investors include mutual funds, hedge funds, pension funds, insurance companies, and large banks. These entities manage vast sums of money, often on behalf of others, and possess substantial market influence.
Key Characteristics:
Large Capital Base: Institutions trade in millions or billions.
Market Influence: Their trades can impact prices significantly.
Professional Resources: Access to cutting-edge research, proprietary algorithms, and high-speed trading platforms.

Put Call Ratio (PCR) Explained in Simple TermsWhat is PCR?
The Put-Call Ratio (PCR) is a popular market sentiment indicator used in option trading. It helps traders understand whether more people are buying put options (bearish bets) or call options (bullish bets) at a given time.
Put Options: Contracts betting the price will go down.
Call Options: Contracts betting the price will go up.
How to Read PCR?
PCR < 1: More call options → Bullish sentiment.
PCR > 1: More put options → Bearish sentiment.
PCR = 1: Neutral sentiment.
But extreme values often suggest the opposite:
Very High PCR: Possible market reversal upwards (too many bearish bets).
Very Low PCR: Possible market reversal downwards (too many bullish bets).
Example:
Put OI: 5,00,000 contracts
Call OI: 10,00,000 contracts
PCR = 5,00,000 / 10,00,000 = 0.5 → This indicates bullish sentiment.
Why PCR Matters?
Helps identify market mood (bullish or bearish).
Gives contrarian signals (overcrowded trades can reverse).
Used in option trading strategies for timing entry and exit.

Learn Institutional Option Trading Part-3In India, options are traded primarily on:
NSE (National Stock Exchange)
BSE (Bombay Stock Exchange)
The Securities and Exchange Board of India (SEBI) regulates the derivatives market and ensures fair practices.
Why is Option Trading Popular in India?
Leverage: Traders can control large positions with small capital.
Hedging: Investors use options to protect their portfolios from market fluctuations.
Income Generation: Strategies like covered calls can provide regular income.
Speculation: Traders can bet on price movements with limited risk.

Option Chain AnalysisTo read an options chart effectively, consider the following steps:
Identify the strike price associated with each line on the chart.
Observe the direction and steepness of the lines to gauge the options' delta values. ...
Assess the options' positions concerning the current market price of the underlying asset.

Basic to Advance in Trading Understand market trends and patterns.
Use risk management strategies, like setting stop-loss orders.
Focus on liquid assets with high volume.
Keep emotions in check and stick to a trading plan.
Limit the number of trades to manage risk.
Constantly educate yourself on market dynamics and trading strategies.

Class for Advanced Trader part 2To understand how to become a trader, follow these seven steps:
Complete your education. ...
Learning the basics of trading. ...
Determine the product in which you want to trade. ...
Develop trading techniques. ...
Gain trading experience. ...
Understand risk management. ...
Review your trades.

Class for Advanced Trader Advanced trading strategies usually involve multiple technical indicators and more complicated instruments, such as options and futures.

Put Call Ratio (PCR) Trading The Put Call Ratio (PCR) is a tool in the stock market to understand how investors feel about a stock or the market's future. It compares the number of put options to call options traded. More puts traded mean investors expect prices to fall (bearish). More calls traded mean investors expect prices to rise (bullish).

Divergence Test Divergence is when the asset price moves in the direction opposite to what a technical indicator indicates. When a stock is diverging, it signals weaker price trends and the beginning of a reversal.

Price Action Trading Price action trading is based on analyzing the raw movement of price over time without relying heavily on indicators. It involves picking out key levels, reviewing candlestick patterns, and recognizing reversal and continuation setups to capitalize on market opportunities.

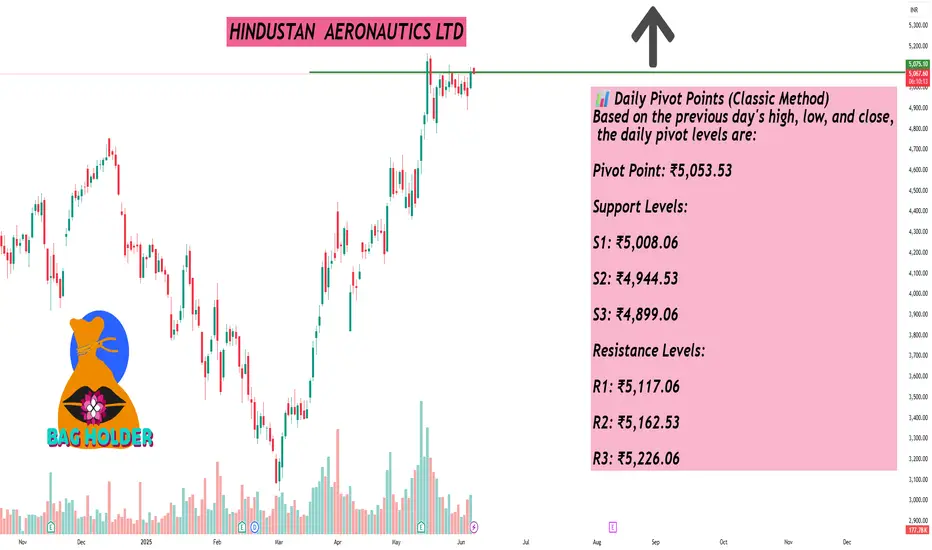
HINDUSTAN AERONAUTICS LTDAs of June 6, 2025, Hindustan Aeronautics Ltd. (NSE: HAL) is trading at approximately ₹5,071.60, reflecting a 2.25% increase over the previous day. Here's a detailed technical analysis focusing on daily support and resistance levels:
📊 Daily Pivot Points (Classic Method)
Based on the previous day's high, low, and close, the daily pivot levels are:
Pivot Point: ₹5,053.53
Support Levels:
S1: ₹5,008.06
S2: ₹4,944.53
S3: ₹4,899.06
Resistance Levels:
R1: ₹5,117.06
R2: ₹5,162.53
R3: ₹5,226.06
📈 Fibonacci Pivot Points
Using Fibonacci calculations, the levels are:
Pivot Point: ₹5,053.53
Support Levels:
S1: ₹5,011.90
S2: ₹4,986.17
S3: ₹4,944.53
Resistance Levels:
R1: ₹5,095.17
R2: ₹5,120.90
R3: ₹5,162.53
🔍 Camarilla Pivot Points
Derived using the Camarilla method:
Pivot Point: ₹5,053.53
Support Levels:
S1: ₹5,061.61
S2: ₹5,051.62
S3: ₹5,041.63
Resistance Levels:
R1: ₹5,081.59
R2: ₹5,091.58
R3: ₹5,101.58
📌 Trading Insights
Immediate Support: ₹5,008.06 (Classic S1)
Immediate Resistance: ₹5,117.06 (Classic R1)
Given the current price of ₹5,071.60, the stock is trading near its pivot point, suggesting potential for upward movement if it breaks above the immediate resistance. However, traders should monitor for any signs of reversal or consolidation around these levels.