Database Trading part 2Trading data is typically collected from stock exchanges such as the New York Stock Exchange (NYSE) or NASDAQ. This can be a useful source for trades that are made over the listed exchanges and can provide many different data poitns, such as trade prices and times.
HDFC

MACD ( Moving Average Convergence Divergence)MACD, which stands for Moving Average Convergence Divergence, is a technical indicator used in financial markets to identify potential trading opportunities and analyze price trends. It measures the relationship between two moving averages of a security's price. The MACD indicator is particularly useful for assessing momentum and determining potential trend reversals.

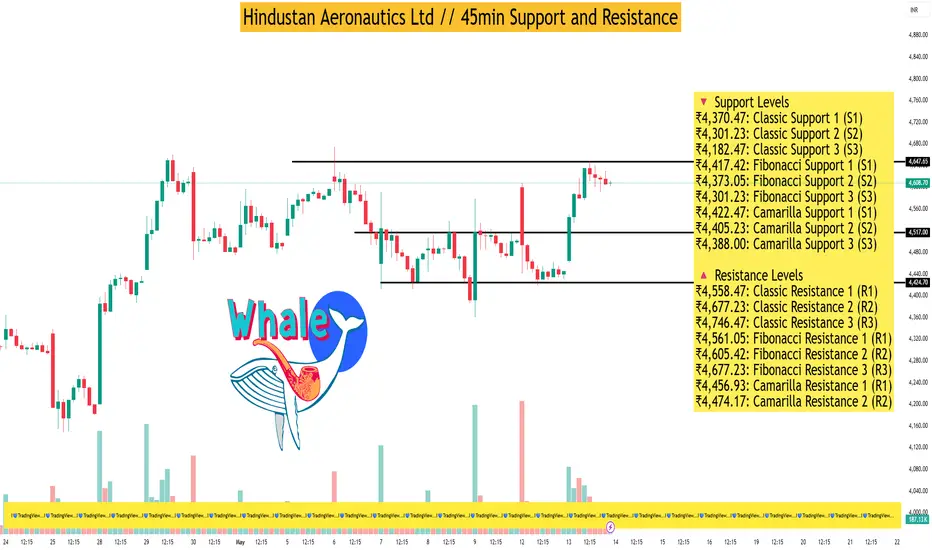
Hindustan Aeronautics Ltd // 45min Support and ResistanceAs of May 13, 2025, Hindustan Aeronautics Ltd (HAL) closed at ₹4,463.80, experiencing a slight decline of 0.668% for the day. Analyzing the 45-minute timeframe, the following support and resistance levels have been identified based on technical indicators and pivot point analyses:
🔻 Support Levels
₹4,370.47: Classic Support 1 (S1)
₹4,301.23: Classic Support 2 (S2)
₹4,182.47: Classic Support 3 (S3)
₹4,417.42: Fibonacci Support 1 (S1)
₹4,373.05: Fibonacci Support 2 (S2)
₹4,301.23: Fibonacci Support 3 (S3)
₹4,422.47: Camarilla Support 1 (S1)
₹4,405.23: Camarilla Support 2 (S2)
₹4,388.00: Camarilla Support 3 (S3)
🔺 Resistance Levels
₹4,558.47: Classic Resistance 1 (R1)
₹4,677.23: Classic Resistance 2 (R2)
₹4,746.47: Classic Resistance 3 (R3)
₹4,561.05: Fibonacci Resistance 1 (R1)
₹4,605.42: Fibonacci Resistance 2 (R2)
₹4,677.23: Fibonacci Resistance 3 (R3)
₹4,456.93: Camarilla Resistance 1 (R1)
₹4,474.17: Camarilla Resistance 2 (R2)
₹4,491.40: Camarilla Resistance 3 (R3)
📊 Technical Indicators Summary
Relative Strength Index (RSI): 44.65 – Neutral
MACD: -4.97 – Bearish
Average Directional Index (ADX): 20.58 – Indicates a weak trend
Stochastic Oscillator: 58.04 – Neutral
Rate of Change (ROC): 1.61 – Slightly bullish
Supertrend: ₹4,540.11 – Current trend indicator
Parabolic SAR (PSAR): ₹4,397.84 – Suggests potential reversal point
These indicators suggest a mildly bearish outlook in the short term, with the stock trading below key resistance levels. The RSI and Stochastic Oscillator indicate a neutral momentum, while the MACD points towards a bearish trend. The ADX value suggests that the current trend lacks strength.
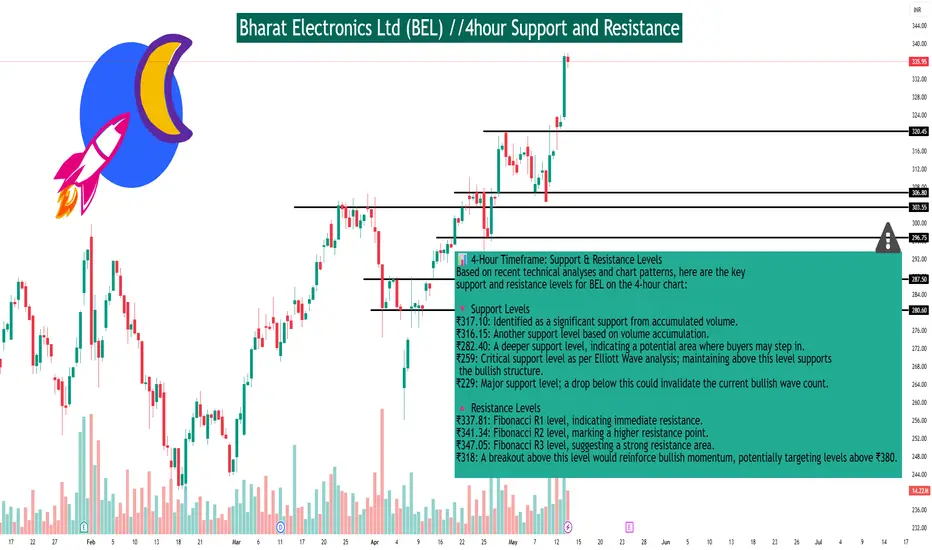
Bharat Electronics Ltd (BEL) //4hour Support and ResistanceAs of May 13, 2025, Bharat Electronics Ltd (NSE: BEL) closed at ₹335.75, reflecting a 4.21% gain for the day.
📊 4-Hour Timeframe: Support & Resistance Levels
Based on recent technical analyses and chart patterns, here are the key support and resistance levels for BEL on the 4-hour chart:
🔻 Support Levels
₹317.10: Identified as a significant support from accumulated volume.
₹316.15: Another support level based on volume accumulation.
₹282.40: A deeper support level, indicating a potential area where buyers may step in.
₹259: Critical support level as per Elliott Wave analysis; maintaining above this level supports the bullish structure.
₹229: Major support level; a drop below this could invalidate the current bullish wave count.
🔺 Resistance Levels
₹337.81: Fibonacci R1 level, indicating immediate resistance.
₹341.34: Fibonacci R2 level, marking a higher resistance point.
₹347.05: Fibonacci R3 level, suggesting a strong resistance area.
₹318: A breakout above this level would reinforce bullish momentum, potentially targeting levels above ₹380.
📈 Technical Outlook
BEL is currently in an upward trajectory within Minute Wave ((iii)) of Minor Wave 5, according to Elliott Wave analysis. To maintain this bullish structure, the price should stay above ₹259, with ₹229 being a critical support level. A breakout above ₹318 would confirm bullish control, with potential targets exceeding ₹380.
🔍 Additional Insights
Trend: The stock is in a strong rising trend in the short term, with expectations to rise 24.62% over the next 3 months, potentially reaching between ₹372.57 and ₹423.65.
Volatility: BEL has average daily movements with good trading volume, indicating medium risk.
Stop-Loss Recommendation: A suggested stop-loss is at ₹320.09, considering the medium daily movements and risk
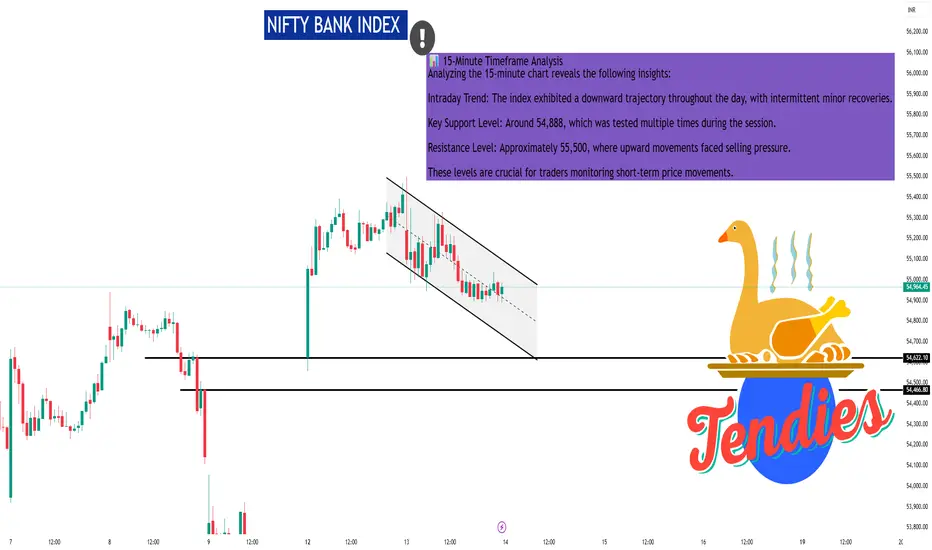
NIFTY BANK INDEX #NIFTYBANK Analysis (15-min Chart)
• Pattern: Falling Wedge () - Bullish reversal potential if breakout above resistance occurs.
• Resistance:
• 55,000 (psychological & upper wedge line)
• 55,400 - recent swing high
• Support:
54,800 wedge support zone
54,020 - previous gap-fill & demand zone
Note: Watch for volume spike & wedge breakout confirmation for long entry.
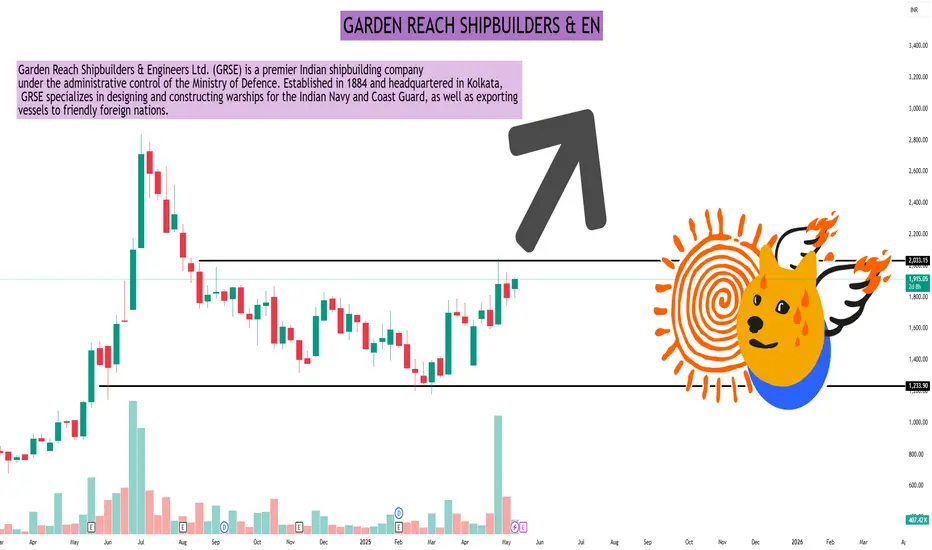
GARDEN REACH SHIPBUILDERS & ENBREAKOUT STOCK
Stock: Garden Reach Shipbuilders
Chart: weekly
Volatility in Range: *891 - *2833
+109.8% in 1-Year Returns
About the Company
Founded in 1934, GRSE is a key defense PSU engaged in:
• Warship & Naval Vessel Construction
• Diesel Engines & Ship Repair
Engineering Solutions for Indian Navy & Coast Guard
#GRSE
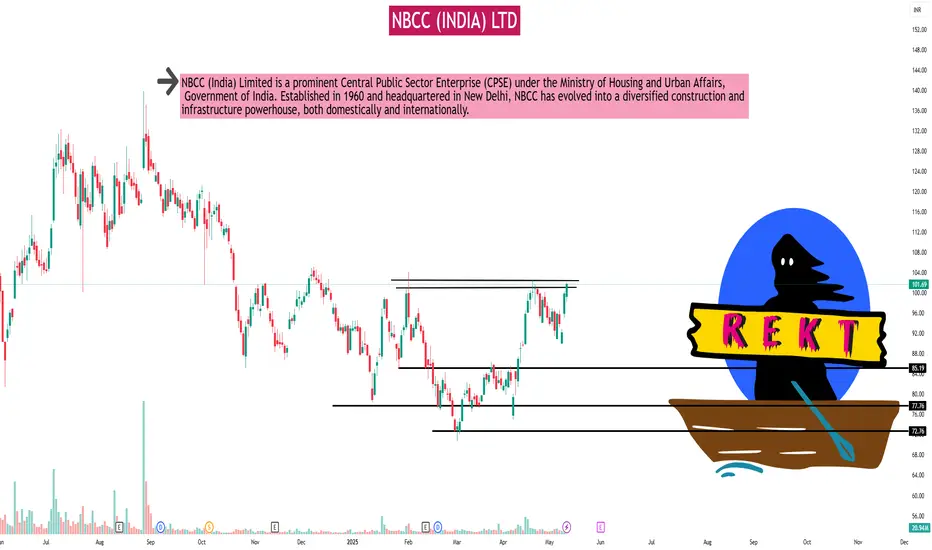
NBCC (INDIA) LTDAs of the close of trading on May 13, 2025, NBCC (India) Ltd. (NSE: NBCC) exhibited the following performance on the 1-day timeframe:
📊 NBCC (India) Ltd. – 1-Day Stock Performance
Closing Price: ₹101.69
Opening Price: ₹99.30
Day's Range: ₹98.32 – ₹102.10
Previous Close: ₹99.81
Daily Gain: +₹1.88 (+1.88%)
Volume: 20,939,670 shares traded
Average Traded Price (VWAP): ₹100.57
52-Week Range: ₹70.80 – ₹139.83
📈 Technical Overview
Trend: The stock is in an uptrend, closing higher for the second consecutive day.
Support Level: ₹98.00
Resistance Level: ₹102.10
Momentum: Positive, with a 1-day gain of nearly 2% and a 1-week gain of over 10%.
📅 Recent Developments
Order Acquisition: NBCC recently secured a ₹96 crore order, which is expected to positively influence investor sentiment.
📌 Key Metrics
Market Capitalization: ₹27,456 crore
P/E Ratio (TTM): 54.77
Dividend Yield: 0.62%
Book Value per Share: ₹8.93
Return on Equity (ROE): 24.8%
Debt-to-Equity Ratio: 0.00 (debt-free)
Option Trading : Options trading gives you the right or obligation to buy or sell a specific security on or by a specific date at a specific price. An option is a contract that's linked to an underlying asset, such as a stock or another security.

PCR (Put and Call Ratio) TradingThe Put-Call Ratio (PCR) is a technical indicator that measures the relative volume of put options to call options in a specific timeframe. It's used to gauge overall market sentiment, with a higher PCR indicating more bearish sentiment and a lower PCR suggesting more bullish sentiment.

Divergence based TradingDivergence occurs when the stochastic oscillator's peaks or troughs disagree with the price. For instance, if the stochastic makes lower highs while the price is rising, it indicates a bearish divergence. Likewise, higher stochastic lows against lower price lows indicate a bullish divergence

Institutional Trading part 6Institutional trading consists of the purchase and sale of financial assets by institutions through their traders. This definition of institutional trading applies to institutional equity trading, institutional stock trading, institutional options trading - any subcategory.

Institutional Trading part 1Institutional trading consists of the purchase and sale of financial assets by institutions through their traders. This definition of institutional trading applies to institutional equity trading, institutional stock trading, institutional options trading - any subcategory.

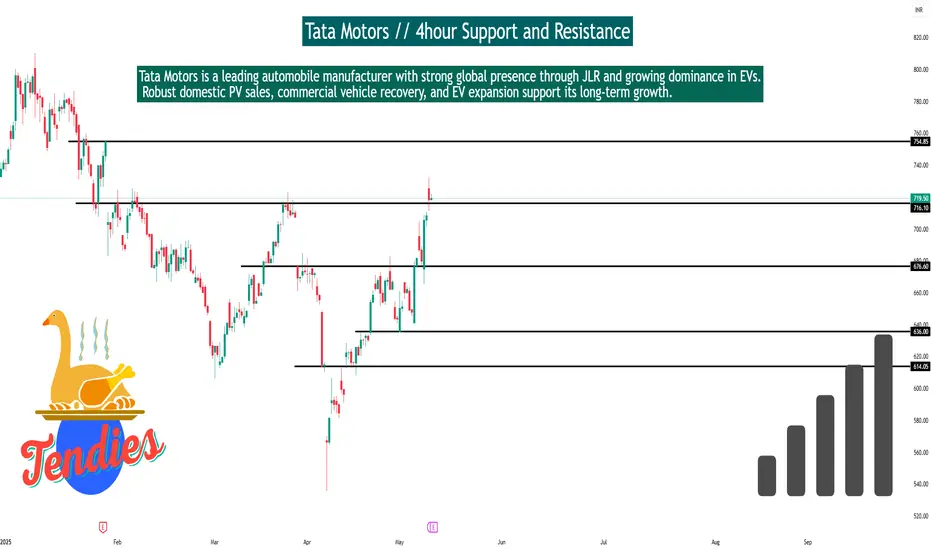
Tata Motors // 4hour Support and ResistanceTata Motors Futures – 4-Hour Timeframe Support & Resistance
Technical Structure:
Trend: Bullish with steady upward channel
Current Price: ~₹1,070
Support Levels:
₹1,045 – recent swing low
₹1,020 – 50-EMA zone & prior demand area
Resistance Levels:
₹1,085 – immediate resistance
₹1,110 – upper trendline & breakout zone
Outlook:
Holding above ₹1,045 keeps momentum positive. Break above ₹1,085 can fuel a rally toward ₹1,110+. Watch price action near support for intraday trade setups.
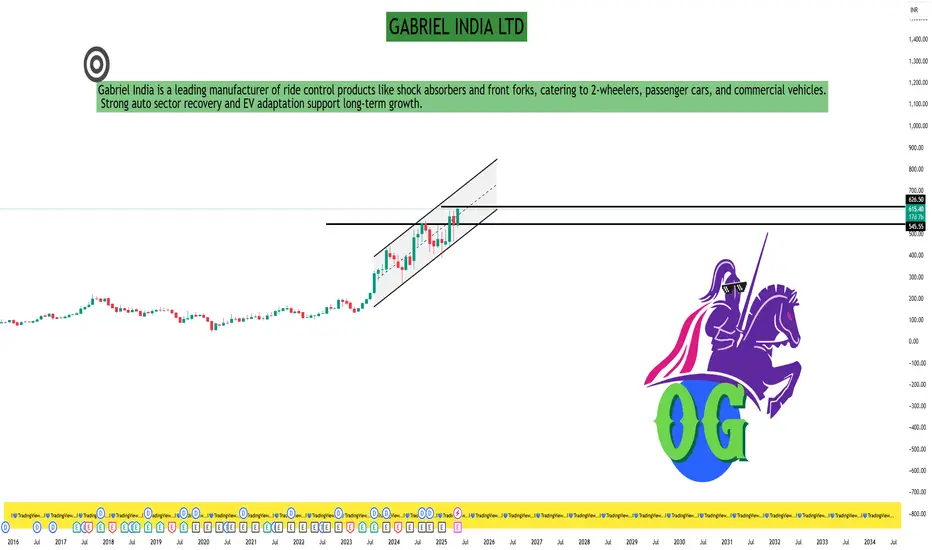
GABRIEL INDIA LTD#GABRIEL
Stock: Gabriel India Ltd
Hits new 52W high at ₹615.40 (+7.83%) today
Strong fundamentals with 77.2% YoY profit growth, 24.7% revenue growth, and high institutional interest.
Auto components leader with solid momentum and rising EPS.
▲ Slightly overvalued now, but great long-term potential in auto sector.
Watch for dips-this could be a gem for long-term investors!
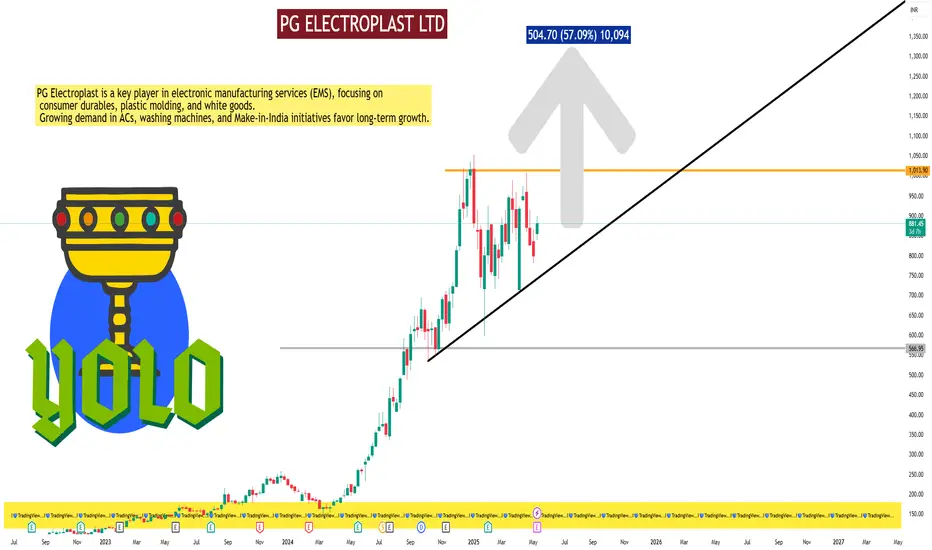
PG ELECTROPLAST LTD#PGEL
Stock: PG Electroplast Ltd
Strong Contender in EMS Space
Industry: Consumer Durables - Consumer Electronics
2 Current Price: *881
3 52W Low to High: 200 → 1,054
(+327%)
Recent Jump: +10.4% in 1 Day on High Volume
| 1-Year Target: 1,385 (Upside: 57%)
Fundamentals
Revenue Growth (YoY): 77%
Net Profit Growth (YoY): 113%
PEG Ratio: 0.8 (Undervalued Growth)
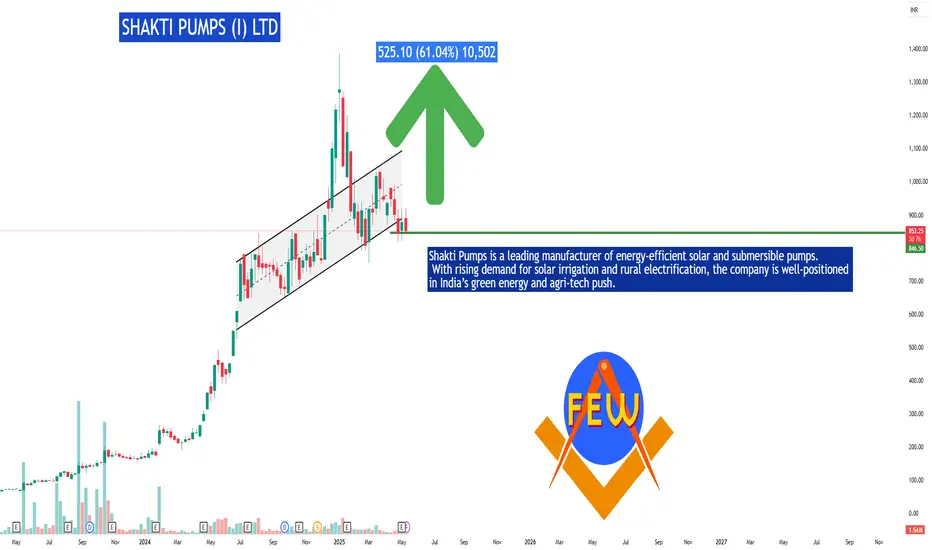
SHAKTI PUMPS (I) LTD #SHAKTIPUMP
Stock: Shakti Pumps (India)
Key Highlights:
CMP: *878.4
Target: 1,400 (61% Upside)
High-Growth Sector (Solar + Agri)
Attractive Valuation (P/E 25.9 vs peers)
Govt Policy Tailwinds (Renewable energy push)
Best for: Mid-term growth investors!
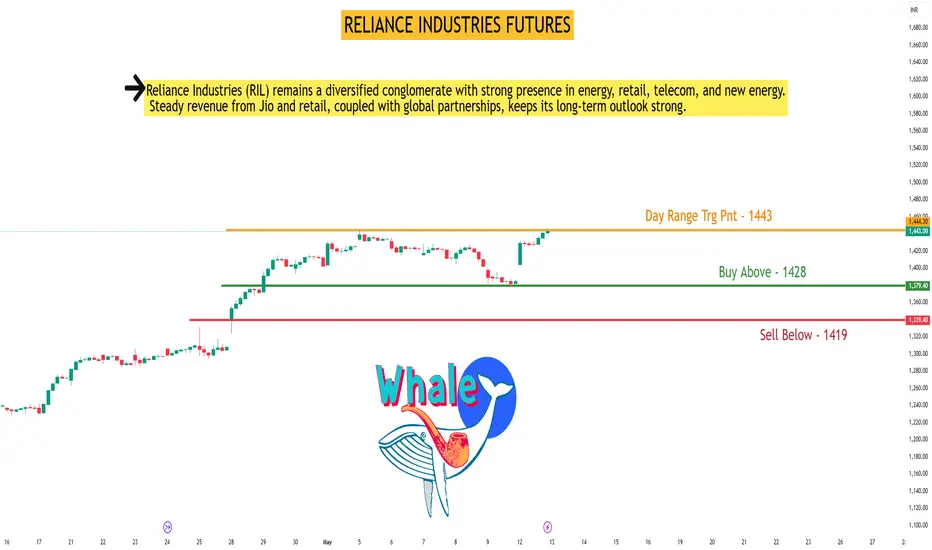
RELIANCE INDUSTRIES FUTURESRELIANCE Future Intraday Technical Analysis Date - 13-May-25 (Tuesday)
Day Range Trigger Point: 1443 | Expected Move: 41 pts
Buy Above: 1428
Average Buy Position: 1424
Target 1: 1468 |
Target 2: 1483
Stop-loss: 1415
Sell Below: 1419
Target 1: 1417 | Target 2: 1402
Stop-loss: 1432
Trading Strategy & Key Insights:
• Trade with structure confirmation and volume breakout strength. • Best Entry Timing:
✓ Before 10:30 AM or after 1:30 PM - Enter instantly on breakout.
✓ Between 10:30 AM to 1:30 PM - Prefer entries near SL zone.
? Respect stoploss & follow volume cues for validation.
Support and Resistance part 2The support and resistance (S&R) are specific price points on a chart expected to attract the maximum amount of either buying or selling. The support price is a price at which one can expect more buyers than sellers. Likewise, the resistance price is a price at which one can expect more sellers than buyers.

Advanced Trading part 2Advanced trading encompasses sophisticated strategies, tools, and techniques used by experienced traders to navigate complex financial markets and potentially generate higher returns. It involves a deeper understanding of market dynamics, risk management, and technical analysis beyond the basics.

Institutional Trading StrategiesInstitutional traders, including high-frequency trading (HFT) firms, hedge funds, proprietary trading firms, and buy-side institutions, leverage sophisticated strategies powered by algorithmic trading and API automation to gain an edge in financial markets.

MACD (Moving Average Convergence Divergence) part 2MACD, short for Moving Average Convergence Divergence, is a momentum indicator used in technical analysis to identify potential trend changes in a financial market. It's calculated by comparing two exponential moving averages (EMAs) and is represented by a line, a signal line (which is a moving average of the MACD line), and optionally a histogram.

Advanced Database TradingAdvanced Database Trading refers to the use of sophisticated database technologies and techniques in the context of financial markets and trading activities. This includes using specialized databases for real-time data analysis, algorithmic trading, and risk management, as well as leveraging data mining and advanced analytical tools to identify patterns and make informed trading decisions.

Financial MarketsFinancial markets are platforms where individuals, companies, and governments trade financial instruments like stocks, bonds, currencies, and derivatives. These markets facilitate the flow of capital, enabling businesses to raise funds, individuals to invest, and governments to manage their finances.
