Option and Database Trading Options data providers collect specific data points that can later be used to determine price movements over time. These price changes in the stock market help investors and brokers decide which stocks might be ideal to sell or buy given current market conditions.
HDFC

Institutional Trading part 5Institutional traders are defined as traders who engage in the buying and selling of securities for the accounts that they manage for any institution or a group of people. Some of the most common examples of institutional traders are mutual funds, pension funds, insurance companies, and exchange-traded funds. These institutional traders are capable of investing in securities that are generally not available for retail traders. These securities include both swaps and forwards

Divergence SecretsIn trading, divergence occurs when the price action of an asset moves in the opposite direction to what a technical indicator, such as a momentum oscillator, indicates. This discrepancy can signal a potential change in trend momentum or a possible reversal of the existing trend.

Institutional TradingInstitutional trading involves the buying and selling of financial assets, like stocks and bonds, by large financial institutions. These institutions, such as hedge funds, mutual funds, and pension funds, manage money on behalf of others and trade in significant volumes, potentially influencing market prices. They often require specialized services and technology to execute large trades.

Technical Trading AnalysisTechnical trading is a broader style that is not necessarily limited to trading. Generally, a technician uses historical patterns of trading data to predict what might happen to stocks in the future. This is the same method practiced by economists and meteorologists: looking to the past for insight into the future.

Divergence AnalysisDivergence in technical analysis occurs when the price of an asset moves in the opposite direction of a related technical indicator or oscillator. It signals that the momentum underlying the price trend is changing, which may foreshadow a potential shift in the trend's direction.

Nifty Index // 45minutes Support and ResistanceAs of the market close on May 9, 2025, the Nifty 50 index stood at 24,008.00, marking a decline of 265.80 points (-1.10%) for the day.
📊 Intraday Support & Resistance Levels (45-Minute Timeframe)
While specific 45-minute pivot points are not directly available, we can infer key intraday support and resistance levels based on recent market data:
Immediate Resistance Levels:
24,164.25: Recent day's high, acting as immediate resistance.
24,273.80: Previous closing value, serving as a resistance point.
24,500.00: A psychological resistance level observed in recent trading sessions.
Immediate Support Levels:
23,935.75: Recent day's low, acting as immediate support.
23,800.00: A key support zone identified in recent analyses.
23,500.00: A psychological support level observed in recent trading sessions.
🔍 Technical Indicators Summary
As per the latest technical analysis:
Relative Strength Index (RSI): 30.201 – Indicates a bearish condition.
Stochastic Oscillator (9,6): 97.279 – Suggests an overbought condition.
MACD (12,26): -105.46 – Indicates a bearish signal.
Average Directional Index (ADX): 47.759 – Suggests a strong trend.
Commodity Channel Index (CCI): -86.2237 – Indicates a bearish condition.
These indicators collectively suggest a bearish outlook for the Nifty 50 index in the short term.
📈 Trading Insights
Resistance Zone: The index faces resistance around the 24,164.25 to 24,273.80 range. A break above this zone could signal bullish momentum.
Support Zone: Support is observed around the 23,935.75 to 23,800.00 range. A breach below this zone may indicate further downside potential.
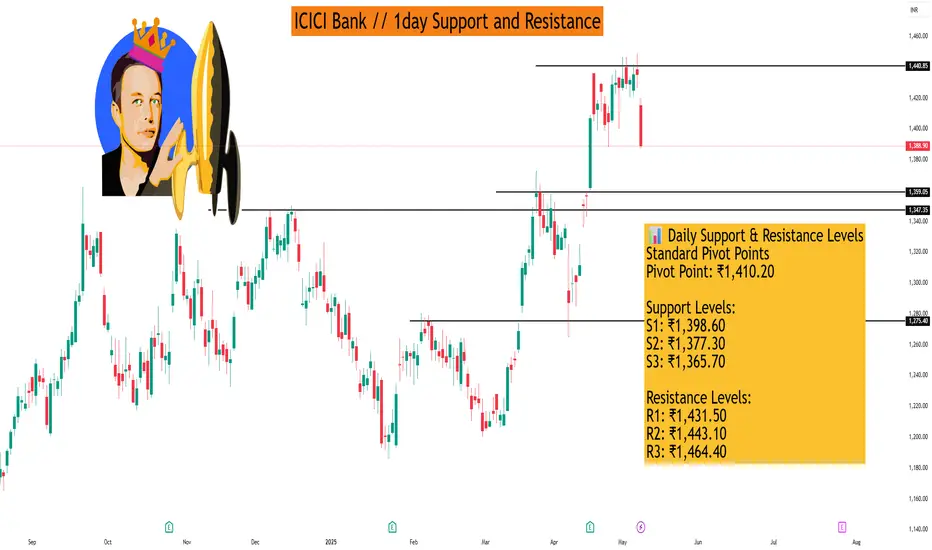
ICICI Bank // 1day Support and ResistanceAs of May 9, 2025, ICICI Bank Ltd. (NSE: ICICIBANK) closed at ₹1,388.90. Here are the key daily support and resistance levels based on various technical analyses:
📊 Daily Support & Resistance Levels
Standard Pivot Points
Pivot Point: ₹1,410.20
Support Levels:
S1: ₹1,398.60
S2: ₹1,377.30
S3: ₹1,365.70
Resistance Levels:
R1: ₹1,431.50
R2: ₹1,443.10
R3: ₹1,464.40
Fibonacci Levels
Pivot Point: ₹1,398.60
Support Levels:
S1: ₹1,386.03
S2: ₹1,378.27
S3: ₹1,365.70
Resistance Levels:
R1: ₹1,411.17
R2: ₹1,418.93
R3: ₹1,431.50
Camarilla Levels
Support Levels:
S1: ₹1,382.87
S2: ₹1,379.85
S3: ₹1,370.81
Resistance Levels:
R1: ₹1,394.93
R2: ₹1,397.95
R3: ₹1,407.00
Woodie's Levels
Pivot Point: ₹1,405.35
Support Levels:
S1: ₹1,396.18
S2: ₹1,372.45
Resistance Levels:
R1: ₹1,429.08
R2: ₹1,438.25
Demark Levels
Support Level:
S1: ₹1,371.50
Resistance Level:
R1: ₹1,404.40
🔍 Observations
The stock is currently trading below the Standard Pivot Point of ₹1,410.20, indicating potential bearish sentiment.
Immediate support is observed around ₹1,398.60 (Standard S1) and ₹1,386.03 (Fibonacci S1).
Resistance levels to watch include ₹1,411.17 (Fibonacci R1) and ₹1,431.50 (Standard R1).
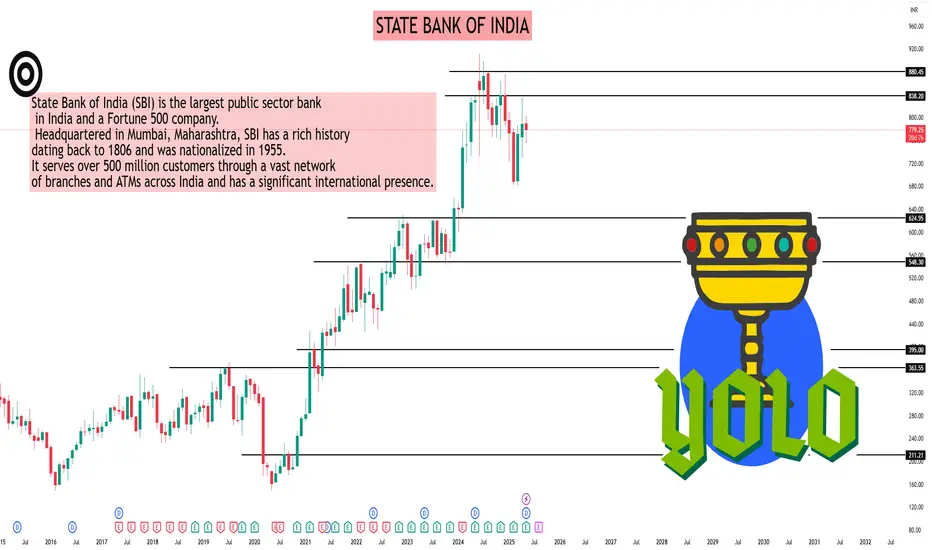
STATE BANK OF INDIAAs of May 9, 2025, State Bank of India (NSE: SBIN) closed at ₹779.25. Based on various technical analyses, here are the key monthly support and resistance levels for SBIN:
📊 Monthly Support & Resistance Levels (May 2025)
Standard Pivot Points
Pivot Point: ₹839.43
Support Levels:
S1: ₹784.72
S2: ₹733.93
S3: ₹679.22
Resistance Levels:
R1: ₹890.22
R2: ₹944.93
Fibonacci Levels
Pivot Point: ₹784.72
Support Levels:
S1: ₹744.42
S2: ₹719.52
S3: ₹679.22
Resistance Levels:
R1: ₹825.02
R2: ₹849.92
R3: ₹890.22
Camarilla Levels
Pivot Point: ₹784.72
Support Levels:
S1: ₹778.98
S2: ₹769.31
S3: ₹759.64
Resistance Levels:
R1: ₹798.32
R2: ₹807.99
R3: ₹817.66
Woodie's Levels
Pivot Point: ₹785.70
Support Levels:
S1: ₹735.90
S2: ₹680.20
Resistance Levels:
R1: ₹841.40
R2: ₹891.2
Demark Levels
Support Level:
S1: ₹759.33
Resistance Level:
R1: ₹864.83
🔍 Observations
The stock is currently trading near the Camarilla S1 level of ₹778.98, indicating potential support.
The Fibonacci Pivot Point at ₹784.72 may act as a resistance if the stock attempts to move upward.
Key support levels to monitor include ₹733.93 (Standard S2) and ₹719.52 (Fibonacci S2).
Resistance levels to watch are ₹825.02 (Fibonacci R1) and ₹841.40 (Woodie's R1).
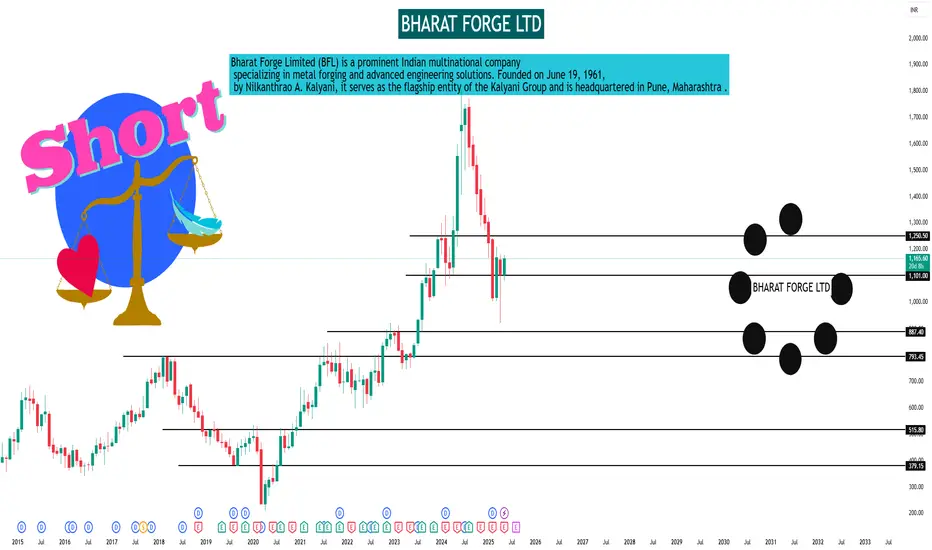
BHARAT FORGE LTDAs of May 9, 2025, Bharat Forge Ltd. (NSE: BHARATFORG) closed at ₹1,165.60. Below are the key monthly support and resistance levels based on various technical analyses:
📊 Monthly Support & Resistance Levels
Standard Pivot Points
Pivot Point: ₹1,215.77
Support Levels:
S1: ₹1,067.43
S2: ₹955.87
S3: ₹807.53
Resistance Levels:
R1: ₹1,327.33
R2: ₹1,475.67
Fibonacci Levels
Pivot Point: ₹1,067.43
Support Levels:
S1: ₹968.15
S2: ₹906.82
S3: ₹807.53
Resistance Levels:
R1: ₹1,166.72
R2: ₹1,228.05
R3: ₹1,327.33
Camarilla Levels
Pivot Point: ₹1,067.43
Support Levels:
S1: ₹1,080.38
S2: ₹1,056.55
S3: ₹1,032.73
Resistance Levels:
R1: ₹1,128.02
R2: ₹1,151.85
R3: ₹1,175.67
Woodie's Levels
Pivot Point: ₹1,076.62
Support Levels:
S1: ₹974.25
S2: ₹816.72
Resistance Levels:
R1: ₹1,234.15
R2: ₹1,336.52
Demark Levels
Pivot Point: ₹1,141.60
Support Level:
S1: ₹881.70
🔍 Observations
The stock is currently trading near the Fibonacci R1 level of ₹1,166.72, indicating potential resistance.
The Camarilla R2 level at ₹1,151.85 has recently been surpassed, suggesting bullish momentum.
Key support levels to monitor include ₹1,067.43 (Standard S1) and ₹1,056.55 (Camarilla S2).
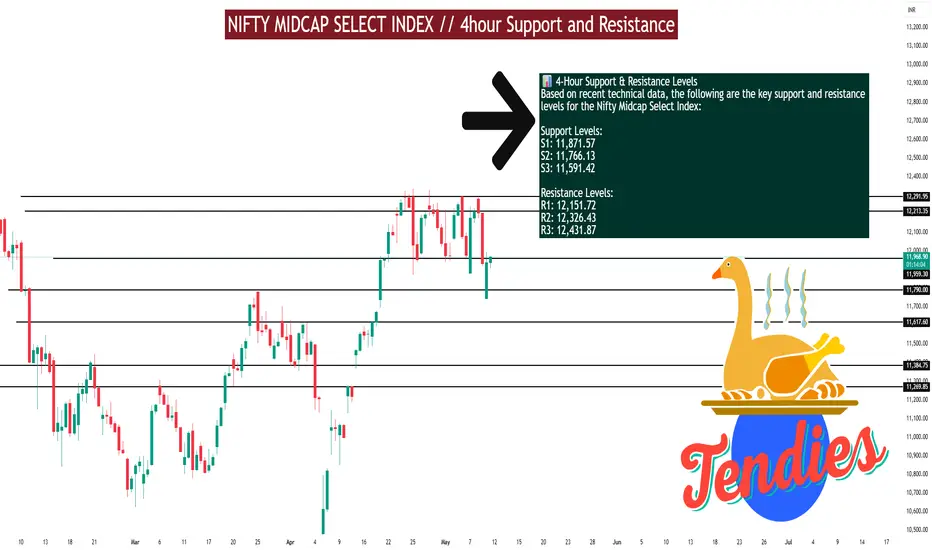
Nifty Midcap Select IndexAs of May 9, 2025, the Nifty Midcap Select Index is exhibiting a mildly bullish trend on the 4-hour timeframe, supported by various technical indicators and pivot point analyses.
📊 4-Hour Support & Resistance Levels
Based on recent technical data, the following are the key support and resistance levels for the Nifty Midcap Select Index:
Support Levels:
S1: 11,871.57
S2: 11,766.13
S3: 11,591.42
Resistance Levels:
R1: 12,151.72
R2: 12,326.43
R3: 12,431.87
🔍 Technical Indicators (4-Hour Timeframe)
Relative Strength Index (RSI): 74.96 – approaching overbought territory, suggesting potential for a short-term pullback.
Moving Average Convergence Divergence (MACD): 250.27 – indicates bullish momentum.
Average Directional Index (ADX): 25.11 – signifies a strengthening trend.
Stochastic Oscillator: 96.87 – overbought condition, caution advised.
Supertrend Indicator: Positioned at 11,824.56 – currently acting as a support level.
Parabolic SAR: 11,733.42 – below the current price, reinforcing the bullish stance.
📈 Trend Analysis
The index is trading above its 5-period and 15-period simple moving averages on the 4-hour chart, indicating a mild bullish crossover. This suggests continued upward momentum in the near term.
⚠️ Trading Insights
Bullish Scenario: A sustained move above 12,151.72 could open the path toward 12,326.43 and potentially 12,431.87.
Bearish Scenario: Failure to hold above 11,871.57 may lead to a retest of 11,766.13 or even 11,591.42.
NIFTY BANK INDEX Nifty Bank Index – 15-Minute Timeframe (As of May 9, 2025)
📌 Intraday Support & Resistance (15-min Chart):
🔻 Support Levels:
53,500 – Strong intraday support; multiple bounces seen here
53,200 – Minor support from morning session
52,900 – Gap-fill zone and previous demand area
🔺 Resistance Levels:
53,850 – VWAP + supply rejection area
54,200 – Key resistance from early session high
54,500 – Major barrier; breakdown retest level
📉 Intraday View: Trend remains weak below 54,200; bulls need a reclaim above 54,500 for momentum. Short-term scalpers should watch price action around VWAP (near 53,850).

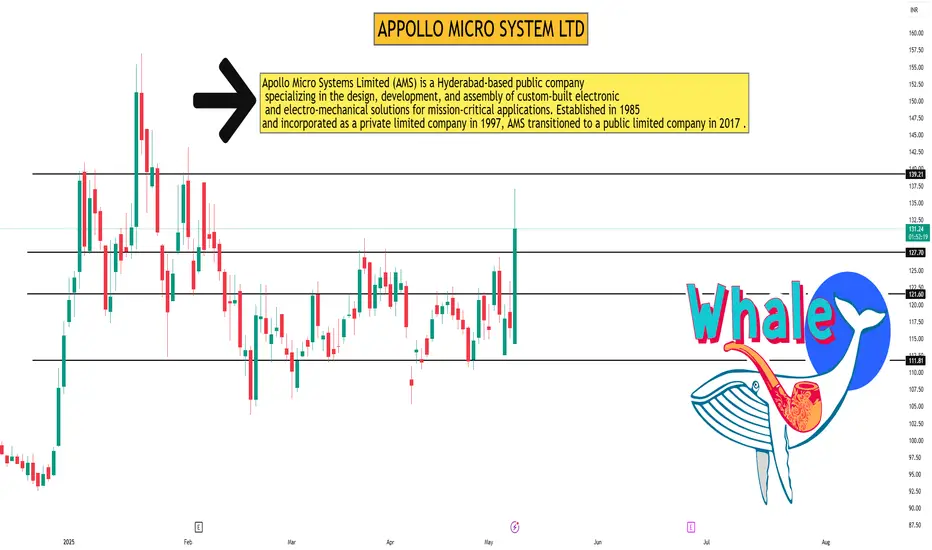
APPOLLO MICRO SYSTEM LTD Apollo Micro Systems Ltd – 1D Timeframe (As of May 9, 2025)
📌 Support & Resistance Levels (1-Day Chart Analysis):
Resistance Levels:
₹137.00 – Intraday high; strong near-term resistance
₹145.00 – Previous swing high and psychological level
₹157.00 – 52-week high, major resistance zone
Support Levels:
₹127.00 – VWAP zone; near-term intraday support
₹120.00 – Recent consolidation zone and demand area
₹114.30 – Today’s opening and previous base; key downside support
🔍 Technical Note: RSI is nearing overbought territory; price may consolidate below ₹137 unless a breakout is confirmed on high volume.
MACD Trading ( Moving Average Convergence/Divergence) The Moving Average Convergence/Divergence indicator is a momentum oscillator primarily used to trade trends. Although it is an oscillator, it is not typically used to identify over bought or oversold conditions. It appears on the chart as two lines which oscillate without boundaries.

How to Trade ? (Basic to Advance)Open a Demat account. The first step is to open a Demat account, which serves as a digital repository for your stocks. ...
Understand stock terms. ...
Bids and asks. ...
Fundamental and technical knowledge of stocks. ...
Learn to set stop loss orders. ...
Seek expert advice. ...
Start with safer stocks.

Institution TradingInstitutional trading refers to the buying and selling of financial assets by large organizations, like financial institutions, on behalf of their clients or members. These institutions manage large pools of capital and can significantly impact market prices and trends due to their size and trading volume. Unlike retail traders, institutional traders often have access to a wider range of investment opportunities and strategies.

Option Trading Options trading gives you the right or obligation to buy or sell a specific security on or by a specific date at a specific price. An option is a contract that's linked to an underlying asset, such as a stock or another security.

Advanced Trading part 2Advanced trading strategies usually involve multiple technical indicators and more complicated instruments, such as options and futures

Advanced Trading part 1Advanced trading encompasses a range of sophisticated techniques, strategies, and tools used by experienced traders to make informed decisions, manage risk, and capitalize on market opportunities. It involves a deeper understanding of market dynamics, technical analysis, and risk management principles, often utilizing complex instruments like options and futures.

Institutional Trading part 4Institutional traders buy and sell securities for accounts they manage for a group or institution. Retail traders buy or sell securities for personal accounts. Institutional traders usually trade larger sizes and can trade more exotic products.

Management and PsychologyMarket psychology is the study of herd behavior and sentiment among economic actors, such as businesses, traders, or consumers. By studying the prevalence of greed, fear, or euphoria in the market, skilled traders can forecast future price movements and fluctuations in supply and demand.

Divergence Based TradingDivergence occurs when the stochastic oscillator's peaks or troughs disagree with the price. For instance, if the stochastic makes lower highs while the price is rising, it indicates a bearish divergence. Likewise, higher stochastic lows against lower price lows indicate a bullish divergence.

Support and Resistance'Support' and 'resistance' are terms for two respective levels on a price chart that appear to limit the market's range of movement. The support level is where the price regularly stops falling and bounces back up, while the resistance level is where the price normally stops rising and dips back down.
