RSI DivergenceRSI divergence occurs when the price of an asset and the RSI indicator move in opposite directions. This can signal a potential trend reversal or a weakening of the current trend. There are two main types: bearish and bullish divergence.
HDFC

What is MACD ?MACD, or Moving Average Convergence Divergence, is a momentum indicator used in technical analysis to identify changes in the strength, direction, and duration of a trend. It's calculated by finding the difference between two exponential moving averages (EMAs) and then comparing that difference to its own EMA, according to Investopedia.

Bajaj Finance LTD // 1hour Support and ResistanceAs of April 28, 2025, Bajaj Finance Ltd (NSE: BAJFINANCE) is trading at ₹8,731.60. Based on the latest technical analysis, here are the key support and resistance levels for the 1-hour timeframe:
📊 1-Hour Support and Resistance Levels
Immediate Support (S1): ₹8,744.55
Immediate Resistance (R1): ₹9,002.55
These levels are derived from recent market data and technical analysis. Movements beyond these points may indicate potential changes in the stock's trend.
🔍 Technical Indicators
20 EMA (Exponential Moving Average): ₹8,393.26
50 EMA: ₹8,381.46
Signal: Strong Bearish
The 1-hour chart indicates a strong bearish trend, as both the 20 EMA and 50 EMA are trending downward. This suggests potential selling pressure in the short term.
⚠️ Important Notes
Breakout Above Resistance: If the stock price breaks above ₹9,002.55, it may signal a bullish trend.
Breakdown Below Support: A drop below ₹8,744.55 could indicate further downside potential.
Please note that technical analysis is subject to change based on market conditions. It's advisable to monitor the stock closely and consider consulting with a financial advisor before making any trading decisions.

AXIS BANK LTDAXIS BANK LTD-1W.NSE
Vol
Good chart structure
After a big breakout in previous week, stock has shown a profit booking from higher levels
If it closes above 1185-1200 levels, then more up move is possible
Entry Above 1200
Target 1270/1340
Stop loss 1120

ACC LTDACC LTD:-
As of April 28, 2025, ACC Ltd (NSE: ACC) is trading at ₹2,327.85. Based on recent technical analysis, here are the key intraday support and resistance levels for a 15-minute chart timeframe:
📉 Support Levels (15-Minute Chart)
Support 1 (S1): ₹2,316.93
Support 2 (S2): ₹2,306.02
Support 3 (S3): ₹2,294.98
These levels are derived from recent pivot point calculations and may act as potential entry points or stop-loss levels for short trades.
📈 Resistance Levels (15-Minute Chart)
Resistance 1 (R1): ₹2,327.97
Resistance 2 (R2): ₹2,338.88
Resistance 3 (R3): ₹2,349.92
These resistance levels are based on recent pivot point calculations and can serve as potential targets for long trades or areas to watch for price reversals.
🔍 Technical Indicators (15-Minute Chart)
EMA (5): ₹2,310.56 (Bullish)
EMA (10): ₹2,309.98 (Neutral)
EMA (15): ₹2,310.18 (Bullish)
EMA (20): ₹2,310.68 (Mild Bullish)
EMA (50): ₹2,319.19 (Mild Bearish)
The shorter-term EMAs (5, 10, and 15) indicate a bullish trend, suggesting upward momentum. However, the 50-period EMA shows a mild bearish trend, indicating potential resistance at higher levels.
⚠️ Important Notes
Market Conditions: The stock market is influenced by various factors, including economic data, corporate earnings, and global events. It's essential to stay informed about these factors when making trading decisions.
Risk Management: Always use proper risk management techniques, such as setting stop-loss orders and only risking a small percentage of your trading capital on each trade.
Consult Professionals: Consider consulting with a financial advisor or conducting further research before making any trading decisions.

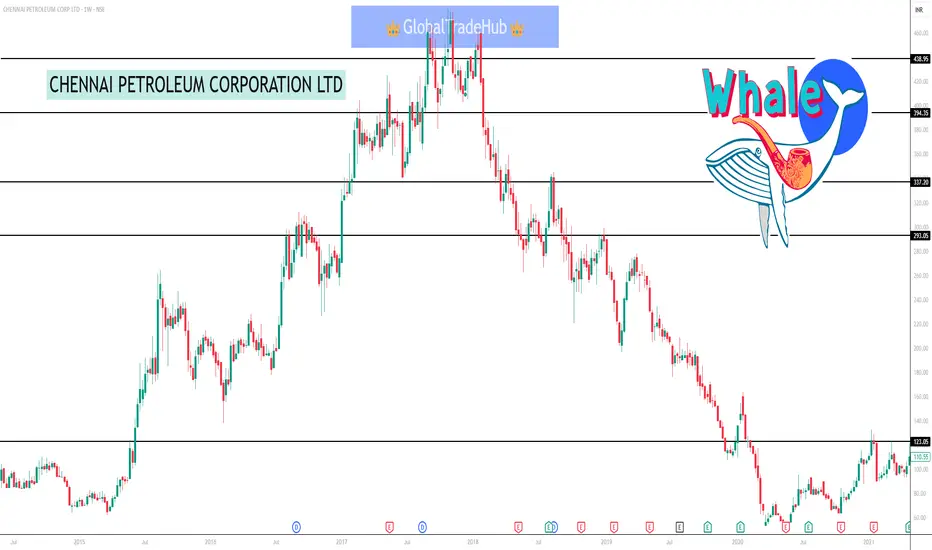
CHENNAI PETROLEUM CORPORATION LTD#CHENNPETRO
Weekly Time Frame Technical Analysis for Chennai Petroleum (CHENNPETRO) Potential Bullish Scenario:
If the bullish engulfing candle is confirmed with subsequent positive price action, the stock could see an upward move.
A break above the recent high around ₹670-1680 could signal further bullish momentum.
Potential Bearish Scenario:
Failure to sustain above the rising support trendline could lead to further downside.
Strong resistance might be encountered at higher levels, potentially limiting the upside.
Buy & Sell Setup (Weekly Time Frame):
Buy Setup:
Entry: Consider entering in the range of 2530 - ₹570, as suggested by some analysts, especially if there is confirmation of the bullish reversal.
Alternatively, a more conservative entry could be considered on a sustained break above ₹680. Targets:
Target 1: *650 - ₹670 (Short-term)
Target 2: *750 - ₹780 (Medium-term)
Target 3: *850+ (Medium to Long-term)
Stop Loss: Place a stop loss below the recent low or around 433 to manage risk, as suggested by some analyses. A slightly tighter stop loss could be considered based on your risk tolerance, potentially below a key weekly support level.
Sell Setup:
Entry: Consider a short position if the price breaks down decisively below the
rising support trendline, especially
Increased volume.
Targets: Potential targets could be previous support levels, such as ₹500, 450, and the recent low of *433.
Stop Loss: Place a stop loss above the breakdown level or a recent swing high to limit potential losses.
Important Considerations:
Potential Buy Setup Box:
Entry Zone: *580 - ₹635
This zone encompasses the current price action and the recent bullish engulfing candle. Entering within this range assumes the bullish momentum will continue. Target 1: *670 - ₹680 (Previous swing high, potential initial resistance)
Target 2: *750 - ₹780 (Medium-term target based on Fibonacci levels and previous price action)
Stop Loss: Below *530
This level provides a buffer below the recent low and the potential support trendline. A break below this could negate the immediate bullish scenario.
Potential Sell Setup Box:
Entry Zone: *670-2700
This zone represents a potential area of resistance based on the previous swing high. Shorting within this range assumes a failure to break above this level.
Target 1: *635 - *610 (Initial support level)
Target 2: *580 - ₹550 (Further support zone)
Stop Loss: Above *720
This level provides protection against a potential breakout above the resistance zone.
Visual Representation (Conceptual):
Potential Buy Setup:
Entry Zone: *580-2635
Target 1: 2670-680
Target 1: 670 - ₹680 Target 2: *750 - ₹780
Stop Loss: Below *530
Potential Sell Setup:
Entry Zone: *670 - ₹700
Target 1: *635-610
Target 2: 580-2550
Stop Loss: Above *720
This Analysis for only education purpose & learning
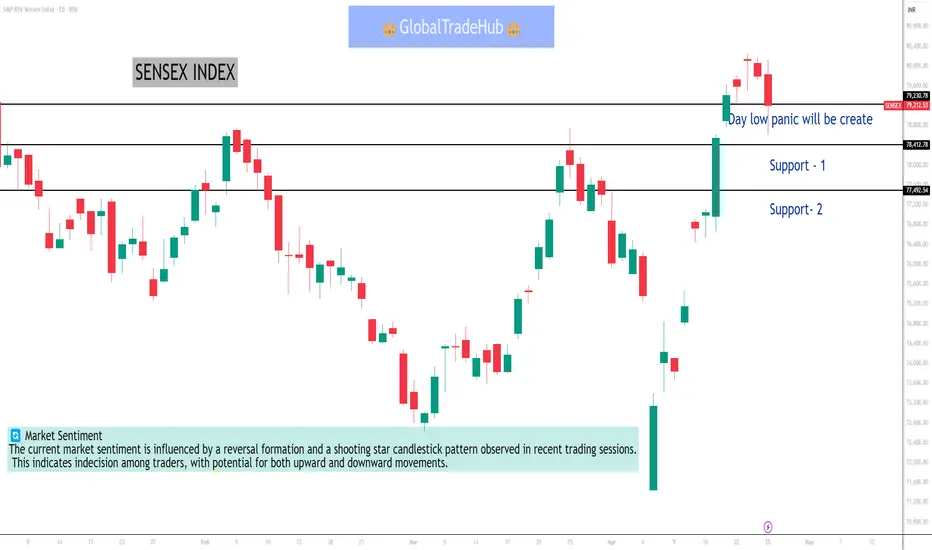
Sensex index Sensex index :-
As of April 28, 2025, the BSE Sensex is exhibiting a neutral to slightly bearish short-term trend. Technical indicators suggest that the index is trading within a defined range, with key support and resistance levels to watch for intraday trading.
📉 Support Levels
Immediate Support: Approximately 75,847
Secondary Support: Around 75,555
Tertiary Support: Near 75,096
These levels are derived from pivot point calculations based on the previous day's trading range. A breach below these supports could indicate further downside potential.
📈 Resistance Levels
Immediate Resistance: Approximately 77,349
Secondary Resistance: Around 77,057
Tertiary Resistance: Near 76,765
These resistance levels are also based on pivot point analysis. A breakout above these levels could signal a potential upward movement.
🔄 Market Sentiment
The current market sentiment is influenced by a reversal formation and a shooting star candlestick pattern observed in recent trading sessions. This indicates indecision among traders, with potential for both upward and downward movements.
Database Trading part 3InfluxDB is a high-performance, purpose-built time-series database designed for real-time analytics. It boasts low-latency writes, efficient storage, and a powerful query engine tailored for event-driven systems like algorithmic trading.

Advanced Database TradingAdvanced database systems are crucial in modern finance, particularly for trading, offering functionalities beyond standard relational database management systems. They provide tools for real-time data analysis, efficient storage, and low-latency writes, enabling algorithmic trading and other complex operations.

Option and Database TradingOption type: The options chain segregates call options, which allow you to buy TIL shares, and put options, which grant you the right to sell them. Bid and ask prices: Each option contract at a specific strike price and expiration date comes with bid and ask prices. For example, a call option with a strike price of Rs.

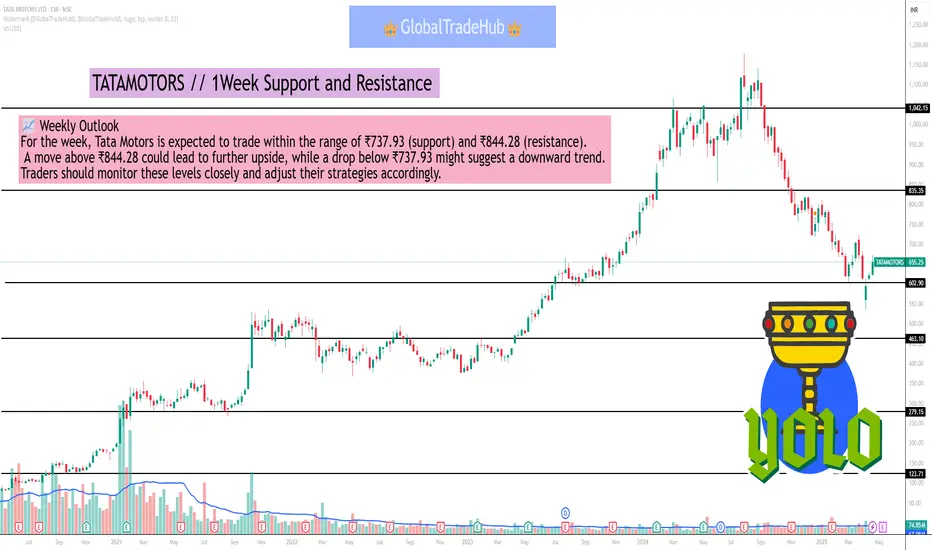
TATAMOTORS // 1Week Support and Resistance As of the latest available data, here are the key support and resistance levels for Tata Motors Ltd. (TATAMOTORS) for the upcoming week:
📊 Weekly Support and Resistance Levels
Type Level Value (₹)
Support S1 773.38
S2 756.47
S3 737.93
Resistance R1 808.83
R2 827.37
R3 844.28
These levels are derived from technical analysis and serve as potential entry, exit, or stop-loss points for traders. A breach below the support levels could indicate a bearish trend, while a breakout above the resistance levels may signal a bullish move.
🔍 Technical Indicators Overview
RSI (14): 43.38 — Indicates neutral momentum.
MACD (12,26): 0 — Suggests a neutral trend.
Moving Averages:
20-day SMA: 655.61 — Slightly below current price, indicating a potential short-term downtrend.
50-day SMA: 655.34 — Aligns with the 20-day SMA, reinforcing the neutral to bearish outlook.
200-day SMA: 655.93 — Further confirms the downtrend.
📈 Weekly Outlook
For the week, Tata Motors is expected to trade within the range of ₹737.93 (support) and ₹844.28 (resistance). A move above ₹844.28 could lead to further upside, while a drop below ₹737.93 might suggest a downward trend. Traders should monitor these levels closely and adjust their strategies accordingly.
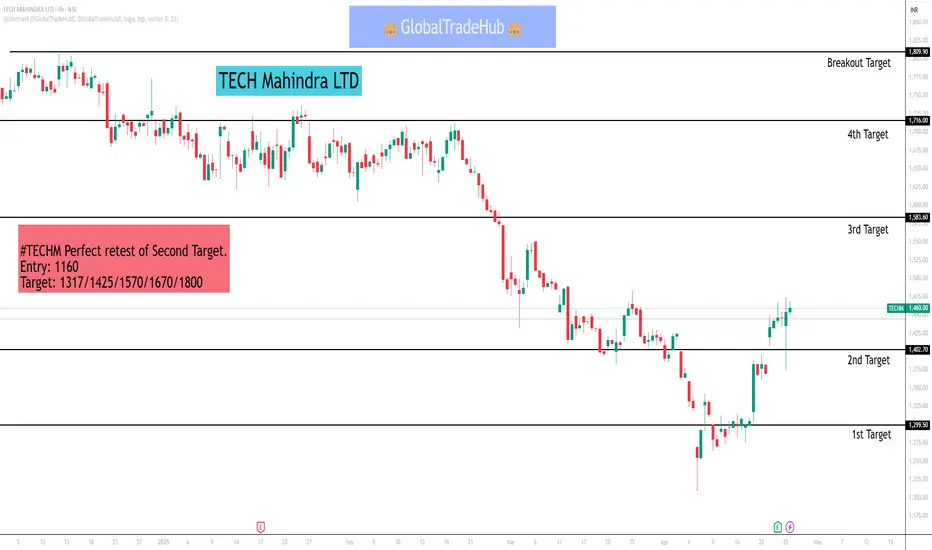
TECH Mahindra LTD
#TECHM Perfect retest of Second Target.
Entry: 1160
Target: 1317/1425/1570/1670/1800
Here are the key 4-hour support and resistance levels for Tech Mahindra Ltd. (TECHM) based on recent technical data:
🔹 4-Hour Support Levels
S1: ₹1,589.75
S2: ₹1,575.45
S3: ₹1,554.75
If the price falls below ₹1,589.75, the next support levels to watch are ₹1,575.45 and ₹1,554.75.
🔸 4-Hour Resistance Levels
R1: ₹1,624.75
R2: ₹1,645.45
R3: ₹1,659.75
If the price rises above ₹1,624.75, the next resistance levels are ₹1,645.45 and ₹1,659.75.
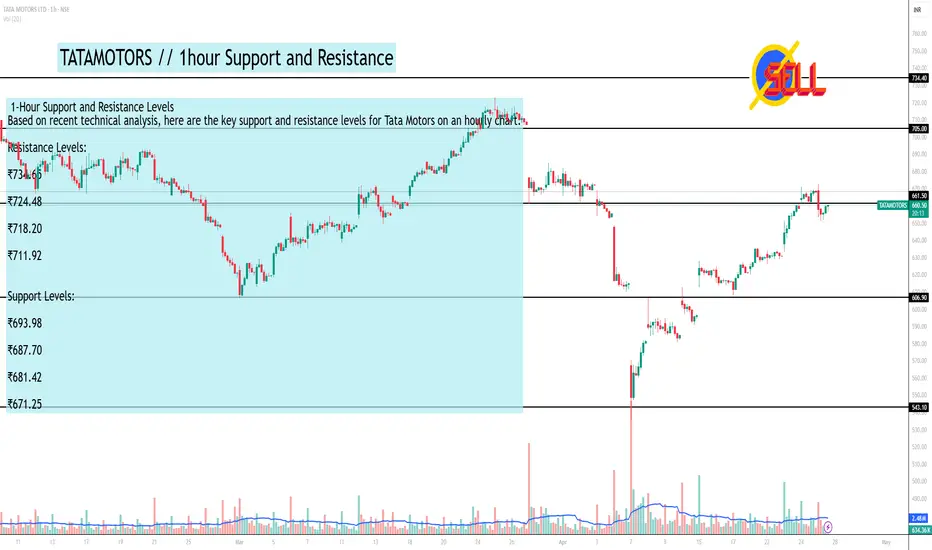
TATAMOTORS // 1hour Support and ResistanceAs of April 25, 2025, Tata Motors (NSE: TATAMOTORS) has experienced a significant intraday surge, reaching ₹606.45, up over 4% from its previous close of ₹582.90. This uptick is attributed to positive sentiment in the auto sector and broader market optimism.
📈 1-Hour Support and Resistance Levels
Based on recent technical analysis, here are the key support and resistance levels for Tata Motors on an hourly chart:
Resistance Levels:
₹734.65
₹724.48
₹718.20
₹711.92
Support Levels:
₹693.98
₹687.70
₹681.42
₹671.25
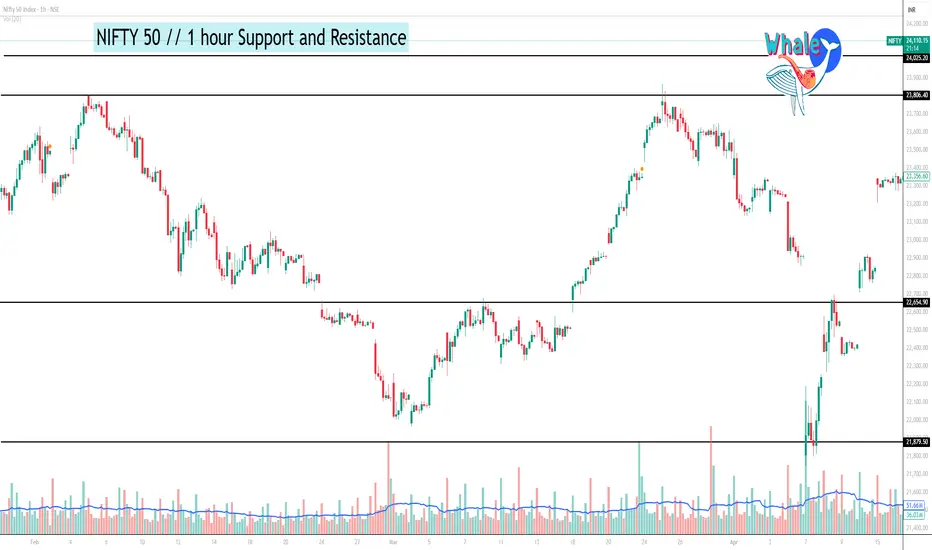
NIFTY 50 1 hour support and resistanceNifty Update
Current Price: 24,150
Nifty crossed 24,300, hitting a high of 24,365 - same as the day before yesterday's open.
Yesterday, it retested this key resistance but failed to sustain.
If Nifty reclaims and sustains above 24,300, it may attempt to break 24,365.
A breakout above that level can lead to an up move towards 24,442-24550.
Key Levels:
Support: 24,100-24000
Resistance: 24,300
#Nifty50 #StockMarket #NSE #TechnicalAnalysis
#KOTHARIPETRO SWING TRADE
#KOTHARIPETRO SWING TRADE
HORIZONTAL RANGE BREAKOUT
ENTRY - 170.50
SL - 160
Targets - 181/195/210+
Swing trading is a speculative trading strategy in financial markets where a tradable asset is held for one or more days in an effort to profit from price changes or 'swings'.

How we trade in option chain ?To trade using an option chain, you first need to understand its structure and the information it provides. Option chains are organized by strike prices, expiration dates, and whether they are call or put options. You then decide whether to buy (long) or sell (short) a particular option contract, specifying the strike price, expiration date, and quantity. Finally, you submit your order through your brokerage platform.

Candlesticks Pattern Part 2A bullish candlestick is typically green or white and means the closing price is higher than the opening price, indicating upward momentum. Inversely, a bearish candlestick, generally red or black, signals that the closing price was lower than the opening price, reflecting downward pressure.

Candlesticks PatternCandlestick patterns are a visual representation of price movements over time, used in technical analysis to identify potential trends and market sentiment. They provide insights into the daily price action of a financial asset, including its open, high, low, and closing prices. These patterns can suggest whether the market is likely to continue trending or if a shift in direction is on the horizon.

RSI and RSI DivergenceRSI: Divergence appears when the RSI's highs or lows diverge from price. For example, if the price makes new lows but the RSI bottoms at higher levels, it signals bullish divergence; if the price makes new highs but the RSI peaks at lower levels, it signals bearish divergence.

Banks in focus, chart: 2 HDFCChart -> SBI Daily
All time high breakout with run-away gap.
CMP: 1906
Good Range to Buy: 1920 to 1880
Targets: 1985, 2036
SL: 1855 Daily Close
Disclaimer: This is for educational purposes only, not any recommendations to buy or sell. As I am not SEBI registered, please consult your financial advisor before taking any action.

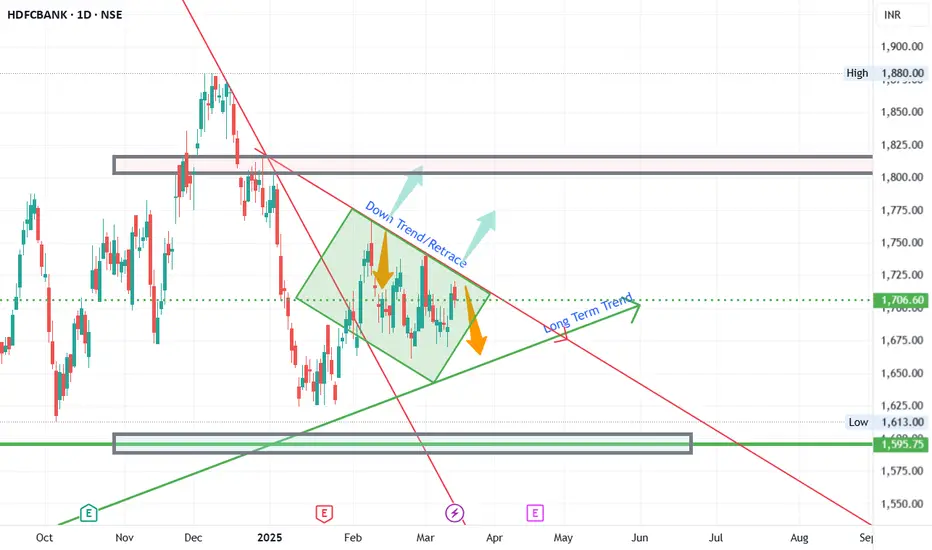
HDFC Bank - Long Term AnalysisFundamentals/Basis:
HDFC Bank is an important scrip that need to be monitored on long term basis, if we invest or not.
This is due to the fact, as a leader in the banking industry and a heavy weight company in the Nifty and bank nifty constituencies, HDFC bank provides clues to the overall market direction (most of the times)
This analysis is for Long term and if time permits, will keep updating throughout the year.
Technicals :
HDFC bank fell from its highs since end of 24 until jan. And had a retracement until approximately 1770 and formed a retracement trend direction.
Current range : 1600 to 1800 with 1700s as pivots.(Not formula but based on charts)
Trade Ideas :
If the price moves above the retracement line and sustains, go for long in the stock. Once it breaks lookout for confirmation at this trendline and also at the Long term trendlines for any retests.
Alternatively, if the price falls below the Long term trend direction, wait for confirmation on the bullishness.
Disclaimer : All the views and analysis provided are my personal analysis. Not a SEBI registered analyst. Plan and trade as per your analysis
If you Like the Analysis and agree with , Hit the Boost button and share your views agreements/constructive feedback in the comments.
Would you like me provide any of your favorite stocks analysis, let me know in the comment.
Lecture For Option Trader or Intraday TraderIntraday trading, also known as day trading, means buying and selling stocks on the same day to profit from price changes. Traders need to close their trades before the market closes. If not, the broker might automatically close them or turn them into regular trades.
Yes, profits from intraday trading are considered business income and taxed according to your income tax slab. How is intraday trading taxed? Intraday trading profits are treated as short-term capital gains, added to taxable income, and taxed based on applicable slab rates.

HDFC BANK Is near to it's Major support level on 2 Hr TimeframeHDFC BANK Is near to it's Major support level on 2 Hr Timeframe.
If it breaks this level then stock will show bearish movement and it it takes support from this level then it shows upward, bullish movement.
Keep eye on It.
