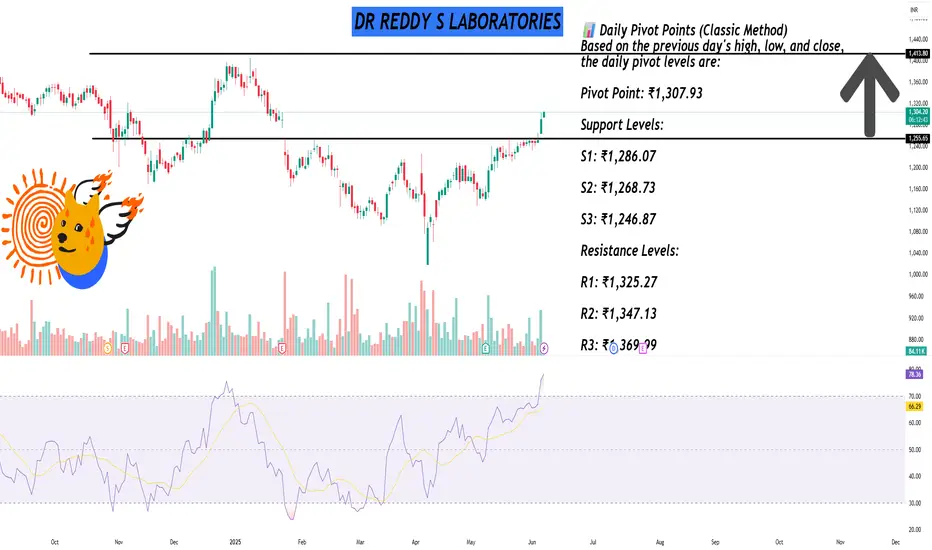
DR REDDY S LABORATORIESAs of June 6, 2025, Dr. Reddy's Laboratories Ltd. (NSE: DRREDDY) is trading at approximately ₹1,290.60, reflecting a 3.04% increase over the previous day.
📊 Daily Pivot Points (Classic Method)
Based on the previous day's high, low, and close, the daily pivot levels are:
Pivot Point: ₹1,307.93
Support Levels:
S1: ₹1,286.07
S2: ₹1,268.73
S3: ₹1,246.87
Resistance Levels:
R1: ₹1,325.27
R2: ₹1,347.13
R3: ₹1,369.99
📈 Fibonacci Pivot Points
Using Fibonacci calculations, the levels are:
Pivot Point: ₹1,307.93
Support Levels:
S1: ₹1,286.07
S2: ₹1,268.73
S3: ₹1,246.87
Resistance Levels:
R1: ₹1,325.27
R2: ₹1,347.13
R3: ₹1,369.99
🔍 Camarilla Pivot Points
Derived using the Camarilla method:
Pivot Point: ₹1,286.07
Support Levels:
S1: ₹1,269.04
S2: ₹1,279.82
S3: ₹1,283.41
Resistance Levels:
R1: ₹1,294.19
R2: ₹1,297.79
R3: ₹1,301.38
📌 Trading Insights
Immediate Support: ₹1,286.07 (Classic S1)
Immediate Resistance: ₹1,325.27 (Classic R1)
Traders may consider these levels for setting stop-loss and take-profit orders. A break above ₹1,325.27 could signal bullish momentum, while a drop below ₹1,286.07 might indicate bearish pressure.
HDFC
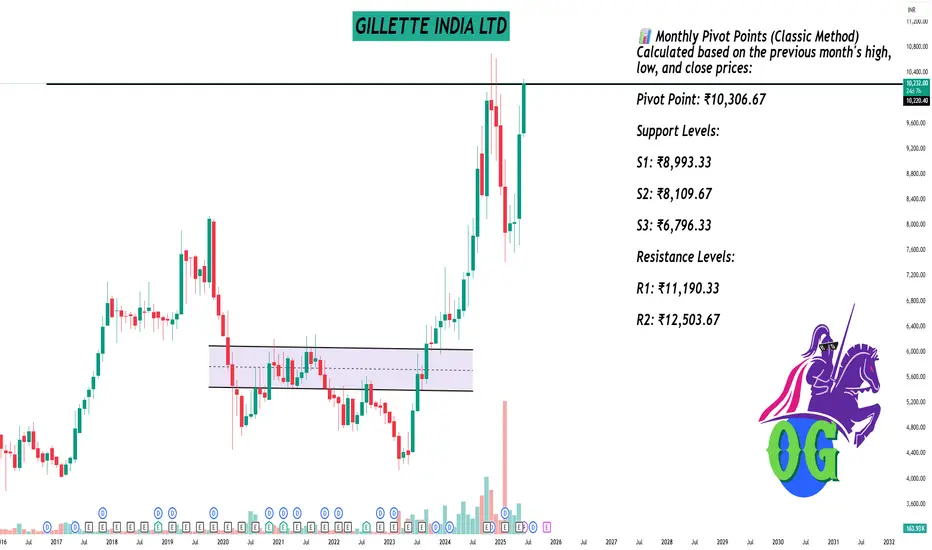
GILLETTE INDIA LTDAs of June 6, 2025, Gillette India Ltd. (NSE: GILLETTE) is trading at approximately ₹10,232.00, marking a 27.45% increase over the past month.
📊 Monthly Pivot Points (Classic Method)
Calculated based on the previous month's high, low, and close prices:
Pivot Point: ₹10,306.67
Support Levels:
S1: ₹8,993.33
S2: ₹8,109.67
S3: ₹6,796.33
Resistance Levels:
R1: ₹11,190.33
R2: ₹12,503.67
🔍 Fibonacci Pivot Points
Based on Fibonacci calculations:
Pivot Point: ₹10,306.67
Support Levels:
S1: ₹9,832.59
S2: ₹8,154.08
S3: ₹6,796.33
Resistance Levels:
R1: ₹10,351.08
R2: ₹11,190.33
📈 Technical Indicators Summary
Moving Averages: All major moving averages (MA5, MA10, MA20, MA50, MA100, MA200) are indicating a Strong Buy signal.
Relative Strength Index (RSI): 81.19 – Overbought
MACD: 194.05 – Buy
ADX: 96.24 – Overbought
Stochastic Oscillator: 82.92 – Overbought
📌 Trading Insights
Immediate Resistance: ₹11,190.33 (Classic R1)
Immediate Support: ₹8,993.33 (Classic S1)
Given the current price of ₹10,232.00, the stock is trading near its pivot point, suggesting potential for upward movement if it breaks above the immediate resistance. However, the overbought RSI and ADX indicators suggest caution, as the stock may be due for a short-term correction.
KPI GREEN ENERGY LTDAs of June 6, 2025, KPI Green Energy Ltd. (NSE: KPIGREEN) is trading at approximately ₹503.45, reflecting a 4.88% increase over the previous day.
📊 Daily Pivot Points (Classic Method)
Based on the previous day's high, low, and close, the daily pivot levels are:
Pivot Point: ₹497.23
Support Levels:
S1: ₹488.32
S2: ₹471.08
S3: ₹462.17
Resistance Levels:
R1: ₹514.47
R2: ₹523.38
R3: ₹540.62
📈 Fibonacci Pivot Points
Using Fibonacci calculations, the levels are:
Pivot Point: ₹497.23
Support Levels:
S1: ₹487.24
S2: ₹481.07
S3: ₹471.08
Resistance Levels:
R1: ₹507.22
R2: ₹513.39
R3: ₹523.38
🔍 Camarilla Pivot Points
Derived using the Camarilla method:
Pivot Point: ₹497.23
Support Levels:
S1: ₹503.15
S2: ₹500.76
S3: ₹498.36
Resistance Levels:
R1: ₹507.95
R2: ₹510.34
R3: ₹512.74
📌 Trading Insights
Immediate Support: ₹488.32 (Classic S1)
Immediate Resistance: ₹514.47 (Classic R1)
Traders may consider these levels for setting stop-loss and take-profit orders. A break above ₹514.47 could signal bullish momentum, while a drop below ₹488.32 might indicate bearish pressure.

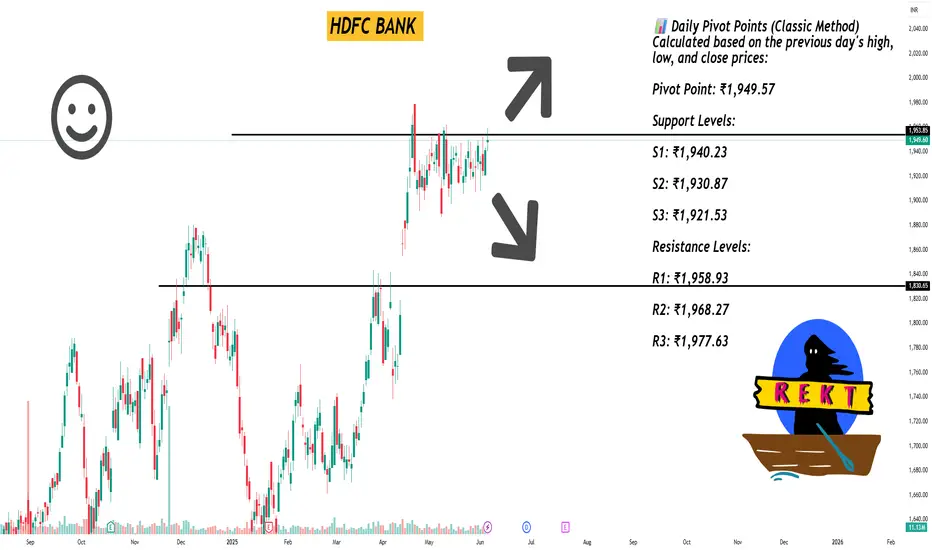
HDFC BANK As of June 6, 2025, HDFC Bank Ltd. (NSE: HDFCBANK) is trading at approximately ₹1,944.90. Here's a detailed technical analysis focusing on daily support and resistance levels:
📊 Daily Pivot Points (Classic Method)
Calculated based on the previous day's high, low, and close prices:
Pivot Point: ₹1,949.57
Support Levels:
S1: ₹1,940.23
S2: ₹1,930.87
S3: ₹1,921.53
Resistance Levels:
R1: ₹1,958.93
R2: ₹1,968.27
R3: ₹1,977.63
Source: Top Stock Research
📈 Fibonacci Support & Resistance Levels
Based on Fibonacci calculations:
Support Levels:
S1: ₹1,942.42
S2: ₹1,938.01
S3: ₹1,930.87
Resistance Levels:
R1: ₹1,956.71
R2: ₹1,961.12
R3: ₹1,968.27
🔍 Camarilla Pivot Points
These levels are derived using the Camarilla method:
Support Levels:
S1: ₹1,947.89
S2: ₹1,946.17
S3: ₹1,944.46
Resistance Levels:
R1: ₹1,951.31
R2: ₹1,953.03
R3: ₹1,954.74
📌 Trading Insights
Immediate Support: ₹1,940.23 (Classic S1)
Immediate Resistance: ₹1,958.93 (Classic R1)
Traders may consider these levels for setting stop-loss and take-profit orders. A break above ₹1,958.93 could signal bullish momentum, while a drop below ₹1,940.23 might indicate bearish pressure.
BLS INTERNATIONAL SERVICES LIMITEDAs of June 6, 2025, BLS International Services Ltd. (NSE: BLS) is trading at approximately ₹408.60. Here's a detailed technical analysis focusing on daily support and resistance levels:
📊 Daily Pivot Points (Classic Method)
Calculated based on the previous day's high, low, and close prices:
Pivot Point: ₹410.17
Support Levels:
S1: ₹405.83
S2: ₹402.77
S3: ₹398.43
Resistance Levels:
R1: ₹413.23
R2: ₹417.57
R3: ₹420.63
📈 Fibonacci Support & Resistance Levels
Based on Fibonacci calculations:
Support Levels:
S1: ₹407.34
S2: ₹405.59
S3: ₹402.77
Resistance Levels:
R1: ₹412.99
R2: ₹414.74
R3: ₹417.57
🔍 Camarilla Pivot Points
These levels are derived using the Camarilla method:
Support Levels:
S1: ₹408.22
S2: ₹407.54
S3: ₹406.86
Resistance Levels:
R1: ₹409.58
R2: ₹410.26
R3: ₹410.94
📌 Trading Insights
Immediate Support: ₹405.83 (Classic S1)
Immediate Resistance: ₹413.23 (Classic R1)
Traders may consider these levels for setting stop-loss and take-profit orders. A break above ₹413.23 could signal bullish momentum, while a drop below ₹405.83 might indicate bearish pressure.

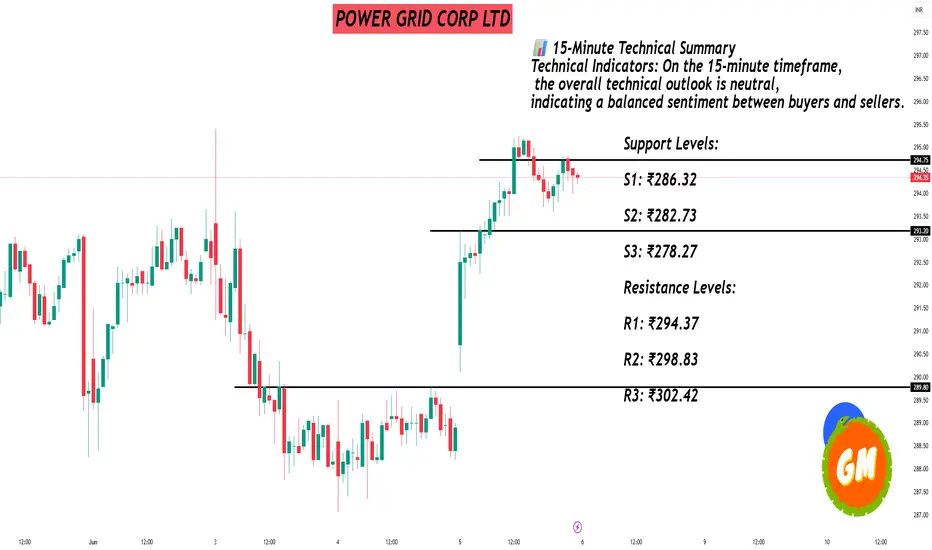
POWER GRID CORP LTDAs of June 6, 2025, Power Grid Corporation of India Ltd. (NSE: POWERGRID) is trading at approximately ₹294.25. Here's a detailed technical analysis focusing on 15-minute support and resistance levels, along with broader daily pivot points:
📊 15-Minute Technical Summary
Technical Indicators: On the 15-minute timeframe, the overall technical outlook is neutral, indicating a balanced sentiment between buyers and sellers.
🔧 Daily Pivot Points (Classic Method)
These levels are calculated based on the previous day's high, low, and close prices:
Pivot Point: ₹290.78
Support Levels:
S1: ₹286.32
S2: ₹282.73
S3: ₹278.27
Resistance Levels:
R1: ₹294.37
R2: ₹298.83
R3: ₹302.42
📈 Fibonacci Support & Resistance Levels
Based on Fibonacci calculations:
Support Levels:
S1: ₹291.23
S2: ₹290.02
S3: ₹288.05
Resistance Levels:
R1: ₹295.17
R2: ₹296.38
R3: ₹298.35
📌 Trading Insights
Current Price: ₹294.25
Immediate Resistance: ₹295.17 (Fibonacci R1)
Immediate Support: ₹291.23 (Fibonacci S1)
Traders may consider these levels for setting stop-loss and take-profit orders. A break above ₹295.17 could signal bullish momentum, while a drop below ₹291.23 might indicate bearish pressure.
Overview of Financial Markets Financial markets are platforms where buyers and sellers trade financial assets like stocks, bonds, currencies, and derivatives. They facilitate the movement of capital between savers and borrowers, enabling investment, risk management, and capital formation. These markets play a crucial role in the global economy by providing a mechanism for allocating funds and determining prices.

Management and Psychology Trading psychology is the emotional component of an investor's decision-making process, which may help explain why some decisions appear more rational than others. Trading psychology is characterized primarily by the influence of both greed and fear. Greed drives decisions that might be too risky.

Divergence Based Trading Divergence occurs when an asset's price and a technical indicator move in opposite directions, indicating a possible change in trend momentum. Traders use bullish or bearish divergence to anticipate reversals.

Intraday Trading Class part 7Purchasing and selling securities listed in a stock exchange on the same day is known as intraday trading. The primary purpose of transacting in this method is to realise capital gains on purchased securities as well as minimise risks by keeping money invested for an extended period.

MACD( Moving Average Convergence Divergence)MACD, short for Moving Average Convergence Divergence, is a technical indicator used in finance to analyze the momentum and trend direction of an asset's price. It's a popular tool for identifying potential buy and sell signals.

More About RSI RSI is a tool that aids traders in capturing market momentum by measuring the fluctuation in prices. Traders rely on RSI to spot oversold and overbought markets and determine the right time to enter a trade. RSI helps traders identify whether a stock is either overbought or oversold.

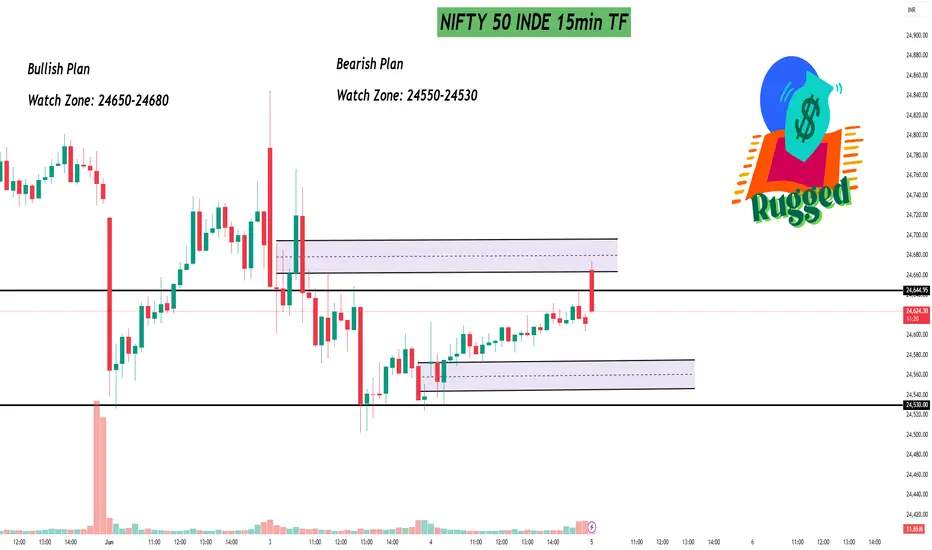
NIFTY 50 INDE 15min TF✦ Expiry Day Market Plan - Inside Candle Setup
Today is an Inside Candle Day - price stuck within the previous day's range. This means:
Sideways movement likely
But if key levels break - high volatility possible!
Bullish Plan
Watch Zone: 24650-24680
Condition: 15-min candle close above 24680 with strong volume
* Action:
→ Enter on breakout
→ Or wait for pullback (retest) & enter on bounce
Targets: Big upside possible - trail SL to lock profits
Bearish Plan
Watch Zone: 24550-24530
Condition: Break & hold below 24550
* Action:
→ Enter on breakdown
→ Book first 50 pts, then trail SL
Targets: Quick downside moves possible
? Key Tips
Don't rush - wait for confirmation
Use volume + candle close as triggers
Stick to trailing SL & partial booking
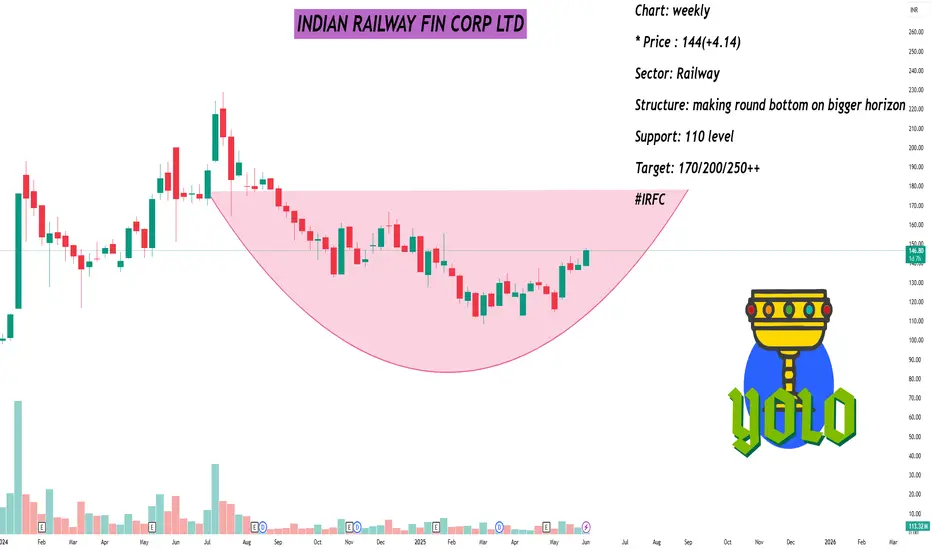
INDIAN RAILWAY FIN CORP LTDSTOCK OF THE DAY
Stock: Indian Railway Fin Corp L
Chart: weekly
* Price : 144(+4.14)
Sector: Railway
Structure: making round bottom on bigger horizon
Support: 110 level
Target: 170/200/250++
#IRFC
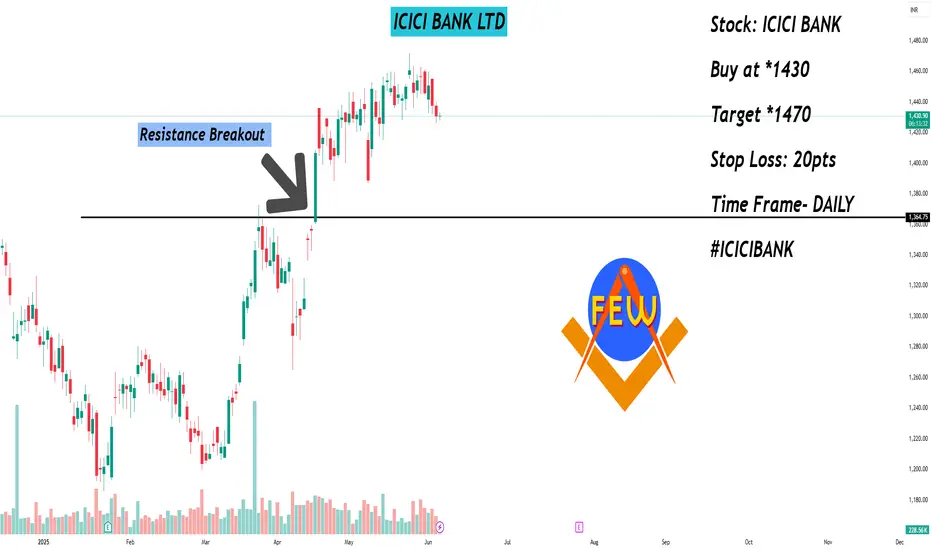
ICICI BANK LTDStocks to Focus on 5th Jun 2025
Stock: ICICI BANK
Buy at *1430
Target *1470
Stop Loss: 20pts
Time Frame- DAILY
#ICICIBANK
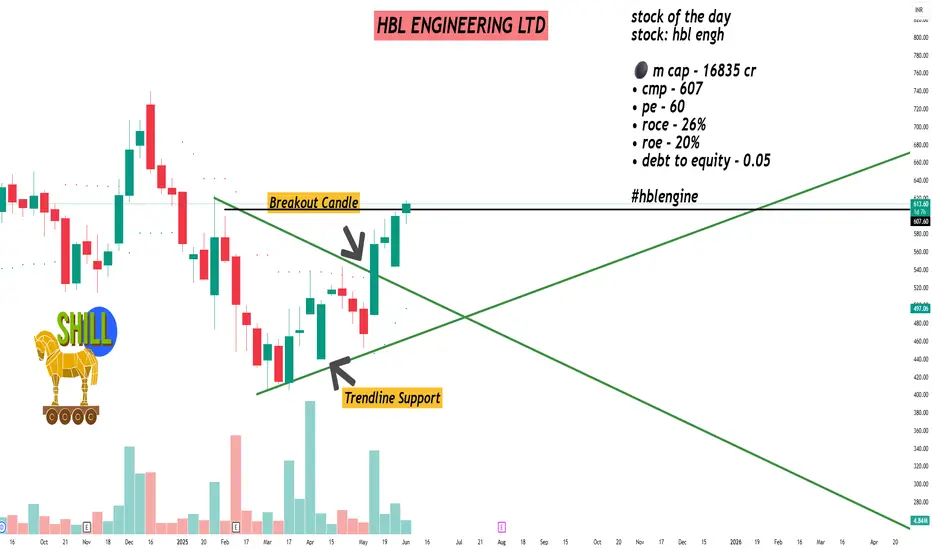
HBL ENGINEERING LTDstock of the day
stock: hbl engh
⚫ m cap - 16835 cr
• cmp - 607
• pe - 60
• roce - 26%
• roe - 20%
• debt to equity - 0.05
#hblengine
COMPUTER AGE MNGT SER LTD COMPUTER AGE MNGT SER LTD – 1 Day Support & Resistance (Updated at ₹4713.40)
Stock: Computer Age Management Services Ltd (CAMS)
Time Frame: 1 Day
Latest Price: ₹4713.40
Support Levels:
₹4660 – Minor intraday support
₹4585 – Strong swing support
₹4500 – Major support zone
Resistance Levels:
₹4750 – Immediate resistance
₹4820 – Short-term breakout level
₹4900 – Psychological & technical resistance zone

NIFTY 50 INDEXMajor Levels for Nifty & BankNifty - Jun 5, 2025
#NIFTY50 LTP: 24620 | A *Muted* opening might be today.
Resistances: 24670 & 24730
Supports: 24490 & 24320
#NIFTYBANK LTP: 55676
Resistances: 55825 & 56125
Supports: 55450 & 55300
A Disclaimer: This is for educational purposes only. Please consult a financial advisor before making any trading decisions.

Option Chain Analysis An option chain is a comprehensive listing of all available options contracts for a specific underlying asset, like a stock, index, or commodity, organized by strike prices and expiration dates. It's essentially a table that provides detailed information about call and put options for that asset, including strike prices, expiration dates, premiums, open interest, volume, implied volatility, and last traded price.

Candlestick Pattern part 2Candlestick patterns are a visual representation of price movement in financial markets, used in technical analysis to identify potential trend reversals or continuations. These patterns are formed by the opening, closing, high, and low prices of a financial instrument over a specific period. They are like signals on a chart that can help traders make informed decisions about buying or selling.

Learn Institutional Level Trading part 6An institutional trading strategy is the buying and selling of financial assets, such as stocks, commodities, currencies, futures, and options by institutions like banks, credit unions, pension funds, hedge funds, mutual funds, and REITs.

Institutional Trading Strategies part 5Institutional traders incorporate strategies that emphasize both long-term value and diversification in their trading practices. They leverage significant amounts of capital to build portfolios diversified across multiple assets, which helps reduce risk while seeking improved market prices.
