HDFC COMING TOWARDS SUPPORT ZONE AGAINWe suggested buying HDFC at 2730 and it went around 2780 hitting all our targets. It looks a good buy if comes to support range of 2550 - 2500 for the short-term.
To motivate us, Please like the idea If you agree with the analysis.
Happy Trading!
InvestPro India Team
HDFC

intradayas we can see double bottom. it can also form double top.
it can also form a W pattern.
both side potential
follow your risk management

HDFC Bullish RejectionThe weekly chart of HDFC is exhibiting rejection of the bulls for the last five weeks. This can also be seen in the rising wedge which is forming on the Daily chart.
Further, this type of price action is also forming at the completion of 61.8 AB=CD harmonic pattern.
The thesis is bearish with target of point B of the harmonic pattern at 2507.

TECHNICAL PICK HDFC HDFC is consolidating in a parallel channel pattern on daily time frame chart what I observed it is poised to go up with no disruptions so we can go long for if it will break and close the resistance (2734) mentioned on chart for the target of 2932 why it seems to go up is the reason that it collision to resistance again and again and make it weak so if once if it will break and close we can consider for long in it for the target of previous ATH.


HDFC - Ichimoku Bullish Breakout Stock Name - Housing Development Finance Corporation Limited
Ichimoku Cloud Setup :
1). Today's close is above the Conversion Line
2). Future Kumo is Turning Bullish
3). Chikou span is slanting upwards
All these parameters are showing bullishness at Current Market Price
and more bullishness AFTER crossing 2750
#This is not Buy and Sell recommendation to any one. This is for education purpose and a helping hand to learn trading in Market.
# Cloud Trading
# Ichimoku Cloud
# Ichimoku Followers
I hope you all like my analysis.
Please do share your thoughts into comment section.
Please give a like, share & subscribe for daily analysis.

HDFC CHART ANALYSISHDFC First Form Perfect Rectangle and After we Clearly see its in Parallel Channel Pattern Along with Breaking Rectangle in Lower level and now Facing Major Resistance at Upper Levels
After Seeing in To Volume or Market trend I dont Think it survive or BreakOut the Resitance

HDFC AMC: a probable long tradeHDFC AMC is trading near the demand zone & can be accumulated over time for the immediate target of supply zone and beyond
SL~ 1818 WCLBS
Pros: FII stake⬆️, highest ever sales, HDFC brand
Cons: stagnant EPS, declined AUM market share

HDFC Stock AnalysisHDFC Stock Analysis
HDFC Stock was in range since last 45 days between 2608-2728. Now the Range got broken on Downside. Next Support for HDFC Stock
is near 2525. If Stock closes below 2525 on daily timeframe, We may see more fall and targets on Downside are 2467/2406.

HDFC CHART ANYLYSISHdfc Chart Anylysis Where Hdfc Recently Break His Trendline Supprt and Now It Get I Think His Demand Zone

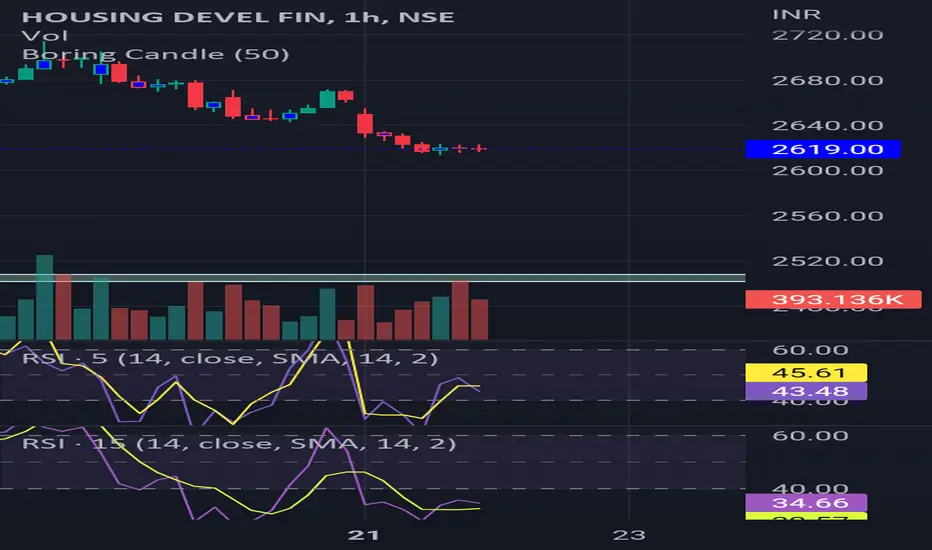
intradayonly for short side. time frame :15min . a great closing then you can enter for short by putting a logical stop loss.
follow your risk management

HDFC: Welcome the Third Wave RallyFrom the bottom of Mar'20 of 1473 stock has rallied to 3000 odd levels in an impulsive manner which can be counted as clean impulse pattern of five distinct waves. This impulsive rise can be designated as our primary wave-1. After placing a high of 3021 in Nov'21 stock has undergone into a complex correction WXY in the primary wave-2 which was concluded in Jun'22 at the price level of 2026. Subsequently prices have bounced back and started rallying again in an impulsive manner. This rise can be assumed that stock is continuing its trend in a third wave rally. Maintaining the key level at 2026 one should remain bullish for long term investment and look for the usual third wave target of 4045 which is the Fibonacci 161.8% extension level.
Investment Strategy:
Buy in the zone of 2580-2630 and maintaining SL of 2026, look for the target of 4045 and later 5140.

HDFC: Power of Expanding FlatFrom the high of 2680 stock has given a correction in an Expanding Flat category. The post market price action of an Expanding flat is very powerful. Based on this observation HDFC stock is likely to extend the gains towards 2710-2715 in the coming days. Any weakness should remain above the level of 2632 however, nearest stop loss can be taken as 2649.
Buy: 2675-70 SL:2649 TGT: 2710-15

HDFC BANK MUST BUYHdfc bank is about to form harmonic ABCD pattern above 1730 and a must buy from these levels Go long for 6 months to 1 year target of 2000/2233 if corrected to 1580-1550 levels add more.

HDFC - Ichimoku Bullish Breakout Stock Name -Housing Development Finance Corporation Limited
Ichimoku Cloud Setup :
1). Today's close is above the Conversion Line
2). Future Kumo is Turning Bullish
3). Chikou span is slanting upwards
All these parameters are showing bullishness at Current Market Price
and more bullishness AFTER crossing 2734
#This is not Buy and Sell recommendation to any one. This is for education purpose and a helping hand to learn trading in Market.
# Cloud Trading
# Ichimoku Cloud
# Ichimoku Followers
I hope you all like my analysis.
Please do share your thoughts into comment section.
Please give a like, share & subscribe for daily analysis.

#Banknifty with India Best Trader's with Tool👑#We Make Only Profit.
#HDFCBANK #BANKNIFTY #NIFTY50 #NIFTY #SENSEX #TATA
RBI Forex Reserve Grow is this Good or Bad ?
1st 140 Billion loss hua hai or ab 20 Billion Grow hua hai to hai to abi bhi loss mai
Gover..t abi losss mai hai laken wo Backup bhi ready kr rhe hai take 2023 kese wjh se krab bhi jaye to economy
pe zada Farak na pade..

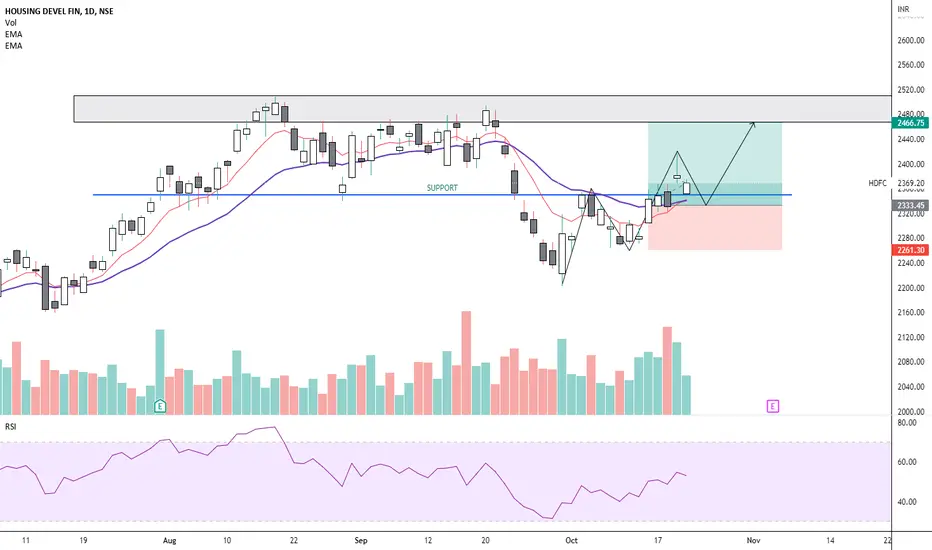
HDFC SWING TRADE FOR 15-20 DAYSHDFC can be traded as a swing potion for 15-20 days and it also can generate to 5-6% withing short period
buy near 2335
Stoploss - 2260
amd target is 2460
FINNIFTY expiry analysis. TATAPOWER and TECHMAHINDRA breakoutToday is the FINNIFTY expiry. It has been in a tight range, if it breaks, it may give a good move.
TATA POWER and TECHM analysis for break out.
Keep these on your watchlist.
Happy trading. If this helped you, share in the comment.
I am not SEBI registered. Kindly take your own trades.

Summarized view_HDFC Bank_BullsihWeekly time frame:
We have seen a simple correction in wave 2 & a complex one in wave 4 (alteration looks perfect)
Now, it looks like we are in wave 5.
I am into this since 1550 and with TSL protection.

HDFC BANK WEEKLY HDFC BANK major support zones for investment. one can accumulate in dips for long term investment.

hdfc bank demand levelif price comes to this zone may give a bounce this is demand n supply analysis
HDFC BANKHDFC BANK
Gaps are areas on a chart where the price of a stock (or another financial instrument) moves sharply up or down, with little or no trading in between. As a result, the asset's chart shows a gap in the normal price pattern. The enterprising trader can interpret and exploit these gaps for profit.

HDFCBANK Good for SwingNSE:HDFCBANK
Good to keep on the radar
Always respect SL & position sizing
========================
Trade Secrets By Pratik
========================
Disclaimer
SEBI UNREGISTERED
This is our personal view and this analysis
is only for educational purposes
Please consult your advisor before
investing or trading
You are solely responsible for any decisions
you take on basis of our research.
