HDFC moved amazinglyNSE:HDFC has a good move yesterday. HDFC kept NIFTY higher. Ready to show 2760 levels soon. Stay invested.HLongby gauravcs4u0
Hdfc Hdfc finally gave breakout from previous levels shared few days back, 7% pump today from exact level.HLongby erankush00
HDFCNSE:HDFC One Can Go long with a Strict SL below the Trendline or Swing Low of Daily Candle. Close should be good, and Clean. R:R ratio should be 1 :2 . Disclaimer : You are responsible for your Profits and loss, Shared for Educational purposeHLongby CreativeCreatureUpdated 1
HDFC LTD spot cmp 2640Ascending parallel channel structure formation channel resistance around 2624 which is surpassed and now harmonic equivalent harmonic ABCD pattern would mature around 2680-2700 levels either on reversal below trendline. or around higher levels of harmonic maturity counter can give reversal on lower side, new of msci and fii weightage increase are out which have led to violent upmove in counter.Hby RUDRA0070
HDFC LTD spot cmp 2490Harmonic study reveals that bearish harmonic pattern matured and now for reversal confirmation counter need to break below 2469 and give closing below that levels,, if reversal confirmation is confirmend , counter trend might start,, let see whats in storeHby RUDRA007Updated 1414384
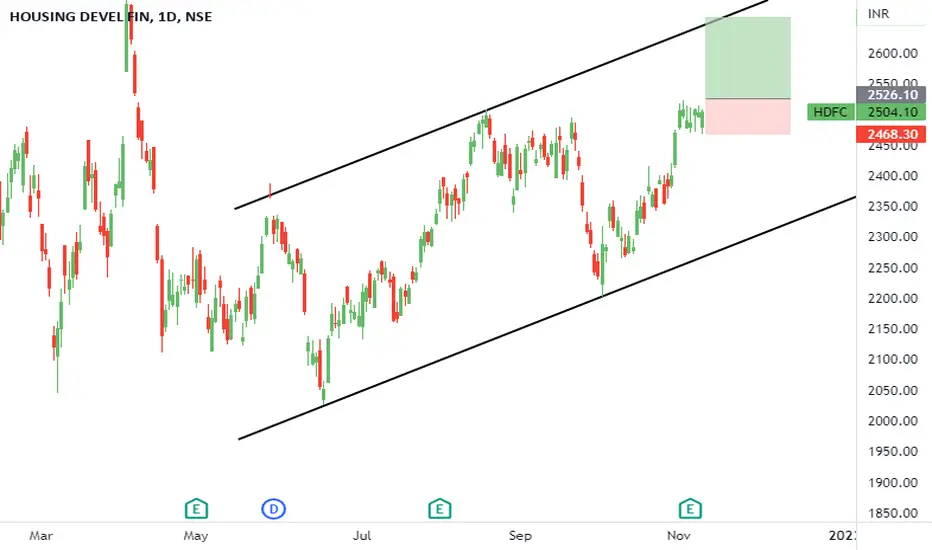
hdfcstock in raising channel with pole and flag buy above 2525 target of 2655++. In weekly time frame another rasing channel.HLongby devobrataroy222
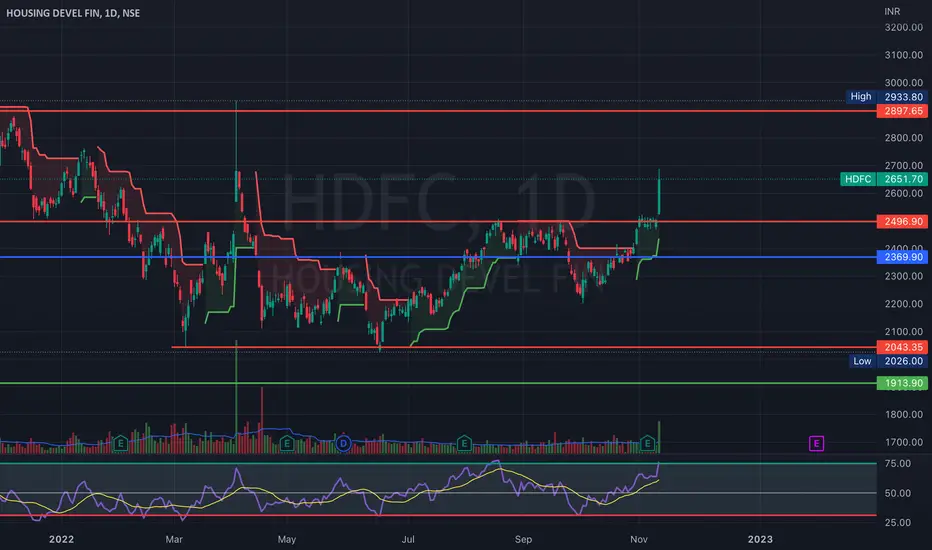
HDFCHDFC:- is trading near it's breakout level for the third time. If it is successful in giving the breakout then we can see upper levels soon.HLongby AjayDhakad_Keep_it_simple110
HDFC is also near it's breakout levelNSE:HDFC is trading near it's breakout level for the third time. If it is successful in giving the breakout then we can see upper levels soon.HLongby gauravcs4u0
HDFCAMCFurther in addition to previous idea. Buy HDFC AMC WITH SL OF 1970, T1 2326 T2 2350.Longby erankush0110
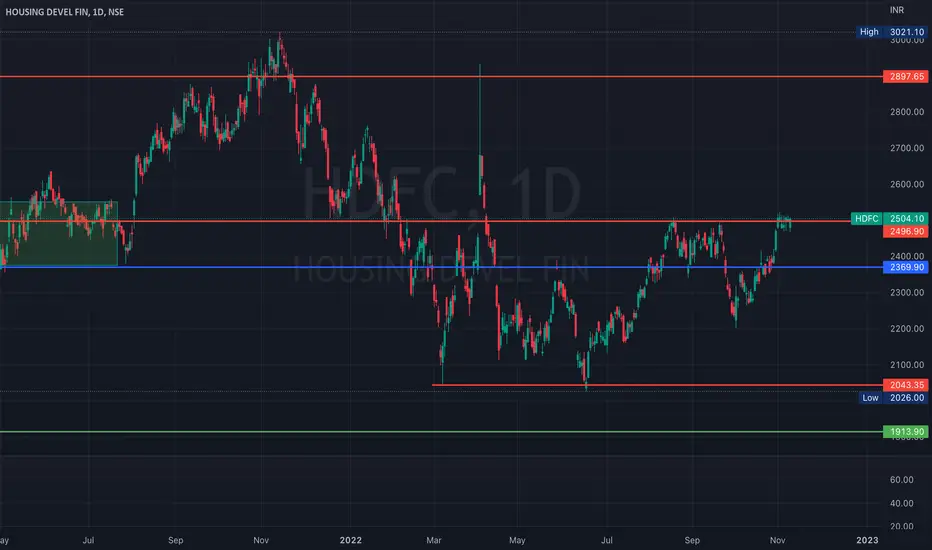
HDFCHdfc finanlly ready for upside potential 15-20% upside from here. If comes near 2400 add more.HLongby erankush0331
HDFCAMC in accumulation phaseHDFCAMC has formed a pennant pattern on a daily timeframe which is being backed by the support zone. Reasons to enter - 1. Accumulating for the last 4 trading sessions. 2. Testing the trendline 3rd time. 3. Overall Market structure is bullishLongby Apex_Trading690
Nifty, Banknifty and top stocks analysis for tomorrow + levelsWill 18k hold? That seems to be the hottest question on the minds of everyone today. Here's my view on the same :)06:21by MarketsWithKR4
2 Amazing price action trades and Index ideas for 17 Oct marketsI daily make educational content videos on financial markets HLong05:22by Averoy_Apoorv_Analysis4424
BEGINNERS RULE :1. Before starting any new venture, we must learn the basics of that subject. So, learn the basic ABCD of trading. 2. Beginners should avoid the Futures and Option (f&o) trading. First, one needs to get a good grip over the cash equity segment. 3. Learn technical analysis and try to master any one strategy and stick to it. 4. Avoid dependence on anyone for too long, "Trust your own setup always” 5. Don't be impressed so quickly and start dreaming after seeing other trader's earning or profits screenshot. 6. 'Simplicity is the best policy.' Keep your analysis simple and stick to basics. 7. Backtest your new setup for at least 3 months to find out the Return on Investment (ROI) percentage. 8. Price Action is above all. Don't complicate your study with too many indicators/tools. We have come here to earn money, not to complete a Ph.D. 9. Avoid business/finance TV channel recommendations. Don't follow it blindly. 10. Mistakes are fine but try to avoid committing again and again. 11. Use proper and safe trailing stop-loss. Keep learning and earning. Happy profit making :) HEducationby Divyaapugal6658
HDFC- Cracks from The Top of 2507/ Hidden Divergence (Y-Wave)Hidden Bearish Divergence This occurs when price makes a lower high (LH), but the oscillator is making a higher high (HH). When you see hidden bearish divergence, chances are that the pair will continue to shoot lower and continue the downtrend. What we expect next? As suggested earlier on 17th Aug 2022 video idea that the correction could be deep towards 2000 levels & has to be reviewed at certain intervals as markets are too volatile. The last related idea can be checked below Thank you Related Idea for HDFC Bank Nifty - Will if follow in the footseps of HDFC? HShort03:38by WaveTalksUpdated 8838
#Banknifty Banknifty 1 h timeframe there is a trensline if price trade below this trendline then we can see a fall of almost 500 points and if market sustain above 41200-41300 then it will stable by xmrx991
HDFC 2800++We can see stock corrected after a huge gap up where there was heavy selling that continued for some days from the past itself 75 ema has been acting as exact resistance so from now on price is over 75 ema so it will act as support so we can keep sl slightly below 75 ema or below major trend line . and we can see fromation of higher highs and higher lows and price breaking trough resistance so currently in uptrend can expect 2800++HLongby master-oogway3
HDFC GOOD TO SHORT NSE:HDFC Good to keep on the radar as it will help to decide market direction Always respect SL & position sizing ======================== Trade Secrets By Pratik ======================== Disclaimer - SEBI UNREGISTERED This is our personal view and this analysis is only for educational purposes. Please consult your advisor before investing or trading. You are solely responsible for any decisions you take on basis of our research.HShortby Trade_Secrets_By_Pratik1
HDFC BANK Trade Setup !!TREND ANALYSIS & TRADE SETUP ! WAVE ANALYSIS !! Follow Chart Instruction. Do not be Hurry for entry. Wait for Proper Entry Setup. Buy/Sell with Best Risk Reward. Educational Chart Only. Wait for ENTRY CONFIRMATION ! Risk : Reward: 8-10 times.Longby MohitAroraUpdated 1
HDFC LONG IDEATake entry now at 1500 and target is 1510. now follow me fro new updates and news Longby sagarmschauhan0
Banknifty set for 40k? Nifty, Banknifty daily analysisDo you feel the markets are likely to continue to remain in the control of bulls?08:38by MarketsWithKR3
HDFC BANKWait And Watch ?? Look for Low risk, High reward, and High Probability setups- Things to Remember while Trading with the Trend 1. Know what the trend is. 2. The best trades are made in the direction of the trend. 3. Assume that the main trendline or moving average will hold. 4. The longer the moving average is, the better it defines the trend. 5. Wait for the pullback. 6. Don’t chase the market. 7. Don’t fight the market. 8. Even in the strongest trends there should be some retracement. 9. The closer the market is to the trendline, the better the risk/reward ratio is. 10. Use ADX to determine the strength of the trend. 11. Higher the level of ADX , the stronger the trend, below 20 consider the market to be choppy 12. Hold trades longer in a strong trend. 13. Wait for confirmation of a trendline breaking before reversing position. 14. Know where the Support levels are. 15. Place stops outside the Support levels. Thank You..Longby Rvkachhadiya4