Was this a staged Closing of the Indices?NIFTY 50 EOD ANALYSIS -29-09-21
IN SUMMARY
OHLC
17,657.95
17,781.75
17,608.15
17,711.30
Close = -37.3 / -0.21%
H-L = 174 points
VIX 18.84 / +1.61%
FII DII: Data not available - likely to be negative.
SGX NIFTY @1950h - 17683 / -23 points
Likely open: Please read Insights at the end of the post.
CHART BASED CONCLUSIONS - 15 M Chart
A strong gap-down of 90 points and then there was the usual bounce back to test the opening high and then a sell-off which threatened to go and breach 17600 levels but then came some active buying which resulted in the index recovering in a somewhat choppy way.
It was only after 1300h that the index rallied and crossed 17750 and then came another sell-off which brought it below 17700 and then in a dramatic manner it was closed above 17700.
The trading range was down by half than that of yesterday.
NIFTY made a lower high, but a higher low and traded within the peak of yesterday’s close and yesterday’s lows. This is a consolidation before the monthly expiry.
NIFTY WEIGHT LIFTERS & DRAGGERS
NIFTY LIFTERS
NIFTY DRAGGERS
SBI
18.00
HDFC
31.00
JSW STEEL
13.00
HDFC BANK
27.00
IOC
12.00
RELIANCE
21.00
POWERGRID
10.00
ICICI BANK
16.00
SUN PHARMA
10.00
KOTAK BANK
11.00
63.00
106.00
Lifter - Draggers = -43
POSITIVES
NIFTY managed to close above 17700.
NIFTY did not breach 17600 despite selling pressure and a retest attempt on the downside was made on multiple occasions.
NEGATIVES
When all the heavyweights go against the upward trend, there is going to be negativity and that is what spooked the indices.
All key drivers were not in the mood to rise today and profit booking and or sell-off seems to have taken place ahead of expiry.
VIX keeps rising indicating more wild moves.
TRADING RANGE FOR THE REMAINDER OF THE WEEK:
This remains as it is --
NIFTY 17500-18100
BANK NIFTY 37200-38500-800.
INSIGHTS / OBSERVATIONS
As NIFTY was approaching its P Close at 17748, 17600 CE in which I was trading, also approached its P Close at 180. This is a rare coincidence that I have seen. Usually, Options tend to decay even during the day and here, 17600 CE remained intact despite a choppy AM session where the Index attempted to retest 17600 levels a couple of times and then showed weakness until about 1300h.
However, on a closing basis, there is some variation in the NIFTY and the ITM CE deviation from the P Close. THis may be on account of the weighted average close.
In my view, today’s close was staged as NIFTY topped out just around the closing highs of yesterday and from there it sold off to ensure that it ends below the P Close but above 17700.
Despite FTSE up by 60 points, NIFTY ended in the red. This is surprising. Though FTSE and NIFTY cannot be compared but NIFTY should have ideally followed the cue and closed positive, but instead, it ended red and at 1925h, the SGX is showing -73 even when the US markets are in the green.
Clearly, there is something that is beyond the ordinary eyes to see - i am carrying forward 17600 CE keeping global cues in mind and I could be completely wrong here but I going by what I believe is a mismatch.
What do you feel about this?
Thank you, and Happy Money Making!
Umesh
29-09-21
NOTE --
This write-up is not a prediction mechanism for the movement of Indices in the Indian markets as the markets are unpredictable in nature. I may refer to many data points in the article but I do not base my view on any of these standalone. In fact, I prefer to react to the price moves than predict the price moves. I also do not review Open Interest. Whatever data points I am using, are all stated in the article. The article title, as well as its contents, can at best be stated as --- This Is How I Read Nifty. I hope I have been able to set the expectations right.
---
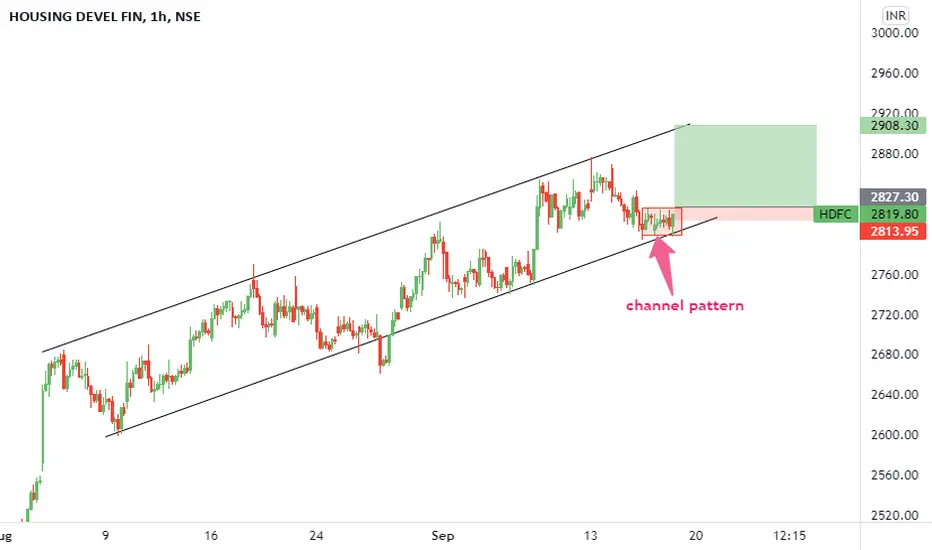
HDFC

Simple Trade Setup | HDFC | 29-09-2021 [INTRADAY]NSE:HDFC
It has almost the same chart as NIFTY.
Trade Setup for Date 29-09-2021:
1) Don't Jump in to trade at the beginning of the market. Let it get settle for 15-20min first and judge the price action.
2) Everything is mentioned on the chart. I hope it is easy to understand.
3) All the levels will work as support, resistance, entry and exit w.r.t price action near that level.
4) Avoid gap up or gap down chase. Wait and trade between levels.
Please refer below chart for levels.
Hope I made it easy to understand it.
Do comment your doubt or suggestion.
Note: Trade with Strict SL. It may or may not hit all the levels. So one can book profit / loss at respsective level considering how price action works near that level.
H

HDFC BANK Target 1545-1600, 1-2 months.HDFC Bank
RBI allows HDFC Bank to issue new credit cards after 8 months of ban.
target is for 1-2 months because the ban is lifted partially.

hdfc.....................hdfc at imp levels---------------------------..............................-----------------------------------------------------------------------------------------
H

HDFC Bank - Pure positional TradeAfter too much consolidation STock is ready for big move
Trading near All time high, if gives breakout above 1640 then buy or if retraced at same level till 1580 then also buy small qty
Looks good for Tgt 1700 1800 1900++ upside
SL is 1530 on closing basis

#HDFC LIVE# WE WILL MAKE ONLY PROFIT
if HDFC break line and make double bottom
Don't buy any call
#IF YOU NEED ANY HELP JUST COMMENT OR MESSAGE ME😊😊

Simple Trade Setup | HDFC | 27-09-2021 [INTRADAY]NSE:HDFC
Observations:
1) On Daily Time frame, it broke 10DMA on 23-09-2021 and on 24-09-2021 it took support from it and closed with green candle.
It has a characteristic to not to stay below 10 DMA for long time untill and unless there is some negative news about it.
Please refer below chart : Daily time frame.
2) On 30min time frame, it has made double bottom pattern and gave breakout. Next critical resistance is 2850 level.
Sustainable breakout of 2850 level will make it bullish till target of 2900-2930 level for short to mid term.
Please refer below chart : 30 min time frame.
-------------------------------------
Trade Setup for Date 27-09-2021:
1) Don't Jump in to trade at the beginning of the market. Let it get settle for 15-20min first and judge the price action.
2) Everything is mentioned on the chart. I hope it is easy to understand.
3) All the levels will work as support, resistance, entry and exit w.r.t price action near that level.
4) Avoid gap up or gap down chase. Wait and trade between levels.
Please refer below chart for levels.
Hope I made it easy to understand it.
Do comment your doubt or suggestion.
Note: Trade with Strict SL. It may or may not hit all the levels. So one can book profit / loss at respsective level considering how price action works near that level.
H

HDFC: Cup and Handle Breakout with ATH BreakoutHDFC: Cup and Handle Formation with All-Time High Breakout.
Buy above 2890-2900 for targets of 3000/3155/3370/3640.
A similar pattern is observed in HDFCBANK as well.
HLong

What a strong comeback by the INDICES! NIFTY batting 17822!NIFTY 50 EOD ANALYSIS -23-09-21
IN SUMMARY
O / H / L / C
17670.85 / 17843.90 / 17646.55 / 17822.95
H-L = 86 points
VIX 16.6 / +0.67%
FII DII: +1530 Crores
SGX NIFTY at 1930h - 17853 +22 points
Likely open: Flat to mild positive. Profit booking may kick-in in the PM session.
CHART BASED CONCLUSIONS - 15 M Chart
A strong gap-up open and a sustained rally that ended the day a few points above the new ATH of 17843.9.
It was after a long time that NIFTY was supported well by BANK NIFTY and other sectors as well.
NIFTY yet again ends in the proverbial uncharted territory.
The daily chart shows that today’s candle is up in the air like a rocket fired by someone.
NIFTY WEIGHT LIFTERS & DRAGGERS
The Weight Lifters
RELIANCE 42
HDFC BANK 32
HDFC 30
BAJAJ FINSERV 28
ICICI BANK 19
TOTAL 151
The Draggers
HDFC LIFE 02
ITC 02
NESTLE 02
DR REDDY’S 01
BRITANNIA 01
TOTAL 08
Lifter - Draggers = +143
POSITIVES
RELIANCE chose to join hands with the HDFC twins and then what comes out was a blockbuster.
BANK NIFTY also joined the party and has gained the lost ground in a matter of just one session.
There are plenty of positives and the list would be long so I am not writing it here.
NIFTY ends on yet another ATH and for the first time close above 17800.
NEGATIVES
As a mark of respect to the bullishness and positivity shown by the markets, let me not even think of any negativity at least for today’s analysis.
TRADING RANGE FOR 24-09-21
I am not sure what to state about NIFTY levels. So I will let it settle down in the new terrain and will see where it ends the week before stating any levels.
The spike in BANK NIFTY has torn apart all the levels on the downside so will wait for the index to end the week before stating them. The resistances are obviously at 38000 and then around the ATH of 38100+.
INSIGHTS / OBSERVATIONS
All constituents of BANK NIFTY ended in the green.
FMCGs are known as the defensives and today when the Indices were on a roll, there was mild profit booking in the sector as HUL, ITC and BRITANNIA ended in mild red.
TATA MOTORS at one stage was up 4% and as against that MARUTI could barely move in to the 1st gear and struggled throughout the day drifting towards the P Close several times.
For the last 2 days, similar price action had happened in the HDFC twins and today we know what happened! Will MARUTI follow their example tomorrow?
RELIANCE may take its time to reach 2500 as it made an ATH of 2497 just around one of the FIB extensions.
Peak margin rules would get invoked from tomorrow morning. So for retail traders like me, as regards Stock Options are concerned, the month would be expiring tomorrow around lunch as thereafter, many retailers like me, would start exiting thereby put pressure on the downside as regards Option premia are concerned.
What do you feel about this?
Thank you, and Happy Money Making!
Umesh
23-09-21
NOTE --
This write-up is not a prediction mechanism for the movement of Indices in the Indian markets as the markets are unpredictable in nature. I may refer to many data points in the article but I do not base my view on any of these standalone. In fact, I prefer to react to the price moves than predict the price moves. I also do not review Open Interest. Whatever data points I am using, are all stated in the article. The article title, as well as its contents, can at best be stated as --- This Is How I Read Nifty. I hope I have been able to set the expectations right.
---

Levels for - 23 Sep 2021EXPLANATION : This is a 15 min time frame chart of HDFC , It has formed Cup & Handle pattern // Swing Pattern . If give a strong breakout and broke its supply zone with high volumes and retest the same , I am bullish on HDFC .
If you like this analysis of Stock give a Thumbs up // Like , let me know in comments below :)
H

HDFC LIFE BUYHdfc Life After Giving A Breakout Is Again Coming To Retest The Resistance Line And As We Know Resistance Will Now Act As Support. And We Also Have The 20d Ema Support At Around 725 Levels. So It Becomes A Good Position To Start Accumulating Hdfc Life As The Risk To Reward Ratio Is In Our Favouor. Always Maintain Strict Stop-Loss.Target 1-740. Stop Loss 722

HLong

HDFC reversal Zone at 2635 wait for it Next target 3000HDFC reversal Zone at 2635 wait for it Next target 3000
H

hdfc long target 1.5 - 2 %buy hdfc at 3735 around
current test the support level and ready to bullish dont greed more 1-5-2 % enough
Only take it if you planned your risks
HLong

Levels for - 22 Sep 2021 EXPLANATION : This is a 15 Min time frame chart of HDFC , It has formed Cup & Handle Pattern // Swing Pattern , No trading zone marked in chart .
If you like this analysis of Stock give a Thumbs up // Like , let me know in comments below :)
H

FTSE Lifts Indian Indices as they bounce back in stylefailed NIFTY 50 EOD ANALYSIS -21-09-21
IN SUMMARY
O / H / L / C
17450.5 / 17578.35 / 17326.1 / 17562
H-L = 252 points
VIX 16.52 / -5.55%
FII DII: Not available till 1950h Is more likely to be moderately positive.
SGX NIFTY at 1940h - 17536 -25points
Likely open: Flat to mild positive.
CHART BASED CONCLUSIONS - 15 Minutes Chart
A gap-up opening failed to hold 17450 levels and then sold off and made a lower low as NIFTY drifted towards 17300-325.
The situation would have been worse off had Europe not opened green and may be 17200-250 would have been tested.
However, soon after it became clear that Europe was trading in the comfortable green, NIFTY made a one-directional rally to end above 17550.
However, it is likely to face resistance around yesterday’s high of 17625+ this is evident on the daily charts.
NIFTY WEIGHT LIFTERS & DRAGGERS
The Weight Lifters
BAJAJ FINANCE 37
INFOSYS 19
BAJAJ FINSERV 15
JSW STEEL 14
ITC 11
TOTAL 96
The Draggers
HDFC BANK 05
MARUTI 03
NESTLE 02
BAJAJ AUTO 02
BPCL 01
TOTAL 13
Lifter - Draggers = +86
POSITIVES
NIFTY closed above 17550 and 17300 was respected.
BANK NIFTY erased all the losses and ended in the green which helped NIFTY in a big way.
ITC, INFOSYS-TCS, HDFC, and TATA MOTORS rose more than 1%.
RELIANCE closed above 2400.
KOTAK BANK was able to hold 2000 levels on closing basis.
NEGATIVES
The single most weak link is HDFC BANK. It experienced severe VIX today and has the potential to be the game-breaker or maker in the coming week.
Except for KOTAK BANK, all heavyweights in banking were badly hammered.
BANK NIFTY made a low of 36525 a fall of 1500+ points of ATH attained a couple of days ago.
TRADING RANGE FOR 22-09-21
17300-17350 was the support line and NIFTY almost threatened the same. So I now revise the line to 17250-300. Resistances at 17600-30-700.
BANK NIFTY supports lines were breached so now the support line is redrawn as 36200-500. Resistances at 37500-700.
INSIGHTS / OBSERVATIONS
HDFC BANK seems to have become the punching bag as it was extremely volatile through the day and moved 32 points in the day and it must have gone up and down and back and forth several times.
Every time it went up and down, the fortunes of the index traders swung with it as it is a heavyweight for both the indices, and if it were not for the other scrips that showed good performance, both the indices would have fared poorly on a closing basis.
NIFTY’s move is very much like that of INFOSYS if we look at the 5 minutes chart. INFOSYS is also one of the heavyweights so it has played its part in the rally today.
Whereas NIFTY ended +150 points from the P Close, BANK NIFTY failed to register a +100. This is mainly on account of HDFC BANK so BANK NIFTY will be held back as long as HDFC BANK wishes.
What do you feel about this?
Thank you, and Happy Money Making!
Umesh
21-09-21
NOTE --
This write-up is not a prediction mechanism for the movement of Indices in the Indian markets as the markets are unpredictable in nature. I may refer to many data points in the article but I do not base my view on any of these standalone. In fact, I prefer to react to the price moves than predict the price moves. I also do not review Open Interest. Whatever data points I am using, are all stated in the article. The article title, as well as its contents, can at best be stated as --- This Is How I Read Nifty. I hope I have been able to set the expectations right.
---

hdfc long idea bullish harmoniclong only when good candle without wick closes above trendline target is 2892
good luck
HLong

HDFC bank Looks Good for 1800+Resistance 1635-50
Support - 1540-50
Target - 1800-1820
Avoid below 1500.

Long HDFCLong HDFC above 2841 TGT 2846-2848-2852 SL 2835. Looking to BO the range. this is for your educational purpose only.
HLong

Simple Trade Setup | HDFC | 17-09-2021NSE:HDFC
Trade Setup for Date 17-09-2021:
1) Don't Jump in to trade at the beginning of the market. Let it get settle for 15-20min first and judge the price action.
2) Everything is mentioned on the chart. I hope it is easy to understand.
3) All the levels will work as support, resistance, entry and exit w.r.t price action near that level.
Please refer below chart for levels.
Hope I made it easy to understand it.
Do comment your doubt or suggestion.
Note: Trade with Strict SL.
H

HLong
NIFTY batting at 17519 a record closing highNIFTY 50 EOD ANALYSIS -14-09-21
IN SUMMARY
O / H / L / C
17387.65 / 17532.7 / 17386.9 / 17519.45
H-L = 146 points
VIX 13.73 / +1.1%
FII DII: +399 Crores
Likely open: Flat to mild positive. Tomorrow is the weekly expiry so keen to see where does NIFTY ends and whether BANK NIFTY can cross 37000 or it yet again goes sideways.
CHART BASED CONCLUSIONS - 15 Minutes Chart
A mild gap-up open was sustained very well as can be seen from the chart and NIFTY ended the day close to the day high and above 17500.
The daily chart indicates that there was a strong buying that led the rise to the levels above 17500.
NIFTY WEIGHT LIFTERS & DRAGGERS
The Weight Lifters
INFOSYS 19
TCS 17
TITAN 12
BHARTI AIRTEL07 11
ICICI BANK 10
TOTAL 69
The Laggards
NESTLE 02
TATA CONSU 02
HDFC BANK 02
AXIS BANK 01
ASIAN PAINTS 01
TOTAL 08
Lifter - Draggers = +61
POSITIVES
NIFTY closed at a new ATH and also hit a new ATH.
And both are above 17500.
TCS, INFOSYS, and KOTAK BANK helped NIFTY to a great extent in holding on to the higher plains.
FIIs and DIIs have bought to the extent of 399 Crores which is somewhat less around such levels.
NEGATIVES
HDFC twins closed a bit below the P Close.
RELIANCE has not been able to hold higher levels closer to 2400 and keeps falling back below 2380.
BANK NIFTY is still below 37000 resistance which may drag NIFTY should HDFC BANK slide.
TRADING RANGE FOR 16-09-21
17300-17350 is the new support base. For the resistances, we will have to a few days go by to see how and where it gets formed.
BANK NIFTY support stays at 36200-400 and resistance at 37000-37200. This has not been changing for quite a few sessions now.
INSIGHTS / OBSERVATIONS
I think my insights of yesterday were read by NIFTY as it deceived all and made a steady climb to the psycho mark of 17500 and closed above the line.
If we look at the contribution of the yop 5 lifters of NIFTY it is 69 points and that of the draggers is 08. So the leaders net contributed 61 but NIFTY rose by 139 clearly indicating that the rally was well supported by the broader market.
BANK NIFTY also extended its daily range to 500+ points which helped NIFTY. If HDFC BANK recovers, then BANK NIFTY is likely to cross the 37K mark - the Q is - will the giant move upwards?
The NIFTY rise may have also been contributed by the Short Covering of 17400 CE as there was a good number of CE written as part of the ATM straddle.
What do you feel about this?
Thank you, and Happy Money Making!
Umesh
15-09-21
P.S. If you choose to comment on the above, please do so with your analytical view rather than merely passing a comment. Your presentation of the view held by you would help other readers as well.
NOTE --
This write-up is not a prediction mechanism for the movement of Indices in the Indian markets as the markets are unpredictable in nature. I may refer to many data points in the article but I do not base my view on any of these standalone. In fact, I prefer to react to the price moves than predict the price moves. I also do not review Open Interest. Whatever data points I am using, are all stated in the article. The article title, as well as its contents, can at best be stated as --- This Is How I Read Nifty. I hope I have been able to set the expectations right.

Looking good above 2840Looking good above 2840 if hold marked support
Either can buy 2840 CE for September series or can buy in cash. It is an positional view.
HLong
