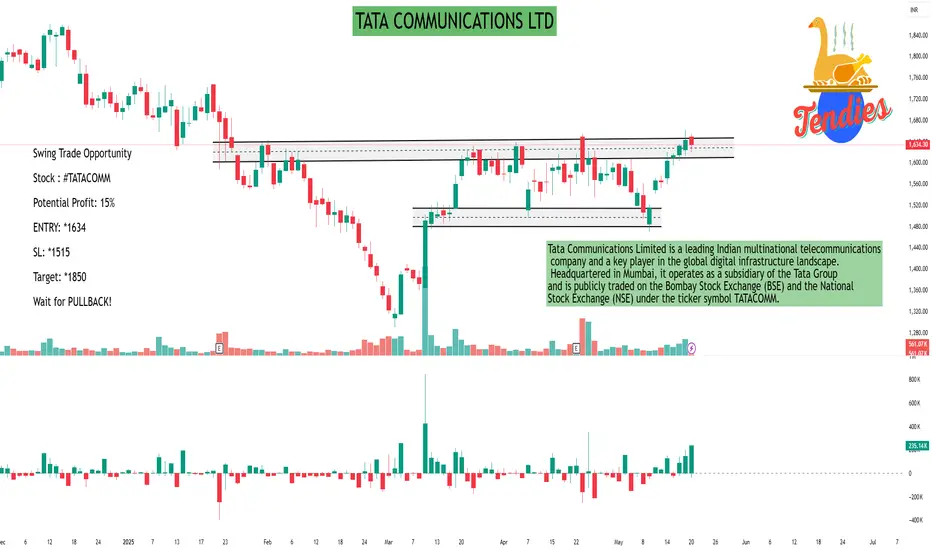
TATA COMMUNICATIONS LTDTata Communications Limited is a leading Indian multinational telecommunications company and a key player in the global digital infrastructure landscape. Headquartered in Mumbai, it operates as a subsidiary of the Tata Group and is publicly traded on the Bombay Stock Exchange (BSE) and the National Stock Exchange (NSE) under the ticker symbol TATACOMM.
🏢 Company Overview
Founded: 1986 as Videsh Sanchar Nigam Limited (VSNL); rebranded to Tata Communications in 2008.
Ownership: Majority-owned by Tata Group (58.87%), with the remaining shares held by public investors.
Global Reach: Operates in over 190 countries and territories, carrying approximately 30% of the world's internet routes.
Leadership:
MD & CEO: Amur Lakshminarayanan
Chairperson: Renuka Ramnath
🌐 Services & Solutions
Tata Communications positions itself as a digital ecosystem enabler, offering a comprehensive suite of services:
Network & Connectivity: Global IP networks, Ethernet, MPLS, and SD-WAN solutions.
Cloud & Edge Computing: Multi-cloud connectivity, edge computing platforms, and managed cloud services.
Cybersecurity: Advanced threat detection, cloud security, and managed security services.
Unified Communications: Solutions like GlobalRapide and JAMVEE for seamless collaboration.
IoT & Mobility: IoT connectivity solutions, including LoRaWAN and private networks.
Content Delivery: Robust CDN services for optimized content delivery.
These offerings cater to diverse industries, including automotive, manufacturing, logistics, aviation, and retail.
📈 Financial Highlights
In the first quarter of fiscal year 2024, Tata Communications reported:
Revenue: ₹56.33 billion (approx. $673.4 million), marking an 18% year-over-year increase.
Data Services Growth: 20% rise, contributing over 80% to total revenue.
Digital Portfolio Expansion: 52% growth, driven by increased demand for digital services.
Net Profit: ₹3.33 billion, a 13% decline due to a 20% rise in expenses.
EBITDA Margin: Contracted to 20% from 21.5% the previous year.
The company aims to achieve data business revenue of ₹280 billion by FY27, up from ₹178.98 billion in FY24.
🔄 Strategic Initiatives
Acquisition of Kaleyra: In October 2023, Tata Communications acquired Kaleyra, a Communications Platform as a Service (CPaaS) company, enhancing its capabilities in cloud communications and customer engagement.
Infrastructure Expansion: Continues to invest in subsea cable systems, including the Tata Global Network, to strengthen global connectivity.
Digital Transformation Focus: Emphasizes enabling digital transformation for enterprises, supporting borderless growth and innovation.
HDFC
USHA MARTIN LTD.USHA MARTIN LTD.
USHA MARTIN BREAKS OUT! 7.5% SURGE SIGNALS MASSIVE RALLY AHEAD
USHAMART
Made Beautiful Chart Structure of Kinda Triple Bottom Reversal Pattern today after Q4 Results with Good Price and Volume action and Breaking the Trendline.
Price Action:
-The stock has been in a downtrend since November 2024, forming a clear descending resistance line (white diagonal Trendline)
-Currently showing strong breakout momentum at ₹334.85, up *23.75 (+7.46%) in today's session
-Successfully broken above both the downtrend line and horizontal resistance at *320-325
-Multiple tests of support at the *290 level have created a solid base for the current rally
-Higher lows forming since March indicate increasing buying pressure
Volume Analysis:
- Today's volume at 4.98M shares vs. average of 688.65K (over 7x normal volume) -Previous support bounces (green arrows) also occurred with increased volume - Extremely high volume on today's breakout confirms strong institutional interest - Volume profile shows healthy accumulation during support tests
Key Support and Resistance Levels:
- Strong support established at *290 level (green horizontal line)
- Intermediate resistance/support at *320-325 (lower red horizontal line)
-Major resistance at *350 level (upper red horizontal line)
- The previous rejection point at ₹350 (red arrow) now becomes the next target
- Long-term resistance from October to December 2024 around *420
Technical Patterns:
1. Downtrend Line Breakout*- Price has decisively broken above the multi-month downtrend line
2. Kinda Triple Bottom- Formed at ₹290 level (February-May), creating a solid foundation
3. Ascending Triangle- Recent price action shows higher lows against horizontal resistance
4. Volume Confirmation- Massive volume spike validates the technical breakout
5. Bullish Engulfing Candle-Today's price action engulfs previous bearish candles
Trade Setup:
- Pattern: Downtrend line breakout + horizontal resistance break
- Confirmation: Strong price action with 7x normal volume
- Context: Potential trend reversal after extended downtrend and base formation
Entry Points:
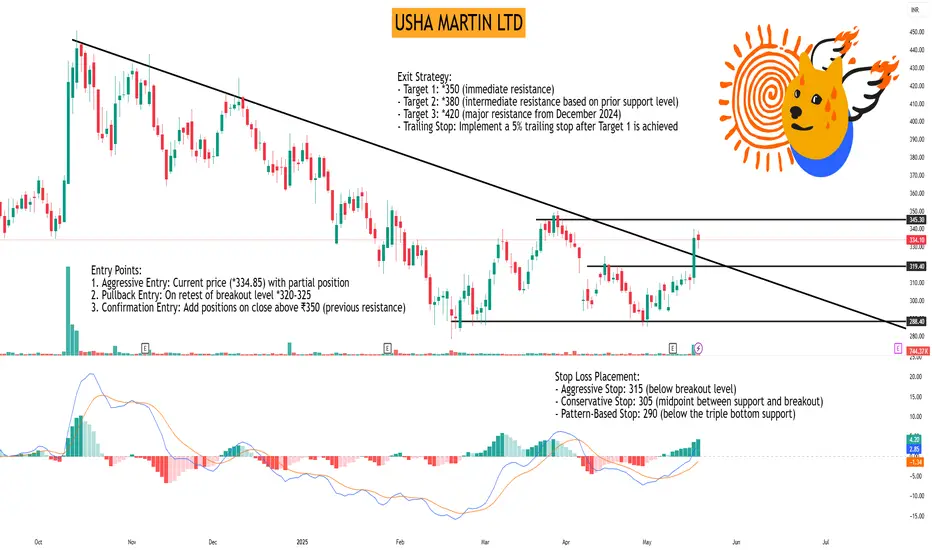
1. Aggressive Entry: Current price (*334.85) with partial position
2. Pullback Entry: On retest of breakout level *320-325
3. Confirmation Entry: Add positions on close above ₹350 (previous resistance)
Exit Strategy:
- Target 1: *350 (immediate resistance)
- Target 2: *380 (intermediate resistance based on prior support level)
- Target 3: *420 (major resistance from December 2024)
- Trailing Stop: Implement a 5% trailing stop after Target 1 is achieved
Stop Loss Placement:
- Aggressive Stop: 315 (below breakout level)
- Conservative Stop: 305 (midpoint between support and breakout)
- Pattern-Based Stop: 290 (below the triple bottom support)
Risk Management:
- Position sizing: Limit risk to 1-2% of trading capital
-Risk-reward ratio: Maintain at least 1:1.5 (with aggressive stop)
- Consider scaling in: 50% at current level, 25% on pullback, 25% on further confirmation
- Scale out: 30% at Target 1, 40% at Target 2, hold remainder with trailing stop
Today's powerful breakout on record volume after forming a kinda triple bottom pattern suggests a potential trend reversal. The breakout above both the descending trendline and horizontal resistance provides a compelling technical case for upside continuation. If the stock can maintain momentum above the *325 level, it could target the next resistance at ₹350 quickly, with potential for a move toward *380-420 in the coming weeks.
Keep in the Watchlist.
NO RECO. For Buy/Sell.
Thank you for exploring my idea! I hope you found it valuable.
FLLOW for more
BOOST if useful
COMMENT below with your views.
Meanwhile, check out my other stock ideas on the right side until this trade is activated. I would love your feedback.
Disclaimer: "I am not a SEBI REGISTERED RESEARCH ANALYST AND INVESTMENT ADVISER."
This analysis is intended solely for informational and educational purposes and should not be interpreted as financial advice. It is advisable to consult a qualified financial advisor or conduct thorough research before making investment decisions.
DIVI S LABORATORIES LTDDIVI S LABORATORIES LTD
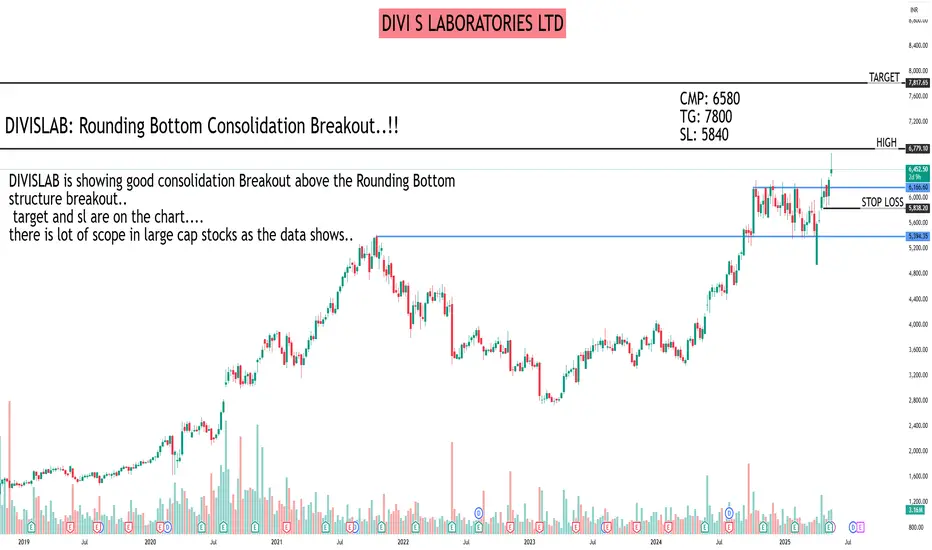
DIVISLAB: Rounding Bottom Consolidation Breakout..!!
DIVISLAB is showing good consolidation Breakout above the Rounding Bottom
structure breakout..
target and sl are on the chart....
there is lot of scope in large cap stocks as the data shows..
All data is available in public domain..
CMP: 6580
TG: 7800
SL: 5840
Stock's selection based on 5 Point Analysis:
1: Idea : Breakout.
2: Support: Volume, Delivery.
3: Technical: 21/55/200-EMA, Super trend up, RS>0 RSI.
4: Fundamental: PE, PAT, Industry & peer PE and sector performance.
5: Timing: Entry Timing on Daily chart.
Disclaimer: It is my personal view as a trader and for educational purpose only. Equity market involves risk.
Please consult your financial adviser before taking any decision.
Disclosure: might be Hold
Management and Psychology Trading psychology refers to the emotional and mental state influencing a trader's decisions. It involves managing emotions like fear and greed, which can impact rational judgment and risk-taking, thus affecting trading outcomes. A disciplined mindset helps traders make logical decisions under pressure.

Institutional Level Trading part 3The buying and selling of financial assets are conducted by sizable entities, including banks, credit unions, pension funds, hedge funds, and mutual funds, in the process known as institutional trading.

Class for Advanced Trading part 2A trade advance, also known as a trade loan, is a form of financing that facilitates international trade by providing liquidity to businesses. It helps businesses manage their cash flow during international transactions by offering access to funds before or during the payment cycle.

Class for Advanced Trading Advanced trading strategies usually involve multiple technical indicators and more complicated instruments, such as options and futures.

Technical Conpet"Technical Concept" refers to a specialized knowledge or understanding of technical aspects, often within a particular field like engineering, computer science, or a specific industry. It's not a standardized term with a single, fixed meaning, but rather a concept that can be interpreted in various ways depending on the context.

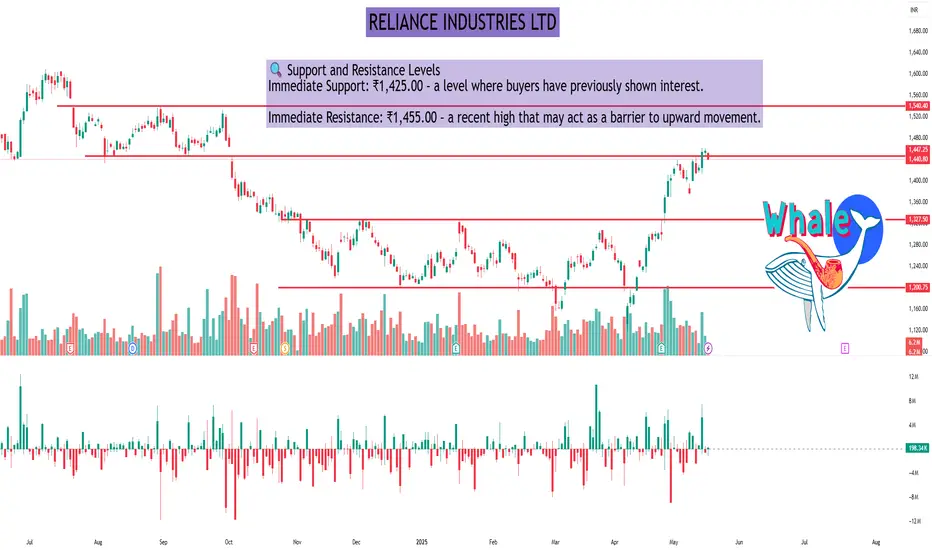
RELIANCE INDUSTRIES LTDAs of the close on Monday, May 19, 2025, Reliance Industries Ltd (NSE: RELIANCE) traded at ₹1,440.80, reflecting a 1.07% decrease from the previous session.
📊 Daily Technical Overview
Price Action:
Opening Price: ₹1,452.10
Day's Range: ₹1,438.20 – ₹1,454.60
52-Week Range: ₹1,114.85 – ₹1,608.80
Volume: Approximately 6.2 million shares traded, below the 50-day average of 8.4 million, indicating reduced market activity.
Technical Indicators:
Relative Strength Index (RSI): 69.84 – approaching overbought territory, suggesting caution.
Moving Average Convergence Divergence (MACD): Bullish crossover, indicating potential upward momentum.
Stochastic Oscillator: 76.17 – in the overbought zone, which may precede a price correction.
Average Directional Index (ADX): Indicates a strong trend, supporting the current price movement.
🔍 Support and Resistance Levels
Immediate Support: ₹1,425.00 – a level where buyers have previously shown interest.
Immediate Resistance: ₹1,455.00 – a recent high that may act as a barrier to upward movement.
🔭 Outlook
The technical indicators suggest that Reliance Industries Ltd is experiencing a strong bullish trend. However, the RSI and Stochastic Oscillator indicate that the stock is nearing overbought conditions, which could lead to a short-term consolidation or minor correction. Investors should monitor the support and resistance levels closely and consider the reduced trading volume, which may affect the strength of the current trend.
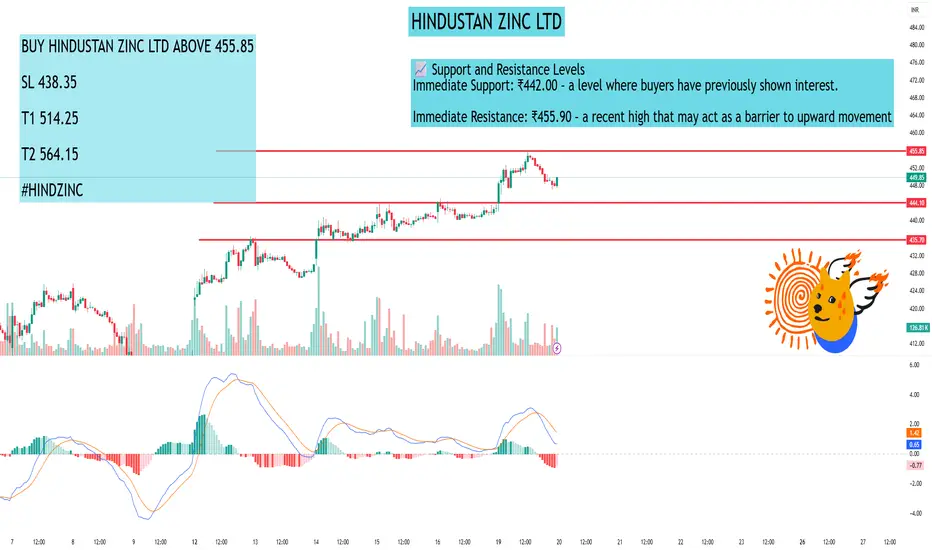
HINDUSTAN ZINC LTDAs of the close on Monday, May 19, 2025, Hindustan Zinc Ltd (NSE: HINDZINC) was trading at ₹448.20, reflecting a 1.33% increase from the previous session.
📊 15-Minute Timeframe Technical Overview
Analyzing the 15-minute chart, the stock exhibits a mild bullish trend:
Price Action: The current price is ₹428.25.
Moving Averages:
The 5-period Exponential Moving Average (EMA) is at ₹440.66.
The 15-period EMA stands at ₹435.01.
The 50-period EMA is at ₹435.91.
The 100-period EMA is at ₹446.19.
The 15-period EMA trending above the 50-period EMA indicates a bullish crossover.
Trend Analysis: The 5 and 15 EMAs are on an upward trajectory, suggesting a mild bullish sentiment in the short term.
🔍 Technical Indicators
Relative Strength Index (RSI): The RSI is approximately 56.70, indicating a neutral momentum without being overbought or oversold.
Moving Average Convergence Divergence (MACD): The MACD is at 0.811, suggesting a bullish crossover.
Average Directional Index (ADX): The ADX is at 13.22, indicating a weak trend strength.
Stochastic Oscillator: The Stochastic Oscillator is at 63.96, pointing to neutral momentum.
Indicator: The supertrend is at ₹406.99, acting as a support level.
Parabolic SAR (PSAR): The PSAR is at ₹400.77, indicating an upward trend.
📈 Support and Resistance Levels
Immediate Support: ₹442.00 – a level where buyers have previously shown interest.
Immediate Resistance: ₹455.90 – a recent high that may act as a barrier to upward movement.
🔭 Outlook
The current indicators suggest a cautious approach:
If the price sustains above ₹442.00, there may be potential for a rebound towards ₹455.90.
Conversely, a drop below ₹442.00 could lead to further declines, possibly testing lower support levels.
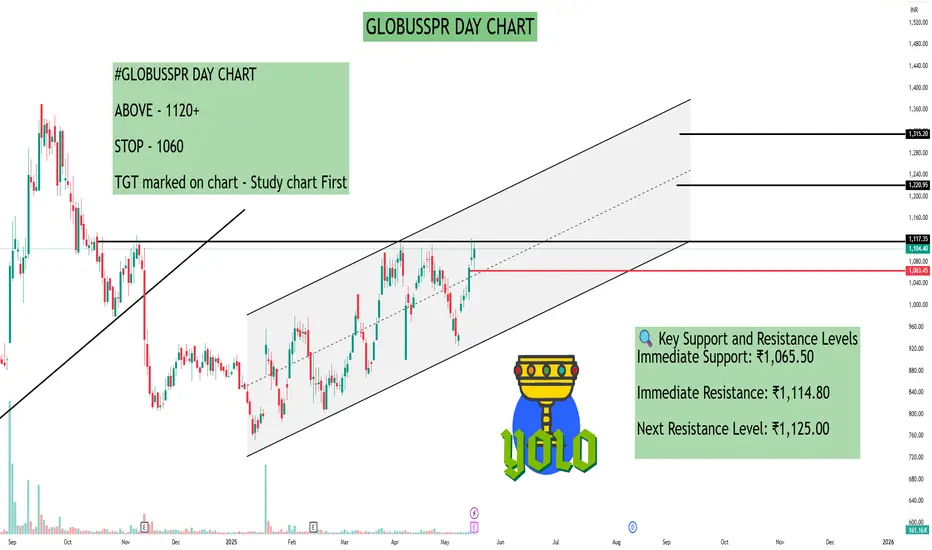
GLOBUSSPR DAY CHARTAs of the close on Monday, May 19, 2025, Globus Spirits Ltd (NSE: GLOBUSSPR) traded at ₹1,104.40, reflecting a 1.62% increase from the previous session.
📊 Daily Technical Overview
Price Action:
Day's Range: ₹1,065.50 – ₹1,114.80
52-Week Range: ₹670.00 – ₹1,369.75
Volume: 161,165 shares traded
Technical Indicators:
Relative Strength Index (RSI): 61.68 – indicating neutral to slightly bullish momentum.
Moving Average Convergence Divergence (MACD): 6.03 – suggesting a bullish crossover.
Average Directional Index (ADX): 15.29 – indicating a weak trend strength.
Stochastic Oscillator: 62.44 – pointing to neutral momentum.
Indicator: ₹957.02 – acting as a support level.
Parabolic SAR (PSAR): ₹927.02 – indicating an upward trend.
🔍 Key Support and Resistance Levels
Immediate Support: ₹1,065.50
Immediate Resistance: ₹1,114.80
Next Resistance Level: ₹1,125.00
📈 Outlook
The technical indicators suggest that Globus Spirits Ltd is experiencing a mild bullish trend. The RSI and MACD indicate positive momentum, while the ADX suggests that the trend strength is currently weak. If the stock maintains its position above the immediate support level of ₹1,065.50, it may attempt to break through the resistance at ₹1,114.80. A successful breakout could lead to testing the next resistance level at ₹1,125.00.
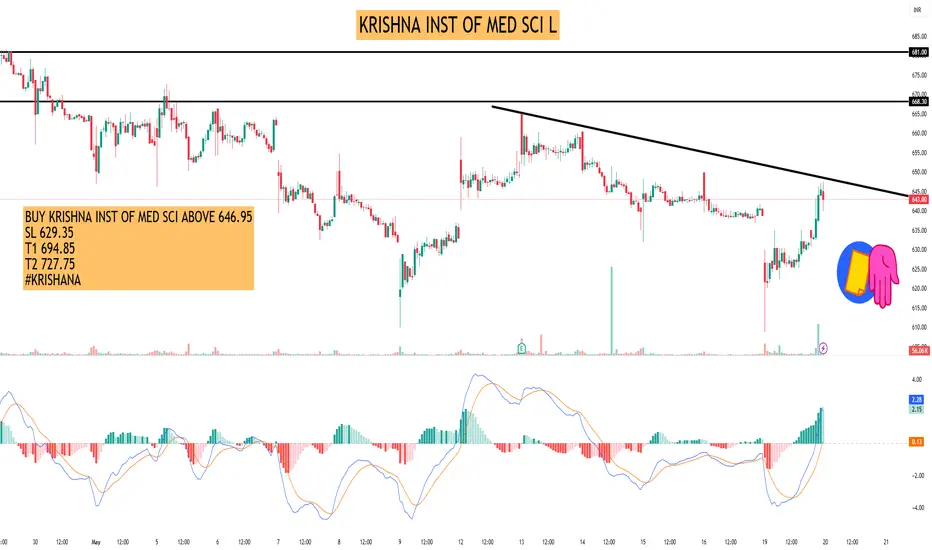
KRISHNA INST OF MED SCI LAs of the close on Monday, May 19, 2025, Krishna Institute of Medical Sciences Ltd (NSE: KIMS) traded at ₹645.10, marking a 0.75% increase from the previous session.
📊 15-Minute Timeframe Technical Overview
Analyzing the 15-minute chart, the stock exhibits a mild bearish trend:
Price Action: The current price is ₹535.65.
Moving Averages:
The 5-period Weighted Moving Average (WMA) is at ₹535.65.
The 15-period WMA stands at ₹536.93.
The 100-period WMA is at ₹542.10.
The 15-period WMA trending below the 100-period WMA indicates a bearish crossover.
Trend Analysis: Both the 5 and 15 WMAs are on a downward trajectory, suggesting a mild bearish sentiment in the short term.
🔍 Technical Indicators
Relative Strength Index (RSI): The 14-day RSI is approximately 54.7, indicating a neutral momentum without being overbought or oversold.
Volume: The trading volume is around 507,339 shares, significantly higher than the 20-day average of 91,758 shares, pointing to increased market activity.
📈 Support and Resistance Levels
Support: ₹640.00 – a level where buyers have previously shown interest.
Resistance: ₹650.00 – a recent high that may act as a barrier to upward movement.
🔭 Outlook
The current indicators suggest a cautious approach:
If the price sustains above ₹640.00, there may be potential for a rebound towards ₹650.00.
Conversely, a drop below ₹640.00 could lead to further declines, possibly testing lower support levels.
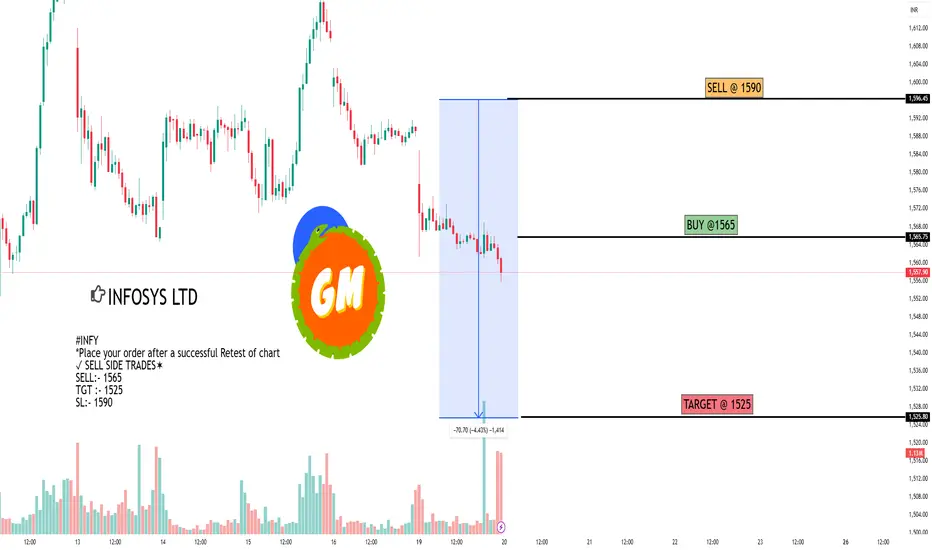
INFOSYS LTDAs of the close on Monday, May 19, 2025, Infosys Ltd (NSE: INFY) traded at ₹1,559.80, reflecting a decrease of ₹30.10 or 1.89% from the previous session.
In the 15-minute timeframe, the stock exhibited a downward trend throughout the day, with prices ranging between ₹1,555.70 and ₹1,585.00.
Technical Indicators (15-Minute Timeframe):
Moving Averages: The 20-period Exponential Moving Average (EMA) is trending downward, indicating short-term bearish momentum.
Relative Strength Index (RSI): The RSI is hovering around 45, suggesting that the stock is approaching oversold territory but hasn't reached it yet.
Support Levels: Immediate support is observed around ₹1,550, with a stronger support level near ₹1,540.
Resistance Levels: The stock faces resistance at ₹1,570, followed by a more significant resistance near ₹1,585.
Outlook:
If Infosys maintains its position above the ₹1,550 support level, a short-term rebound towards ₹1,570 is possible. However, a break below ₹1,550 could lead to further declines, potentially testing the ₹1,540 support.
Support and Resistance part 1In stock market technical analysis, support and resistance are certain predetermined levels of the price of a security at which it is thought that the price will tend to stop and reverse. These levels are denoted by multiple touches of price without a breakthrough of the level.

Support and Resistance part 2Support is a price point below the current market price that indicate buying interest. Resistance is a price point above the current market price that indicate selling interest. S&R can be used to identify targets for the trade. For a long trade, look for the immediate resistance level as the target.

Institutional Trading Part 4Institutional trading involves the buying and selling of securities by large financial institutions on behalf of clients or for their own account. These institutions include hedge funds, mutual funds, pension funds, insurance companies, and banks. They often engage in larger-scale trades and have access to more complex financial instruments than retail investors.

Learn Institutional Level Trading part 6The buying and selling of financial assets are conducted by sizable entities, including banks, credit unions, pension funds, hedge funds, and mutual funds, in the process known as institutional trading.

Database Trading part 3Trading data is typically collected from stock exchanges such as the New York Stock Exchange (NYSE) or NASDAQ. This can be a useful source for trades that are made over the listed exchanges and can provide many different data poitns, such as trade prices and times.

MACD part 2Moving average convergence/divergence (MACD) is a technical indicator to help investors identify price trends, measure trend momentum, and identify entry points for buying or selling. Moving average convergence/divergence (MACD) is a trend-following momentum indicator that shows the relationship between two exponential moving averages (EMAs) of a security’s price. MACD was developed in the 1970s by Gerald Appel, and is one of the most popular technical tools, readily available on most trading platforms offered by online stock brokers.

What is Moving Average Convergence Divergence (MACD) ?The Moving Average Convergence Divergence (MACD) is a momentum indicator used in technical analysis to identify changes in the strength, direction, momentum, and duration of a trend in a stock or other asset's price. It's essentially a bar chart that visually displays the relationship between two moving averages of a price series.

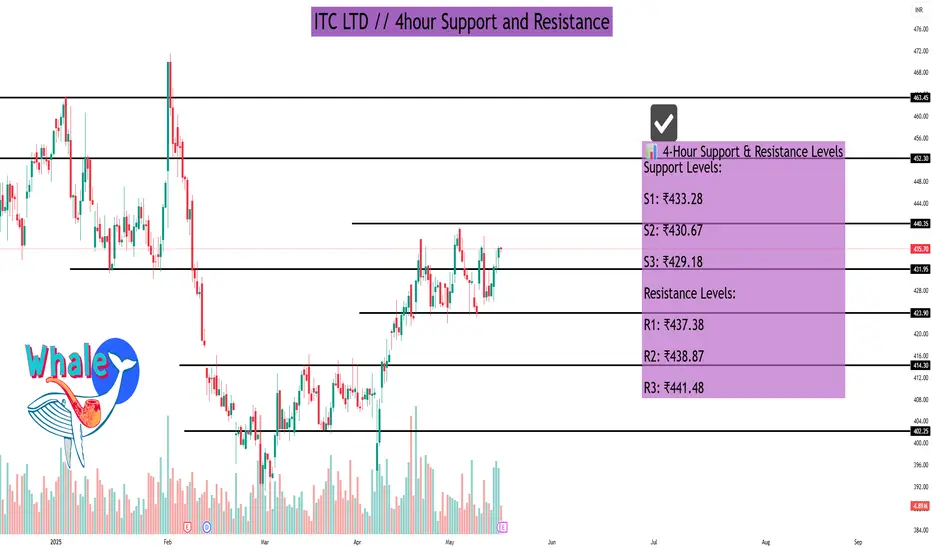
ITC LTD As of May 16, 2025, ITC Ltd. (NSE: ITC) is trading around ₹435.70. Analyzing the 4-hour timeframe, the following support and resistance levels have been identified based on various technical indicators:
📊 4-Hour Support & Resistance Levels
Support Levels:
S1: ₹433.28
S2: ₹430.67
S3: ₹429.18
Resistance Levels:
R1: ₹437.38
R2: ₹438.87
R3: ₹441.48
These levels are derived from pivot point calculations and can serve as potential areas where the price might experience support or resistance.
🔍 Technical Indicators Overview
Relative Strength Index (RSI): 58.98 – Indicates neutral momentum.
Moving Average Convergence Divergence (MACD): 3.86 – Suggests mild bullish momentum.
Average Directional Index (ADX): 17.89 – Points to a weak trend strength.
Stochastic Oscillator: 51.37 – Reflects neutral conditions.
Supertrend Indicator: ₹413.32 – Below current price, indicating a bullish signal.
Parabolic SAR: ₹437.35 – Slightly above current price, suggesting potential resistance.
📈 Fibonacci Retracement Levels
Considering the downtrend from ₹491.00 (Jan 3, 2025) to ₹390.15 (Apr 7, 2025), the key Fibonacci retracement levels are:
23.6%: ₹413.95
38.2%: ₹428.67
50%: ₹440.57
61.8%: ₹452.48
76.4%: ₹467.20
These levels can act as potential support or resistance zones as the price retraces its previous move.
🧠 Trading Insights
The current price is approaching the R1 resistance level at ₹437.38.
If the price breaks above this level with strong volume, it may test higher resistance levels.
Conversely, if it fails to break through, it might retrace to the support levels mentioned above.
Traders should monitor these levels closely and consider using stop-loss orders to manage risk.
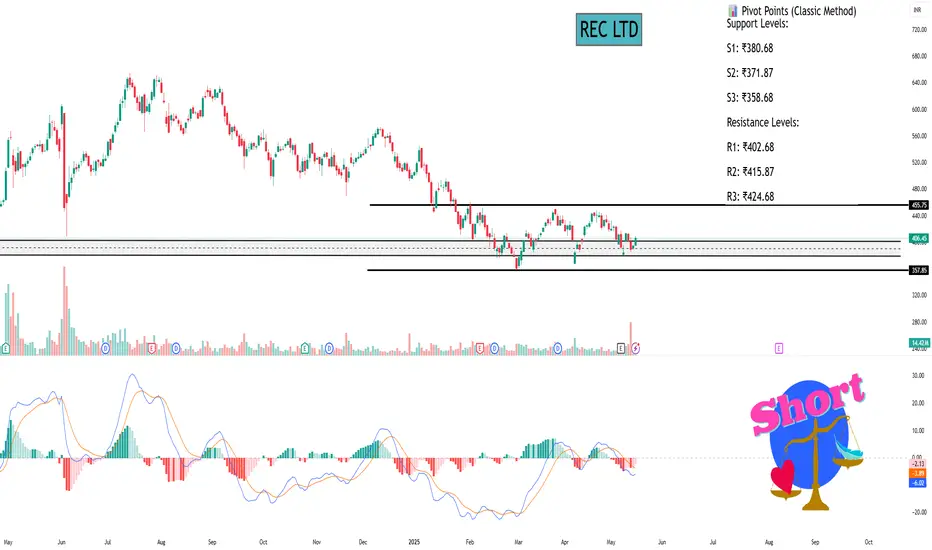
REC LTDAs of May 16, 2025, REC Ltd. (NSE: RECLTD) demonstrated a positive movement on the daily chart, with the stock closing at ₹406.45, marking a 3.07% increase from the previous close of ₹394.35. The day's trading range spanned from a low of ₹395.10 to a high of ₹409.65, with a substantial trading volume of approximately 14.4 million shares, indicating heightened investor interest.
📈 Technical Indicators (Daily Timeframe)
Relative Strength Index (RSI): 53.25 – Positioned in the neutral zone, suggesting neither overbought nor oversold conditions.
Moving Average Convergence Divergence (MACD): 0.37 – A positive value indicating bullish momentum, albeit modest.
Money Flow Index (MFI): 58.15 – Reflects moderate buying pressure, aligning with the day's positive price movement.
Average Directional Index (ADX): 31.99 – Suggests a developing trend strength, which traders should monitor for potential continuation or reversal.
Stochastic Oscillator (20,3): Approximately 55–80 – Indicates a bullish condition, but approaching overbought territory, warranting caution.
Commodity Channel Index (CCI): Positive territory – Signifies that the stock is trading above its average price, supporting the bullish outlook.
📊 Pivot Points (Classic Method)
Support Levels:
S1: ₹380.68
S2: ₹371.87
S3: ₹358.68
Resistance Levels:
R1: ₹402.68
R2: ₹415.87
R3: ₹424.68
The stock's closing price is above the first resistance level (R1), suggesting potential to test higher resistance levels if bullish momentum continues.
🔍 Trend Analysis
Recent technical assessments indicate that REC Ltd. may be entering a critical phase. A head and shoulders pattern was identified on the daily chart, with a breakout observed on March 19, 2024. This pattern typically signals a potential reversal, and the breakout was accompanied by increased trading volume and a bearish signal on the MACD indicator. Currently, the RSI is at a low level, and sustained momentum from the breakout may lead to further downward movement.
⚠️ Investor Considerations
Volatility: The stock has a beta of approximately 2.01, indicating higher volatility compared to the broader market.
Valuation Metrics:
P/E Ratio: 6.74 – Suggests the stock is trading at a relatively low multiple compared to the industry average.
P/B Ratio: 1.35 – Indicates a reasonable valuation in terms of book value.
Dividend Yield: 4.43% – Reflects a strong return to shareholders.
52-Week Range: ₹127.40 – ₹654.00 – The current price is significantly below the 52-week high, offering potential upside if the stock rebounds.
📌 Summary
REC Ltd.'s recent price action and technical indicators suggest a cautiously optimistic outlook. While the stock has shown a positive movement, the presence of a head and shoulders pattern and other technical signals warrant careful monitoring. Investors should watch for confirmation of trend continuation or reversal, particularly around the identified support and resistance levels.
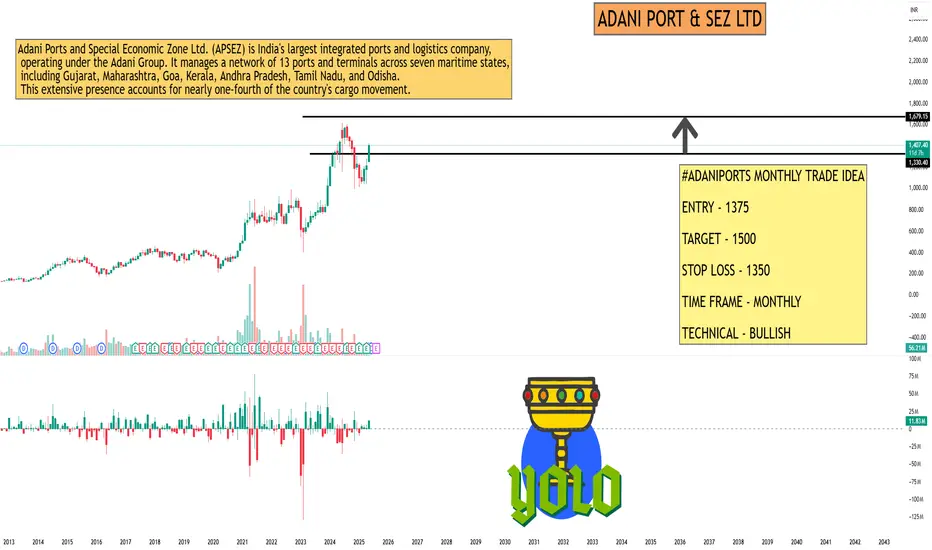
ADANI PORT & SEZ LTDAs of May 16, 2025, Adani Ports and Special Economic Zone Ltd. (NSE: ADANIPORTS) continues to exhibit a bullish trend on the monthly timeframe, supported by key technical indicators and significant price movements.
📊 Monthly Technical Overview
Current Price: ₹1,407.40
1-Month Gain: +16.31%
52-Week Range: ₹703.00 – ₹1,621.40
All-Time High: ₹1,621.40 (June 3, 2024)
📈 Key Technical Indicators
Relative Strength Index (RSI): 68.19 – Approaching overbought territory, indicating strong buying momentum.
MACD: +6.97 – Positive value suggests bullish momentum.
Stochastic Oscillator: 88.40 – In overbought zone, which may signal a potential pullback.
Commodity Channel Index (CCI): 252.86 – Indicates the stock is overbought.
Williams %R: -19.29 – Also suggests overbought conditions.
Average Directional Index (ADX): 16.45 – Points to a weak trend strength, implying that while the trend is upward, it may not be strongly established.
🧮 Moving Averages
10-Day EMA: ₹235.52
20-Day EMA: ₹229.64
50-Day EMA: ₹220.86
100-Day EMA: ₹222.11
200-Day EMA: ₹244.28
The current price is trading well above all key EMAs, reinforcing the bullish outlook.
📌 Pivot Points (Classic Method)
Support Levels:
S1: ₹239.67
S2: ₹233.63
S3: ₹229.72
Resistance Levels:
R1: ₹249.62
R2: ₹253.53
R3: ₹259.57
The stock is nearing R1, and a breakout above this could lead to testing R2 and R3.
💡 Summary
Adani Ports & SEZ Ltd. demonstrates strong bullish momentum on the monthly timeframe, trading above key moving averages and supported by high trading volumes. However, several indicators suggest overbought conditions, which may lead to short-term consolidation or a minor pullback. Investors should monitor the stock's movement around the ₹1,407–₹1,621 range for potential resistance and watch for confirmation before making new entries.