HDFCAMC - Demand Reclaim, Institutional Participation Visible💹 HDFC Asset Management Co. Ltd (NSE: HDFCAMC)
Sector: Financial Services – Asset Management | CMP: 2723
View: Bullish — Demand Reclaim, Institutional Participation Visible
HDFCAMC has staged a sharp recovery from its lower demand zone, supported by a strong bullish candle and clear volume expansion, signalling renewed buying interest rather than a dead-cat bounce. The recent move has helped the stock reclaim short-term positional levels after a corrective phase, indicating that supply pressure seen earlier has started to ease. Price behaviour now reflects acceptance above demand, which is a constructive sign for follow-through.
From a structural standpoint, the broader trend remains up, with the recent decline appearing corrective within a larger framework rather than trend-damaging. RSI near 57.5 sits in a healthy zone — comfortably above neutral but well below overbought territory — allowing room for continuation if momentum sustains. Stochastic has reset from elevated levels, while MACD behaviour points toward renewed bullish momentum instead of exhaustion. ADX suggests trend strength is improving, hinting at a possible transition from consolidation back into expansion.
Volume dynamics are a key positive. With Vol-X above 3, participation during the recent up-move reflects institutional involvement rather than retail-led volatility. The absence of panic selling during the prior decline and the presence of strong demand absorption increase the probability that the stock is resuming its primary trend rather than entering a prolonged range.
Key price references indicate immediate overhead resistance clustered around the 2765–2810 zone, with a higher supply band near 2890–3000 acting as a broader ceiling. On the downside, structural supports are placed near 2640, followed by 2558 and 2515, defining the current risk envelope. Sustained acceptance above the near-term resistance band would strengthen bullish confidence, while failure to hold above reclaimed levels could lead to range-bound consolidation.
Demand Reclaim, Institutional Participation Visible
On the derivatives side, near-ATM option activity is referenced strictly for analytical insight into positioning behaviour. CALL-side data shows long build-up with strong volume and open-interest expansion, reflecting directional participation aligned with price. PUT-side activity is largely defensive, with short-covering dominating rather than fresh aggressive bearish positioning. Implied volatility remains in a low-to-moderate band, favouring controlled directional structures over fear-driven trades. Overall, derivatives behaviour aligns with a continuation-biased environment, conditional on price follow-through.
Structure quality metrics reinforce this view. The STWP Edge Score remains high, indicating strong alignment between price action, volume, and options positioning. Liquidity is concentrated near the ATM zone, supporting efficient participation, though directional options remain sensitive to time decay if momentum stalls — reinforcing the need for disciplined risk management.
Overall, HDFCAMC appears to be resuming its primary uptrend after a corrective phase, with improving momentum and visible institutional participation. While overhead resistance may induce short-term pauses, the broader structure remains constructive as long as price holds above key demand levels.
Final Outlook (Educational Snapshot):
Momentum: Moderate| Trend: Developing | Risk: High | Volume: Very High
⚠️ STWP Legal Disclaimer
This document is strictly for educational and informational purposes. All examples, charts, levels, and option structures discussed are illustrative and are not intended as buy, sell, or hold recommendations. STWP does not provide investment advice, trading tips, signals, or personalized financial guidance of any kind, nor is it a SEBI-registered intermediary or research analyst. The analyses, illustrations, and risk–reward structures included here are generic in nature and based on publicly available data and observed market behaviour, which may change without notice. Financial markets involve significant risk; derivatives in particular carry the potential for substantial losses. Option premiums, implied volatility, open interest, delta, and other market variables can fluctuate rapidly and unpredictably.
Readers are solely responsible for their trading decisions, capital management, and risk assessment. Before making any investment or trading decision, please consult a SEBI-registered investment advisor. STWP, its representatives, and affiliates shall not be liable for any direct or indirect loss arising from the use of this material. Historical patterns or past market behaviour do not guarantee future outcomes, nor should any part of this document be interpreted as a promise of performance, accuracy, or returns.
Position Status: No active position in this instrument at the time of analysis.
Data Source: TradingView & NSE India.
💬 Found this useful?
🔼 Boost this post to support structured learning
✍️ Share your thoughts or questions in the comments
🔁 Forward this to traders who value clean technical studies
👉 Follow for disciplined, structured, STWP-style analysis
🚀 Stay Calm. Stay Clean. Trade With Patience.
Trade Smart | Learn Zones | Be Self-Reliant 📊
HDFCAMC

HDFC AMC LTD | Bullish Momentum + Possible Breakout📈 HDFC AMC LTD | Bullish Momentum + Possible Breakout 🚀
🔹 Bullish Breakout Zone: 5,660 – 5,685
🔹 Stop Loss: 5,633 (Risk ~₹52)
🔹 Supports: 5,584 / 5,499 / 5,448
🔹 Resistances: 5,719 / 5,770 / 5,855
🔑 Key Highlights
HDFC AMC has formed a strong bullish candle with a notable volume surge, clearly confirming aggressive buying interest. The RSI breakout signals a shift in momentum after a prolonged consolidation phase, indicating that the stock is gaining renewed strength. Additionally, a Bollinger Band Squeeze-Off pattern is visible, suggesting a potential volatility expansion and a short-term breakout on the upside. The spike in trading volume further reinforces the bullish sentiment, hinting at possible institutional participation behind this move.
🎯 STWP Trade View
📊 Price has reclaimed control above near-term resistances with improving momentum.
A sustained close above ₹5,719 can trigger a move toward ₹5,770–₹5,855 levels in the short term.
Pullbacks toward ₹5,640–₹5,660 may offer favorable entry zones with tight risk control.
⚠️ Supports at ₹5,584 and ₹5,499 remain crucial for maintaining the swing structure and protecting positions.
________________________________________
📊 Final Outlook
Momentum: 🔥 Strong
Trend: 📉 Bearish (but reversing)
Risk: 🟢 Low
Volume: 📈 High
________________________________________
💡 Learning Note
This setup demonstrates the power of confluence — RSI breakout + BB squeeze + volume surge.
Such multi-signal alignments often mark the start of a momentum phase, offering early entry opportunities before a confirmed breakout rally.
________________________________________
________________________________________
⚠️ Disclosure & Disclaimer – Please Read Carefully
The information shared here is meant purely for learning and awareness. It is not a buy or sell recommendation and should not be taken as investment advice. I am not a SEBI-registered investment adviser, and all views expressed are based on personal study, chart patterns, and publicly available market data.
Trading—whether in stocks or options—carries risk. Markets can move unexpectedly, and losses can sometimes exceed the money you have invested. Past performance or past setups do not guarantee future results.
If you are a beginner, treat this as a guide to understand how the market works and practice on paper trades before risking real money. If you are experienced, always assess your own risk, position sizing, and strategy suitability before entering trades.
Consult a SEBI-registered financial adviser before making any real trading decision. By engaging with this content, you acknowledge full responsibility for your trades and investments.
Position Status: No active position in HDFCAMC at the time of analysis.
Data Source: TradingView & NSE India (Past Chart Reference) (Historical levels)
💬 Found this useful?
🔼 Give this post a Boost to help more traders discover clean, structured learning.
✍️ Drop your thoughts, questions, or setups in the comments — let’s grow together!
🔁 Share with fellow traders and beginners to spread awareness.
👉 “If you liked this breakdown, follow for more clean, structured setups with discipline at the core.”
🚀 Stay Calm. Stay Clean. Trade With Patience.
Trade Smart | Learn Zones | Be Self-Reliant 📊
Hdfc created Double Top Formation- Stock has given big rally
- stock has pause it's uptrend and
created Double Top
- below 5600 one can watch for down movement
until it reaches previous support levels
which are 5400 to 5450 levels
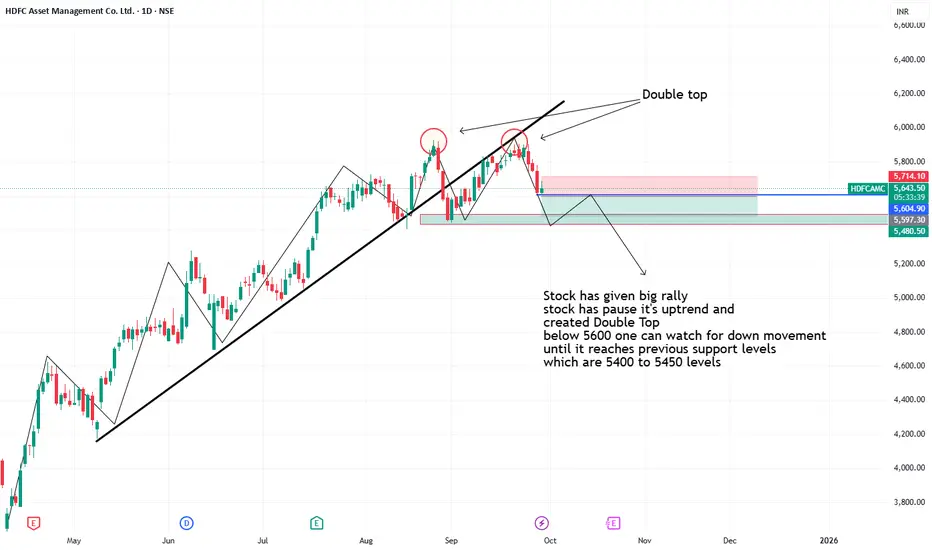
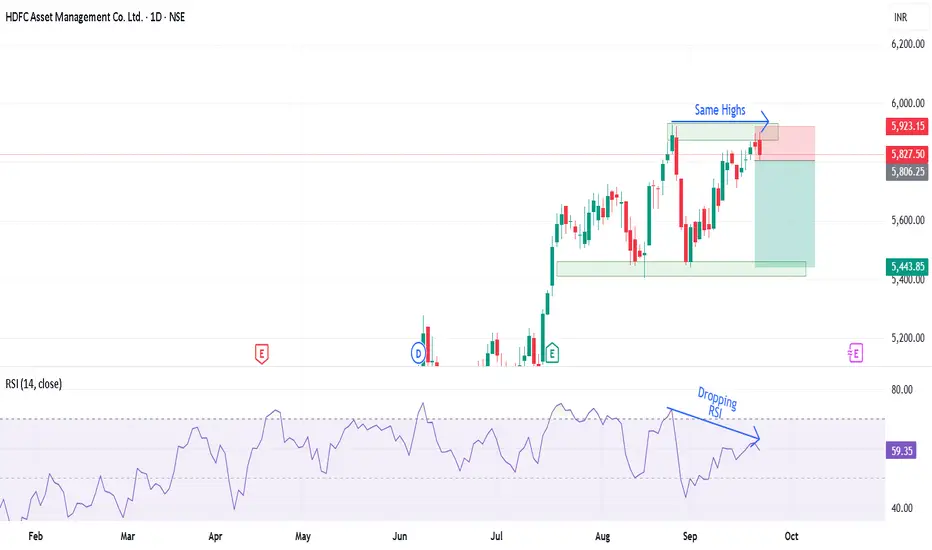
Double Top at the Peak: Is a Bearish Reversal Coming in HDFC AMCHDFC AMC has given a good upside rally of 65% and is form a double top pattern.
The stock is following a bullish trendline but the RSI divergence is creating a bearish sentiment supported by the drop India VIX.
If the stock breaks below the trendline, a bearish trade can be entered with the first target of 5440 following it to 5208.
Bullishness will only be confirmed only once the stock starts trading above 6000 levels.
There is RSI divergence on the higher time frame too and gives more convincing trade in the stock.
Entry :- Below 5809
Target :- 5440 and 5208
Stop Loss :- Close above 5927 (daily charts)
Wait for the price action and trade accordingly.
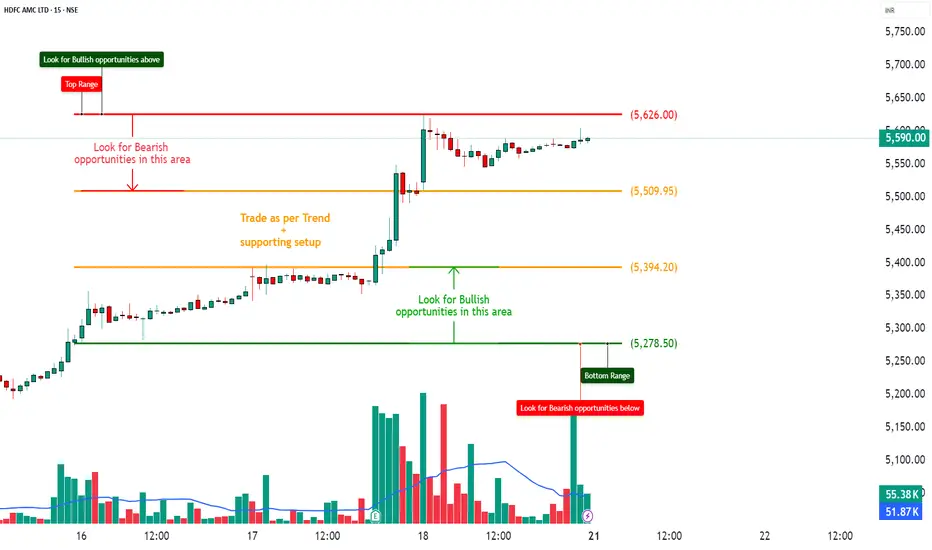
HDFCAMC – Bullish Momentum with Short Covering Base________________________________________________________________________________📈 HDFCAMC – Bullish Momentum with Short Covering Base
📅 Setup Date: 18.07.2025 | ⏱ Timeframe: Daily
📍 Strategy: Momentum Trade Setup with Defined Risk
________________________________________________________________________________
🔍 Overall View
Spot Price: ₹5590
Trend: Bullish Bias – Price sustaining above 5500 with momentum
Volatility: IV ~26–29%, relatively stable with mild contraction
Ideal Strategy Mix: Directional long with partial risk spreads
________________________________________________________________________________
1️⃣ Bullish Trade (Naked options as per trend)
Best CE: Buy 5700 CE @ ₹60.75
Why:
• Long Build-Up (+11.91% OI) with price ↑6.49% = bullish conviction
• Strike just ₹110 above spot → good balance of delta (0.41) and premium
• High TTV (₹89.9 Cr) and stable IV (~26.6%) → institutional activity
• CE 5600 also active, but 5700 is cleaner structure due to fresh longs
________________________________________________________________________________
2️⃣ Bearish Trade (Contrarian Trade – if present)
Best PE: Sell 5500 PE @ ₹59.5
Why:
• Short Build-Up on 5500 PE (+118.7% OI), but price ↓45.84% → strong put writing
• Spot comfortably above strike (₹5590), adding margin of safety
• IV stable → theta decay benefits seller
• Acts as support-level hold strategy in case of mild retracement
________________________________________________________________________________
3️⃣ Strategy Trade (As per trend + OI data)
Strategy: Bull Call Spread → Buy 5700 CE / Sell 5800 CE
→ ₹60.75 / ₹34.15
Net Debit: ₹26.60
Max Profit: ₹100 (spread width) – ₹26.60 = ₹73.40
Max Loss: ₹26.60
Risk:Reward ≈ 1 : 2.75 ✅
Lot Size: 150
Total Risk: ₹3,990
Max Profit: ₹11,010
📊 Breakeven Point: ₹5726.60
📉 Reversal Exit Level: Exit if Spot < ₹5550 (invalidates breakout + weakens CE 5700)
________________________________________________________________________________
Why:
• Strong Long Build-Up at 5700 CE, resistance only mild at 5800
• High IVs make selling 5800 CE favourable → lowers net debit
• Defined risk with RR ≈ 1:2.75 fits your trade rule
• Market supports bullish continuation over 5600-5650 levels
________________________________________________________________________________
📘 My Trading Setup Rules
Avoid Gap Plays
→ Check pre-open price action to avoid trades influenced by gap-ups/gap-downs.
Breakout Entry Only
→ Enter trades only if price breaks previous day’s High (for bullish trades) or Low (for bearish trades).
Watch Volume for Confirmation
→ Monitor volume closely. No volume = No trade.
Enter on Strong Candle + Volume
→ Execute the trade only if a strong candle appears with increasing volume in the direction of the trade.
Defined Risk:Reward Only
→ Take trades only if R:R is favourable (ideally ≥ 1:2)(safe = 1:1).
Premium Disclaimer
→ Option premiums shown are based on EOD prices — real-time premiums may vary during execution.
Time Frame Preference
→ Trade with your preferred time frame — this strategy works across intraday or positional setups.
________________________________________________________________________________
⚠ Disclaimer (Please Read):
• These Trades are shared for educational purposes only and is not investment advice.
• I am not a SEBI-registered advisor.
• The information provided here is based on personal market observation.
• No buy/sell recommendations are being made.
• Please do your own research or consult a registered financial advisor before making any trading decisions.
• Trading involves risk. Always use proper risk management.
I am not responsible for trading decisions based on this post.
________________________________________________________________________________
HDFC Asset Management Company Ltd - Long Setup, Move is ON...#HDFCAMC trading above Resistance of 3844
Next Resistance is at 5237
Support is at 2982
Here are previous charts:
Chart is self explanatory. Levels of breakout, possible up-moves (where stock may find resistances) and support (close below which, setup will be invalidated) are clearly defined.
Disclaimer: This is for demonstration and educational purpose only. This is not buying or selling recommendations. I am not SEBI registered. Please consult your financial advisor before taking any trade.

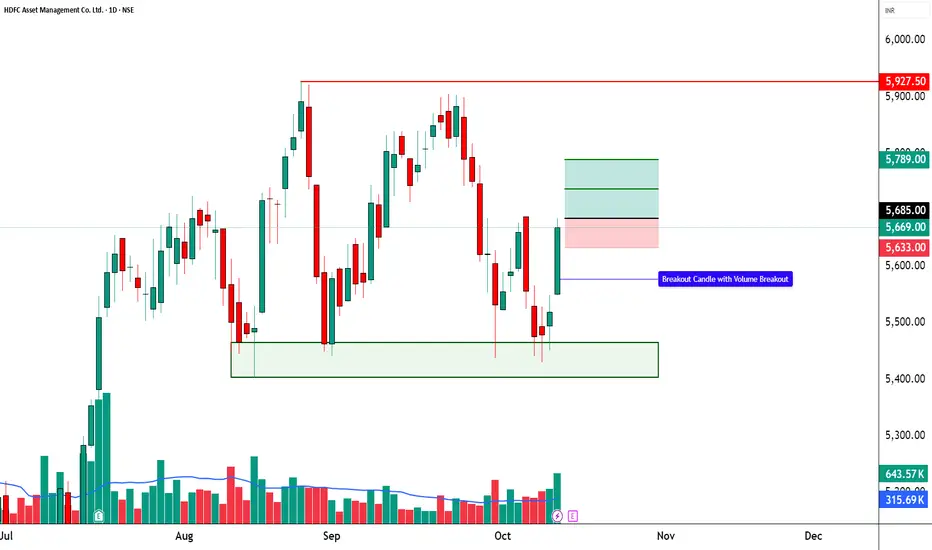
HDFCAMC – Strong Bullish Breakout on High Volume📈 HDFCAMC – Strong Bullish Breakout on High Volume
📅 Setup Date: 18.07.2025 | ⏱ Timeframe: Daily
📍 Strategy: Short-Term HNI Swing Setup
__________________________________________________________________________________
📝 Price Action Summary – HDFCAMC
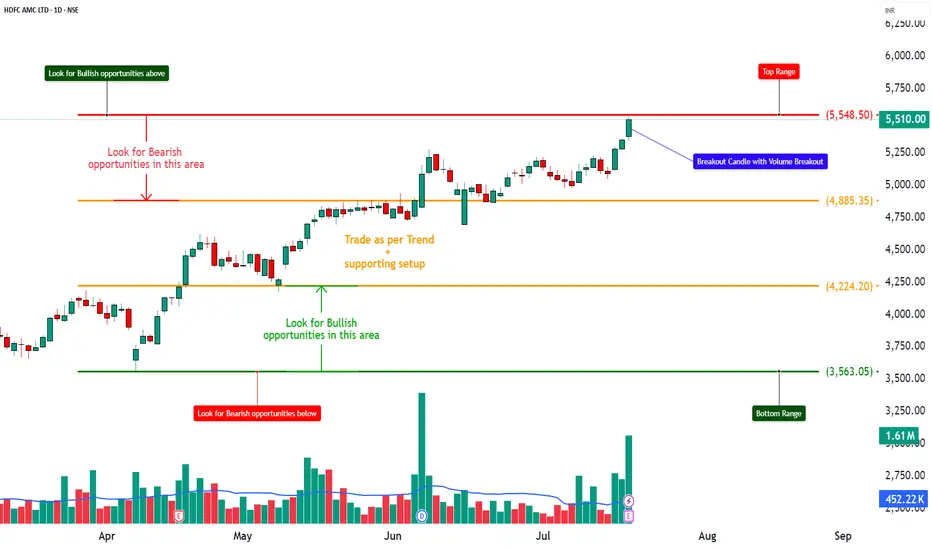
HDFCAMC has delivered a textbook price action breakout, marked by a wide-range bullish candle on 3x average volume — confirming strong institutional participation. After weeks of tight consolidation and multiple failed attempts near the ₹5,385 resistance zone, the price finally broke out with a clean close near day’s high, indicating minimal selling pressure and clear buyer dominance. The breakout follows a classic compression-before-expansion setup, with the previous range acting as a base for momentum. Importantly, the absence of upper wick, strong follow-through, and volume-backed surge signal genuine strength — not a false breakout. Price has now entered a discovery phase with open space toward ₹5,673–₹5,800. As long as ₹5,385 holds as support, the bulls remain in control, and dip buying remains a high-probability setup. This is a classic case of price action speaking louder than indicators — structure, strength, and story all aligned.
__________________________________________________________________________________Trade Logic – Why This Setup:
Strong Price Structure: The stock has formed a bullish candle backed by a 20-day volume breakout, closing near the highs—indicating strong, sustained demand.
Breakout Confirmation: Price has cleanly broken out from a short-term base formed by multiple candle congestion. It's also trading above the prior resistance level of ₹5,385, confirming breakout strength.
__________________________________________________________________________________ Indicator Confluence: The RSI stands strong at 72, signaling bullish momentum. Additionally, the stock is breaking out of a Bollinger Band squeeze—an early sign of a potential momentum ignition. MACD, CCI, and Stochastic indicators are all aligned in bullish zones across daily, weekly, and monthly timeframes.
EMA Alignment: The stock is trading above all major exponential moving averages (9, 20, 50, 100, and 200 EMA), suggesting healthy trend harmony and support at every timeframe.
VWAP Positioning: Current price action remains well above the daily VWAP, indicating buying interest from institutional players and strong demand zones building underneath.
Volume Spike: Today's volume was 1.61 million, compared to the 10-day average of 452,000—more than a 3x surge, confirming strong buyer conviction and institutional participation.
Open Upside Potential: There are no significant supply zones visible until ₹5,800–₹6,000, offering a clear path for price expansion and swing targets.
Sector Tailwinds: The financial services and AMC sector is witnessing renewed traction after positive earnings and improved fund flow trends, supporting broader strength in related counters.
__________________________________________________________________________________ Would I Enter Now?
YES – Enter Now or on Dip
Reason: Price has just cleared a major volume cluster with strong momentum. Waiting too long might mean missing the breakout. The best approach would be:
• Enter 50% now
• Add 50% near ₹5,495–₹5,485 if there’s an intraday dip
__________________________________________________________________________________ 📈 Resistance Zones
• 🔴 R1: 5,591.5 (possibly weak)
• 🔴 R2: 5,673
• 🔴 R3: 5,797
📉 Support Zones
• 🟢 S1: 5,385
• 🟢 S2: 5,261
• 🟢 S3: 5,179
__________________________________________________________________________________ Direction: Buy (Bullish Bias)
Entry Price: ₹5,510 (Current Market Price)
Alternate Entry: On slight dips to ₹5,485–₹5,495 (ideal risk-managed zone)
Stop Loss: ₹5,385
Reason: This is Support 1 and a key VWAP-based level from the recent volume structure. A breach here invalidates the bullish strength.
Risk–Reward Ratio: 1:1 | 1:2 | +
__________________________________________________________________________________ Overall Bias: Bullish
Spot Price: ₹5,510
Trend: Strong upward momentum
Volatility: Slightly cooling IV (esp. in puts), but still elevated → good for defined-risk strategies
Ideal Strategy Mix: Naked CE or Call Debit Spread (defined-risk bullish strategy)
1. 🔼 Bullish Trade (Naked options as per trend)
Best CE: Buy 5400 CE @ ₹197.95
Why: Strong long buildup with rising OI, high volume, and solid delta — indicating institutional interest and momentum-backed directional strength.
__________________________________________________________________________________ 2. 🔽 Bearish Trade (Naked options as per trend)
Best PE: Sell 5200 PE @ ₹26.5
Why: Strong put writing seen with rising OI and price drop, suggesting low downside risk and income potential if bullish trend holds.
__________________________________________________________________________________
3. ⚙️ Strategy Trade (As per trend + OI data)
Strategy: Call Debit Spread → Buy 5400 CE + Sell 5600 CE
Net Debit: ₹197.95 - ₹92.6 = ₹105.35
Max Profit: ₹200 (spread) - ₹105.35 = ₹94.65
Max Loss: ₹105.35
Risk:Reward ≈ 1 : 0.9
Lot Size: 150
Total Risk: ₹15,802.5
Max Profit: ₹14,197.5
Why: This call spread is ideal because both the 5400 CE and 5600 CE are showing strong long build-up, indicating that traders expect the price to move higher. The 5600 CE has a sharp 168% jump in open interest with high volume, suggesting it’s a realistic target zone. By using a spread (buying 5400 CE and selling 5600 CE), we reduce the upfront cost and limit losses while still capturing upside. It also protects against time decay if the stock consolidates before moving up.
__________________________________________________________________________________ ⚠ Disclaimer (Please Read):
• These Trades are shared for educational purposes only and is not investment advice.
• I am not a SEBI-registered advisor.
• The information provided here is based on personal market observation.
• No buy/sell recommendations are being made.
• Please do your own research or consult a registered financial advisor before making any trading decisions.
• Trading involves risk. Always use proper risk management.
STWP is not responsible for trading decisions based on this post.
__________________________________________________________________________________ 💬 Found this helpful?
Drop your thoughts or questions in the comments below ⬇️
🔁 Share this post with your trading community – let them benefit from clean charts, structured setups, and zone-based learning.
✅ Follow simpletradewithpatience for charts, clean setups, and educational content based on price action, zones, and risk-managed trades.
🚀 Trade with patience, trust your charts, and stay clear-headed!
Be Self-Reliant | Trade with Patience | Learn with Charts & Zones 📊
__________________________________________________________________________________
*********************************************************************************************************************
Caution: This is a result based stock
*********************************************************************************************************************
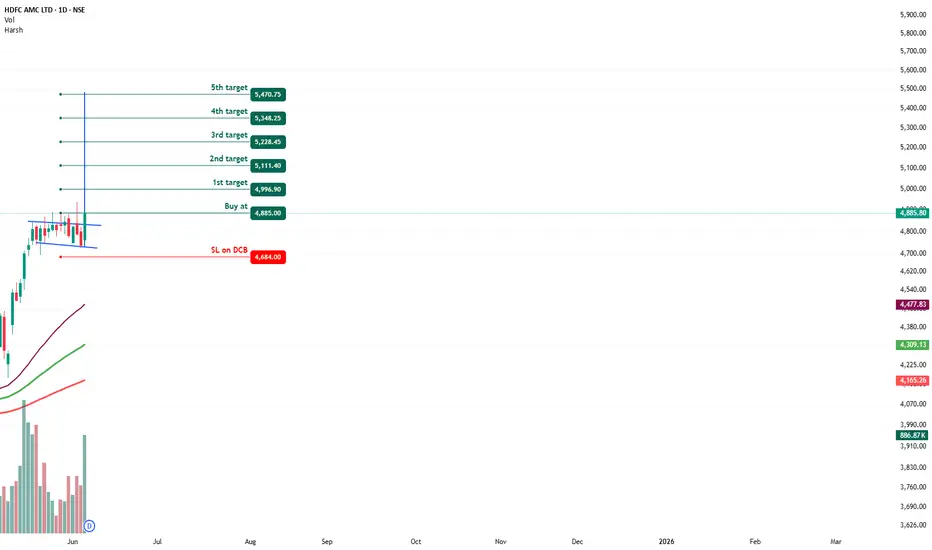
HDFC AMC - Bullish Flag & Pole Breakout (Daily T/F)Trade Setup
📌 Stock: HDFC AMC ( NSE:HDFCAMC )
📌 Trend: Strong Bullish Momentum
📌 Risk-Reward Ratio: 1:3 (Favorable)
🎯 Entry Zone: ₹485.00 (Breakout Confirmation)
🛑 Stop Loss: ₹4684.00 (Daily Closing Basis) (~6.1% Risk)
🎯 Target Levels:
₹4996.90
₹5111.40
₹5228.45
₹5348.45
₹5470.75(Final Target)
Technical Rationale
✅ Bullish Flag & Pole Breakout - Classic trend continuation pattern confirming uptrend
✅ Strong Momentum - Daily, Weekly & Monthly RSI >60 (Bullish zone)
✅ Volume Confirmation - Breakout volume 887K vs previous day's 431K (Nearly 2x surge)
✅ Multi-Timeframe Alignment - Daily and weekly charts showing strength
Key Observations
• The breakout comes with significantly higher volume, validating strength
• Well-defined pattern with clear neckline breakout
• Conservative stop loss at recent swing low
Trade Management Strategy
• Consider partial profit booking at each target level
• Move stop loss to breakeven after Target 1 is achieved
• Trail stop loss to protect profits as price progresses
Disclaimer ⚠️
This analysis is strictly for educational purposes and should not be construed as financial advice. Trading in equities involves substantial risk of capital loss. Past performance is not indicative of future results. Always conduct your own research, consider your risk appetite, and consult a financial advisor before making any investment decisions. The author assumes no responsibility for any trading outcomes based on this information.
What do you think? Are you watching NSE:HDFCAMC for this breakout opportunity? Share your views in the comments!
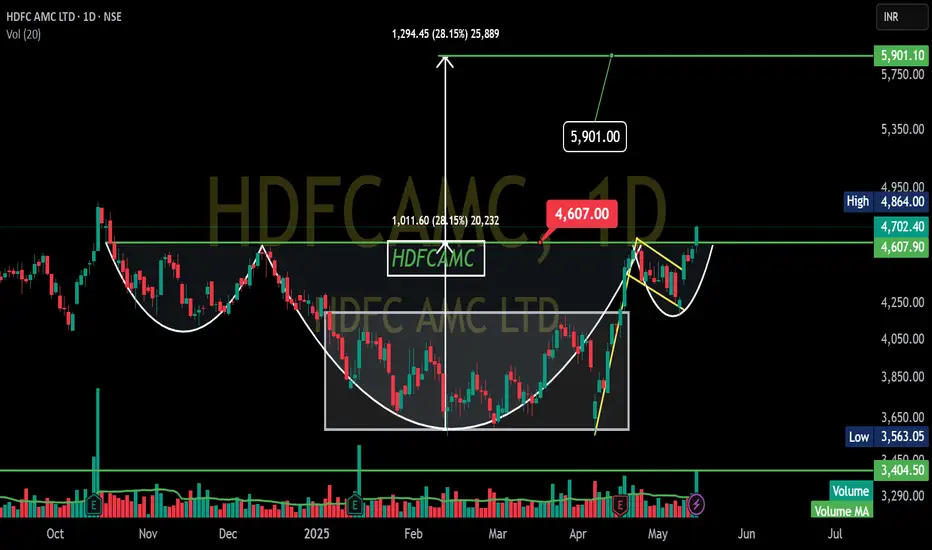
HDFCAMC - Inverted head and shoulder - Breakouttechnical analysis of the HDFC AMC LTD chart you've shared.
Looking at the price action, potential Inverted head and should pattern forming, which is generally considered a bullish sign.
Here's a simplified breakdown:
Head: Notice the rounded bottom shape that formed roughly between Dec 2024 and early April 2025. This suggests a period of consolidation before a potential upward move.
Handle: After reaching a high around ₹4,607, the price has pulled back and is now consolidating in a smaller downward sloping channel (highlighted by the yellow lines). This pullback is forming the "handle" of the pattern.
Breakout Level: The horizontal line you've drawn around ₹4,705 acts as a resistance or neckline. A sustained break above this level could signal the completion of the cup and handle pattern.
Target: Potential target around ₹5,901. This target is often estimated by measuring the depth of the head and adding it to the breakout level.
In simple terms:
The stock price went down, formed a rounded bottom (the head), then went up and is now taking a small dip (the handle). If it breaks above the ₹4,700 level, it might head towards the ₹5,901 area.
Overall, this chart suggests a potential upward move for HDFC AMC if the cup and handle pattern is confirmed with a breakout above ₹4,700.
Good buying opportunity in HDFCAMCWave 4 is almost finished in HDFCAMC.
We can see that a Flat Correction is getting over here.
Wave C of this Flat Correction is near 127%, where a 50% retracement level of the previous impulse is also present.
This creates a good buying cluster. The stop loss for this trade will be 61.8% (marked in red). As wave 4 will never reach this level, we can assume that this is a pretty valid level at which to put our stop.
This analysis is based on Elliott wave theory and Fibonacci.
This analysis is for educational purposes only.
Please always do your own research before you take any trade.

Is this stock potential? How can we trade? HDFC AMC All of the major index and stocks are trading in bearish structure. Market is potentially discounted and we can look for some buy opportunities.
Looking at HDFC AMC stocks, it is still trading in Bullish structure. For any buy setup we would wait for a Change of structure on lower timeframe , mostly on 15 mins.
Look for MSs on 15min and then we can target the daily recent high as future targets.
Trade safe. This is just for educational purposes.

HDFCAMC PARRELEL CHANNEL BREAKOUTHDFCAMC breaking a parrelel channel
weekly basis with volume spike
rsi in bullish zone,macd crossover done
#target 5300
NO BUY/SELL RECOMENDATION

Update in HDFCAMCThe trendline is still not breached and the entry criteria are still valid, only with the change in the entry level.
Entry tentatively above 4445 (to be precise on breakout of trendline)

HDFCAMC RECTANGLE BREAKOUTHDFCAMC breaking rectangle box
with huge volume
good rsi,trading above 20ema
#target 4350
EDUCATIONAL IDEA

Book Profits - Candidate for ShortsDisclaimer: This Analysis is not to be taken for trading or investment decisions.
Stock has rallied for last year without any break, it has touched previous life time high levels of year 2019.
It has touched the upper band of Regression trend when plotted from beginning

HDFCAMC: Dhanteras PickStock is rising in an impulsive manner forming higher highs and higher lows. Any dip should be taken as buying opportunity for the upside target zone of 3800-4000 in the coming months.

Long HDFC AMC for target of 2700 - 3300 - 3800Long HDFCAMC for Long term near 1800 with stop loss of 1740 on closing basis.
Following are likely target
Buy near 1800
Target 1 - 2700
Target 2 - 3300
Target 3 - 3800
SL 1760

HDFC Asset Management Company Ltd - Long Setup, Move is ON...#HDFCAMC trading above Resistance of 3361
Next Resistance is at 3844
Support is at 2853
Here are previous charts:
Chart is self explanatory. Levels of breakout, possible up-moves (where stock may find resistances) and support (close below which, setup will be invalidated) are clearly defined.
Disclaimer: This is for demonstration and educational purpose only. This is not buying or selling recommendations. I am not SEBI registered. Please consult your financial advisor before taking any trade.

Has HDFCAMC bottomed out?HDFC AMC has been in continuous downtrend from late 2019.
As we can see on the chart, the stock has recently bounced from a support level with good volumes.
The most interesting observation is a positive divergence in RSI during the bounce which might be an indication that stock has bottomed.
On Friday, good buying with high volumes has been observed with a bullish candle, almost a marubozu.
This stock has an immediate resistance at 1950 so it is better to buy the stock at around 1800-1810 levels for a better risk reward.
Kindly trade as per your own analysis. This idea is shared for educational purposes.

#HDFCAMC #shortterm stock#hdfcamc made a #breakout, #retested, now moving the targets. 2866 / 2979 / 3199 / 3365
Disclaimer: Make your analysis before any trade. Trade with conviction.

HDFC Group Stock near breakout*POSITIONAL TRADE*
BUY HDFC AMC Between 3000-3300
SL 2650
Target 1: 4500
Target 2: 5150
Trade as per your risk rewards
Accumate in every deep
Stock may breakout any time so give
range to add one can enter at CMP.

HDFC LIFE !Trend is neutral
Net Sales of 46,513cr has grown at 56.23%
Pat has grown at 20.84%
PE is too hot and high at 93.43%
mutual fund stake has increased from 4% to 4.66%past quarter
stock is a good buy at 520-560
Wait for the dip

Looking for long!HDFC AMC is looking for great buying opportunity after forming descending channel lined up with the double bottom formation expecting target to reach at 3400
