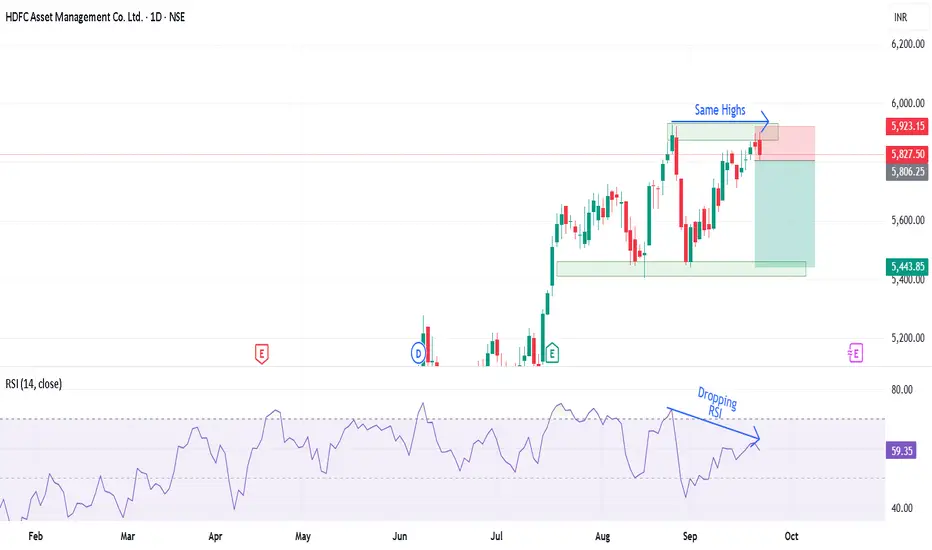
Double Top at the Peak: Is a Bearish Reversal Coming in HDFC AMCHDFC AMC has given a good upside rally of 65% and is form a double top pattern.
The stock is following a bullish trendline but the RSI divergence is creating a bearish sentiment supported by the drop India VIX.
If the stock breaks below the trendline, a bearish trade can be entered with the first target of 5440 following it to 5208.
Bullishness will only be confirmed only once the stock starts trading above 6000 levels.
There is RSI divergence on the higher time frame too and gives more convincing trade in the stock.
Entry :- Below 5809
Target :- 5440 and 5208
Stop Loss :- Close above 5927 (daily charts)
Wait for the price action and trade accordingly.
Hdfcamcanalysis
HDFCAMC – Bullish Momentum with Short Covering Base________________________________________________________________________________📈 HDFCAMC – Bullish Momentum with Short Covering Base
📅 Setup Date: 18.07.2025 | ⏱ Timeframe: Daily
📍 Strategy: Momentum Trade Setup with Defined Risk
________________________________________________________________________________
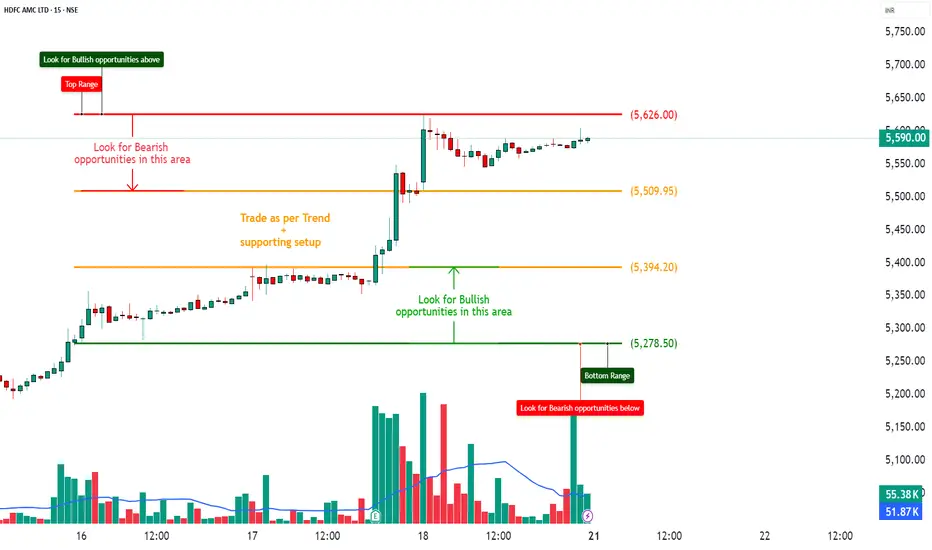
🔍 Overall View
Spot Price: ₹5590
Trend: Bullish Bias – Price sustaining above 5500 with momentum
Volatility: IV ~26–29%, relatively stable with mild contraction
Ideal Strategy Mix: Directional long with partial risk spreads
________________________________________________________________________________
1️⃣ Bullish Trade (Naked options as per trend)
Best CE: Buy 5700 CE @ ₹60.75
Why:
• Long Build-Up (+11.91% OI) with price ↑6.49% = bullish conviction
• Strike just ₹110 above spot → good balance of delta (0.41) and premium
• High TTV (₹89.9 Cr) and stable IV (~26.6%) → institutional activity
• CE 5600 also active, but 5700 is cleaner structure due to fresh longs
________________________________________________________________________________
2️⃣ Bearish Trade (Contrarian Trade – if present)
Best PE: Sell 5500 PE @ ₹59.5
Why:
• Short Build-Up on 5500 PE (+118.7% OI), but price ↓45.84% → strong put writing
• Spot comfortably above strike (₹5590), adding margin of safety
• IV stable → theta decay benefits seller
• Acts as support-level hold strategy in case of mild retracement
________________________________________________________________________________
3️⃣ Strategy Trade (As per trend + OI data)
Strategy: Bull Call Spread → Buy 5700 CE / Sell 5800 CE
→ ₹60.75 / ₹34.15
Net Debit: ₹26.60
Max Profit: ₹100 (spread width) – ₹26.60 = ₹73.40
Max Loss: ₹26.60
Risk:Reward ≈ 1 : 2.75 ✅
Lot Size: 150
Total Risk: ₹3,990
Max Profit: ₹11,010
📊 Breakeven Point: ₹5726.60
📉 Reversal Exit Level: Exit if Spot < ₹5550 (invalidates breakout + weakens CE 5700)
________________________________________________________________________________
Why:
• Strong Long Build-Up at 5700 CE, resistance only mild at 5800
• High IVs make selling 5800 CE favourable → lowers net debit
• Defined risk with RR ≈ 1:2.75 fits your trade rule
• Market supports bullish continuation over 5600-5650 levels
________________________________________________________________________________
📘 My Trading Setup Rules
Avoid Gap Plays
→ Check pre-open price action to avoid trades influenced by gap-ups/gap-downs.
Breakout Entry Only
→ Enter trades only if price breaks previous day’s High (for bullish trades) or Low (for bearish trades).
Watch Volume for Confirmation
→ Monitor volume closely. No volume = No trade.
Enter on Strong Candle + Volume
→ Execute the trade only if a strong candle appears with increasing volume in the direction of the trade.
Defined Risk:Reward Only
→ Take trades only if R:R is favourable (ideally ≥ 1:2)(safe = 1:1).
Premium Disclaimer
→ Option premiums shown are based on EOD prices — real-time premiums may vary during execution.
Time Frame Preference
→ Trade with your preferred time frame — this strategy works across intraday or positional setups.
________________________________________________________________________________
⚠ Disclaimer (Please Read):
• These Trades are shared for educational purposes only and is not investment advice.
• I am not a SEBI-registered advisor.
• The information provided here is based on personal market observation.
• No buy/sell recommendations are being made.
• Please do your own research or consult a registered financial advisor before making any trading decisions.
• Trading involves risk. Always use proper risk management.
I am not responsible for trading decisions based on this post.
________________________________________________________________________________
HDFCAMC – Strong Bullish Breakout on High Volume📈 HDFCAMC – Strong Bullish Breakout on High Volume
📅 Setup Date: 18.07.2025 | ⏱ Timeframe: Daily
📍 Strategy: Short-Term HNI Swing Setup
__________________________________________________________________________________
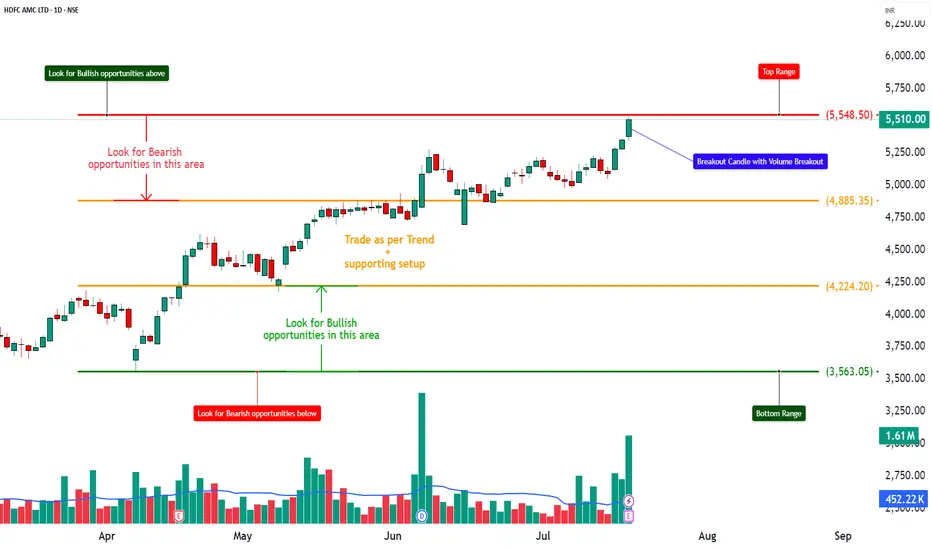
📝 Price Action Summary – HDFCAMC
HDFCAMC has delivered a textbook price action breakout, marked by a wide-range bullish candle on 3x average volume — confirming strong institutional participation. After weeks of tight consolidation and multiple failed attempts near the ₹5,385 resistance zone, the price finally broke out with a clean close near day’s high, indicating minimal selling pressure and clear buyer dominance. The breakout follows a classic compression-before-expansion setup, with the previous range acting as a base for momentum. Importantly, the absence of upper wick, strong follow-through, and volume-backed surge signal genuine strength — not a false breakout. Price has now entered a discovery phase with open space toward ₹5,673–₹5,800. As long as ₹5,385 holds as support, the bulls remain in control, and dip buying remains a high-probability setup. This is a classic case of price action speaking louder than indicators — structure, strength, and story all aligned.
__________________________________________________________________________________Trade Logic – Why This Setup:
Strong Price Structure: The stock has formed a bullish candle backed by a 20-day volume breakout, closing near the highs—indicating strong, sustained demand.
Breakout Confirmation: Price has cleanly broken out from a short-term base formed by multiple candle congestion. It's also trading above the prior resistance level of ₹5,385, confirming breakout strength.
__________________________________________________________________________________ Indicator Confluence: The RSI stands strong at 72, signaling bullish momentum. Additionally, the stock is breaking out of a Bollinger Band squeeze—an early sign of a potential momentum ignition. MACD, CCI, and Stochastic indicators are all aligned in bullish zones across daily, weekly, and monthly timeframes.
EMA Alignment: The stock is trading above all major exponential moving averages (9, 20, 50, 100, and 200 EMA), suggesting healthy trend harmony and support at every timeframe.
VWAP Positioning: Current price action remains well above the daily VWAP, indicating buying interest from institutional players and strong demand zones building underneath.
Volume Spike: Today's volume was 1.61 million, compared to the 10-day average of 452,000—more than a 3x surge, confirming strong buyer conviction and institutional participation.
Open Upside Potential: There are no significant supply zones visible until ₹5,800–₹6,000, offering a clear path for price expansion and swing targets.
Sector Tailwinds: The financial services and AMC sector is witnessing renewed traction after positive earnings and improved fund flow trends, supporting broader strength in related counters.
__________________________________________________________________________________ Would I Enter Now?
YES – Enter Now or on Dip
Reason: Price has just cleared a major volume cluster with strong momentum. Waiting too long might mean missing the breakout. The best approach would be:
• Enter 50% now
• Add 50% near ₹5,495–₹5,485 if there’s an intraday dip
__________________________________________________________________________________ 📈 Resistance Zones
• 🔴 R1: 5,591.5 (possibly weak)
• 🔴 R2: 5,673
• 🔴 R3: 5,797
📉 Support Zones
• 🟢 S1: 5,385
• 🟢 S2: 5,261
• 🟢 S3: 5,179
__________________________________________________________________________________ Direction: Buy (Bullish Bias)
Entry Price: ₹5,510 (Current Market Price)
Alternate Entry: On slight dips to ₹5,485–₹5,495 (ideal risk-managed zone)
Stop Loss: ₹5,385
Reason: This is Support 1 and a key VWAP-based level from the recent volume structure. A breach here invalidates the bullish strength.
Risk–Reward Ratio: 1:1 | 1:2 | +
__________________________________________________________________________________ Overall Bias: Bullish
Spot Price: ₹5,510
Trend: Strong upward momentum
Volatility: Slightly cooling IV (esp. in puts), but still elevated → good for defined-risk strategies
Ideal Strategy Mix: Naked CE or Call Debit Spread (defined-risk bullish strategy)
1. 🔼 Bullish Trade (Naked options as per trend)
Best CE: Buy 5400 CE @ ₹197.95
Why: Strong long buildup with rising OI, high volume, and solid delta — indicating institutional interest and momentum-backed directional strength.
__________________________________________________________________________________ 2. 🔽 Bearish Trade (Naked options as per trend)
Best PE: Sell 5200 PE @ ₹26.5
Why: Strong put writing seen with rising OI and price drop, suggesting low downside risk and income potential if bullish trend holds.
__________________________________________________________________________________
3. ⚙️ Strategy Trade (As per trend + OI data)
Strategy: Call Debit Spread → Buy 5400 CE + Sell 5600 CE
Net Debit: ₹197.95 - ₹92.6 = ₹105.35
Max Profit: ₹200 (spread) - ₹105.35 = ₹94.65
Max Loss: ₹105.35
Risk:Reward ≈ 1 : 0.9
Lot Size: 150
Total Risk: ₹15,802.5
Max Profit: ₹14,197.5
Why: This call spread is ideal because both the 5400 CE and 5600 CE are showing strong long build-up, indicating that traders expect the price to move higher. The 5600 CE has a sharp 168% jump in open interest with high volume, suggesting it’s a realistic target zone. By using a spread (buying 5400 CE and selling 5600 CE), we reduce the upfront cost and limit losses while still capturing upside. It also protects against time decay if the stock consolidates before moving up.
__________________________________________________________________________________ ⚠ Disclaimer (Please Read):
• These Trades are shared for educational purposes only and is not investment advice.
• I am not a SEBI-registered advisor.
• The information provided here is based on personal market observation.
• No buy/sell recommendations are being made.
• Please do your own research or consult a registered financial advisor before making any trading decisions.
• Trading involves risk. Always use proper risk management.
STWP is not responsible for trading decisions based on this post.
__________________________________________________________________________________ 💬 Found this helpful?
Drop your thoughts or questions in the comments below ⬇️
🔁 Share this post with your trading community – let them benefit from clean charts, structured setups, and zone-based learning.
✅ Follow simpletradewithpatience for charts, clean setups, and educational content based on price action, zones, and risk-managed trades.
🚀 Trade with patience, trust your charts, and stay clear-headed!
Be Self-Reliant | Trade with Patience | Learn with Charts & Zones 📊
__________________________________________________________________________________
*********************************************************************************************************************
Caution: This is a result based stock
*********************************************************************************************************************
HDFCAMC: Dhanteras PickStock is rising in an impulsive manner forming higher highs and higher lows. Any dip should be taken as buying opportunity for the upside target zone of 3800-4000 in the coming months.

HDFCAMC Analysis!NSE:HDFCAMC Analysis on a weekly timeframe!
Double Bottom Pattern in HDFCAMC!
RSI Divergence in HDFCAMC!
Entry = Above Neckline
Stop Loss = Below 2216.95
Target = 3344.40
Disclaimer = All my analysis is for Educational Purposes only. Before entering into any trade -
1) Educate Yourself
2) Do your research and analysis
3) Define your Risk to Reward ratio
4)Don't trade with full capital

HDFC Group Stock near breakout*POSITIONAL TRADE*
BUY HDFC AMC Between 3000-3300
SL 2650
Target 1: 4500
Target 2: 5150
Trade as per your risk rewards
Accumate in every deep
Stock may breakout any time so give
range to add one can enter at CMP.

HDFCAMC Fall expectedI am not holding HDFCAMC. You may book profits here
Disclaimer: This analysis is solely for educational purposes and does not make me a SEBI registered analyst.
If you found this analysis helpful, I encourage you to like and share it. Your observations and comments are also welcomed below. Your support, likes, follows, and comments motivate me to consistently share valuable insights with you.
🔍 More Analysis & Trade Setups 🔍
For more technical analysis and trade setups, make sure to follow me on TradingView: www.tradingview.com

HDFC AMC swing trade#HDFCAMC looking good for a long from 1888 for targets of 2000/2300 , short to medium term swing SL at 1800 , RR 1:4

hdfc amc long Hdfc amc elliot wave analysis complete 5 wave and downside complete abc and retracment down side 38% and break o- b trendline upside break out
buy 1855
stoploss 1800 target 200

HDFCAMC NEAR DEMAND ZONEHDFCAMC is near it's demand zone and looking a good buy @ 1860 - 1830 for a bounce.
To motivate us, Please like the idea If you agree with the analysis.
Happy Trading!
InvestPro India Team
