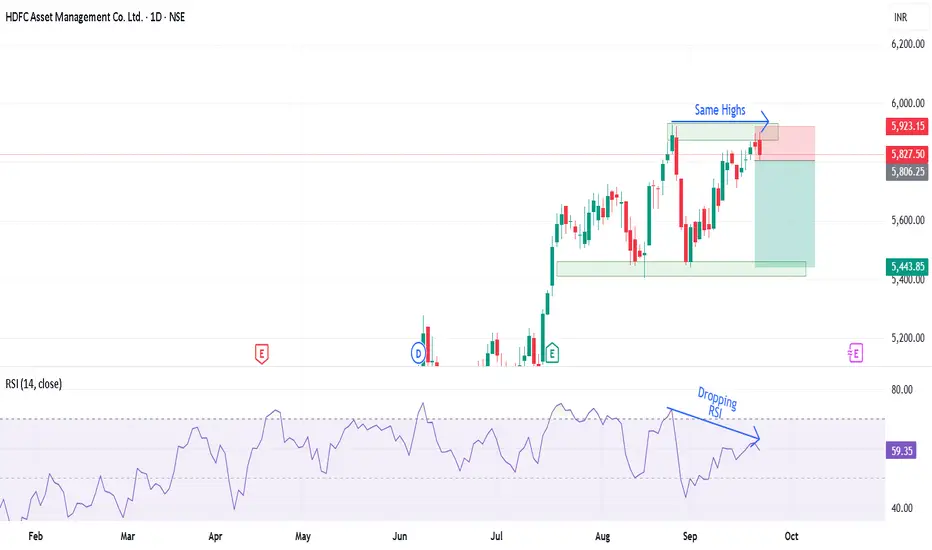
Double Top at the Peak: Is a Bearish Reversal Coming in HDFC AMCHDFC AMC has given a good upside rally of 65% and is form a double top pattern.
The stock is following a bullish trendline but the RSI divergence is creating a bearish sentiment supported by the drop India VIX.
If the stock breaks below the trendline, a bearish trade can be entered with the first target of 5440 following it to 5208.
Bullishness will only be confirmed only once the stock starts trading above 6000 levels.
There is RSI divergence on the higher time frame too and gives more convincing trade in the stock.
Entry :- Below 5809
Target :- 5440 and 5208
Stop Loss :- Close above 5927 (daily charts)
Wait for the price action and trade accordingly.
Hdfcamctradesetup
HDFCAMC Analysis!NSE:HDFCAMC Analysis on a weekly timeframe!
Double Bottom Pattern in HDFCAMC!
RSI Divergence in HDFCAMC!
Entry = Above Neckline
Stop Loss = Below 2216.95
Target = 3344.40
Disclaimer = All my analysis is for Educational Purposes only. Before entering into any trade -
1) Educate Yourself
2) Do your research and analysis
3) Define your Risk to Reward ratio
4)Don't trade with full capital

HDFC Group Stock near breakout*POSITIONAL TRADE*
BUY HDFC AMC Between 3000-3300
SL 2650
Target 1: 4500
Target 2: 5150
Trade as per your risk rewards
Accumate in every deep
Stock may breakout any time so give
range to add one can enter at CMP.

HDFCAMC Fall expectedI am not holding HDFCAMC. You may book profits here
Disclaimer: This analysis is solely for educational purposes and does not make me a SEBI registered analyst.
If you found this analysis helpful, I encourage you to like and share it. Your observations and comments are also welcomed below. Your support, likes, follows, and comments motivate me to consistently share valuable insights with you.
🔍 More Analysis & Trade Setups 🔍
For more technical analysis and trade setups, make sure to follow me on TradingView: www.tradingview.com
