HDFCBANK - Extended Retracement Phase
📊 HDFC Bank – Daily Chart Update | Extended Retracement Phase
Timeframe: 1D
Trend Context: Medium-term correction within a broader structure
Current Price: ~₹925
🔍 What Changed from Previous Analysis? (Important Update)
Earlier, we discussed an ABC correction nearing completion around the ₹960–965 zone.
📉 Price failed to hold that zone, leading to a deeper, extended retracement.
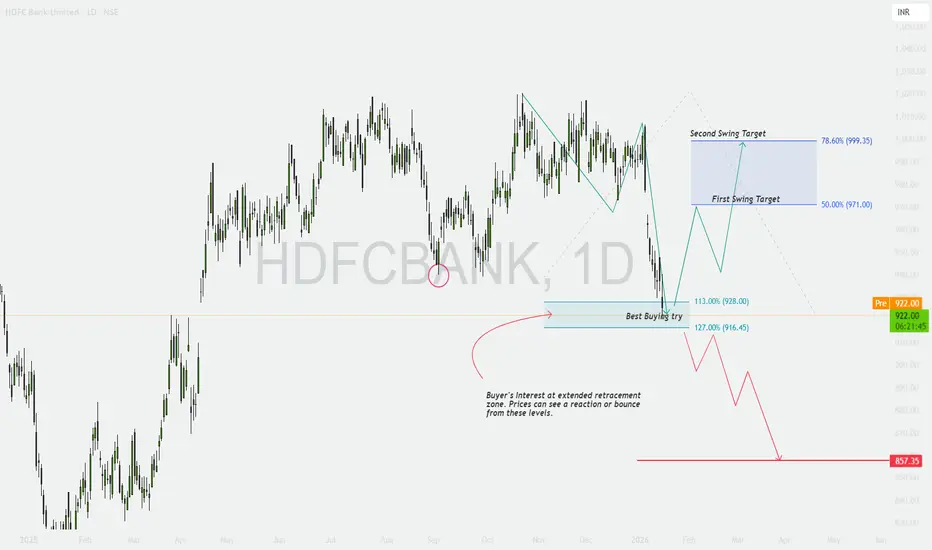
Now the structure has evolved into an extended Fibonacci retracement, where buyers may re-emerge, but with higher risk.
📐 Fibonacci-Based Structure (Educational)
From the prior swing low → swing high:
113% Retracement: ~₹928
127% Retracement: ~₹916
➡️ This ₹916–928 zone is now marked as a “Best Buying Try” area, not blind buying.
📘 Extended retracements often invite short-covering + value buying, but confirmation is mandatory.
📌 Key Levels to Watch (Updated)
🟢 Support / Demand Zones
Primary Demand: ₹916–928
Major Breakdown Level: ₹857
🔴 Resistance / Recovery Zones
First Swing Target: ₹971 (50% retracement)
Second Swing Target: ₹999 (78.6% retracement)
Major Supply: ₹1,018–1,020
🟢 Bullish Scenario (Conditional Recovery)
If price:
Holds ₹916–928
Forms a base / reversal structure (daily close improvement, higher low)
Then:
First bounce toward ₹960–971
Sustained strength can extend toward ₹995–1,000
📈 This would be a relief rally, not trend reversal yet.
🔴 Bearish Scenario (Risk Case)
If price:
Breaks below ₹916 with daily close
Then:
Extended correction likely
Downside opens toward ₹880 → ₹857
📉 Below ₹916, buyers lose positional control.
🎓 Educational Insights
Extended retracements = high reward but high patience trades
Buying zones ≠ buying signals
Daily timeframe requires confirmation, not anticipation
Strong trends correct deeper before resuming
🧠 Options Trading View (Educational Only)
🟢 Near ₹916–928 (Only After Confirmation)
Bull Call Spread (ATM + OTM)
Put Credit Spread for range-bound recovery
🔴 If ₹916 Breaks
Bear Put Spread
Call Credit Spread near ₹960–980
⚠️ Avoid naked option selling in falling markets.
✅ DOs
✔ Wait for daily confirmation
✔ Trade zones, not emotions
✔ Use defined risk strategies
✔ Reduce position size during deep corrections
❌ DON’Ts
❌ Don’t average blindly
❌ Don’t assume every dip is the bottom
❌ Don’t ignore Fibonacci extensions
❌ Don’t overtrade volatility
🧾 Conclusion
HDFC Bank is now in an extended corrective phase.
The ₹916–928 zone is a potential demand area, but only confirmation will decide whether this becomes a base or a breakdown.
📌 Patience here is more profitable than prediction.
⚠️ Disclaimer
This analysis is for educational purposes only. I am not a SEBI registered analyst. Markets are risky, and I may be wrong. Please consult your financial advisor before trading.
Hdfcbankanalysis
HDFCBANK — 1H Technical Analysis
Timeframe: 1 Hour
Structure: Intermediate ABC correction within a broader uptrend
Current Price Zone: ~₹963
Trend Context: Higher-timeframe trend remains positive, short-term corrective phase in progress
🔍 Market Structure & Price Action (Educational View)
Price is currently forming an Intermediate corrective ABC structure after facing rejection near the ₹1,018–1,020 resistance band.
Wave (a): Sharp impulsive decline from the top
Wave (b): Retracement toward resistance, failed to make a new high
Wave (c): Ongoing decline, approaching a high-probability demand zone
This is a classic corrective pause, not a trend reversal unless key supports fail.
📌 Key Levels to Track
Major Resistance: ₹1,018–1,020
Reclaim Level (Trend Continuation): ₹975–980
ABC Completion / Demand Zone: ₹961–965
Critical Invalidation Level: ₹957
Breakdown Support (Risk Zone): ₹916
💡 Corrections often end where institutions previously accumulated — zones matter more than candles.
🟢 Bullish Scenario (Primary Plan)
If price holds above ₹961–965 and shows stabilization:
Confirmation signals to watch:
Bullish engulfing / strong rejection wick
Higher low on 15m–1h
Volume expansion on green candles
Upside Roadmap:
₹975 → ₹990 → ₹1,010
Sustained move above ₹980 opens doors for fresh highs over time
📘 This would confirm ABC completion and resumption of the larger uptrend.
🔴 Bearish Scenario (Risk Case)
If price breaks and sustains below ₹957:
ABC structure fails
Selling pressure may accelerate
Downside opens toward ₹930 → ₹916
📉 Below ₹957, probabilities shift from “buy-the-dip” to “protect capital”.
🎓 Educational Takeaways
Corrections are healthy pauses, not immediate sell signals
Always trade levels + confirmation, not hope
Bigger trend remains intact above ₹957
Sideways + choppy price = option sellers’ playground
🧠 Options Trading Strategies (Educational Only)
🟢 Bullish (Support Holds)
Strategy 1: Bull Call Spread
Buy ATM Call
Sell OTM Call (₹980/₹1000 zone)
Defined risk, lower theta decay
Strategy 2: Cash-secured Put (Aggressive)
Sell ₹960 PE only if price stabilizes
Suitable for experienced traders
🔴 Bearish (Support Breaks)
Strategy 1: Bear Put Spread
Buy ₹960 PE
Sell ₹920 PE
Risk-defined downside play
Strategy 2: Call Credit Spread
Sell ₹980 CE
Buy ₹1020 CE
Works best in breakdown + consolidation
⚠️ Avoid naked options near support zones.
✅ DOs
✔ Trade near key levels, not in the middle
✔ Use defined SL (₹957)
✔ Reduce position size during corrections
✔ Wait for price confirmation
❌ DON’Ts
❌ Don’t panic sell near demand zones
❌ Don’t over-leverage options during volatility
❌ Don’t assume every dip is a buying opportunity
❌ Don’t ignore higher-timeframe trend context
🧾 Summary & Conclusion
HDFC Bank is undergoing a controlled intermediate correction within a broader bullish structure.
The ₹961–965 zone is crucial — holding above this keeps the bullish roadmap intact, while a breakdown below ₹957 increases downside risk.
📌 Patience + confirmation = edge.
⚠️ Disclaimer
This analysis is for educational purposes only. I am not a SEBI registered analyst. Markets are risky, and I may be wrong. Please consult your financial advisor before taking any trade.

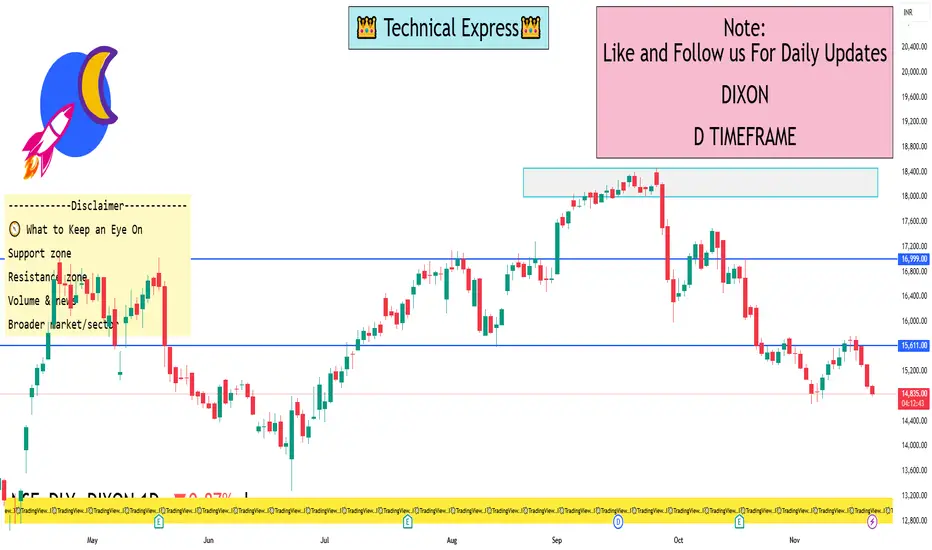
DIXON 1 Day Time Frame 🔍 Price & Pivot Levels to Watch
1. Latest live price: ~ ₹14,825 (as of intraday in India) from Groww.
2. Pivot levels (classic) for the day (based on Moneycontrol data):
Pivot ~ ₹15,065
S1 ~ ₹14,820
R1 ~ ₹15,209
3. Key moving-average resistances:
50-day SMA ~ ₹15,578 (price is below)
200-day SMA ~ ~₹15,738 – ~₹15,789 range (price is well below).
🧭 What to Keep an Eye On
Support zone: Near the S1 pivot (~₹14,820) and possibly the intra-day low zone (~₹14,700-14,800)
Resistance zone: The pivot (~₹15,065) and then R1 (~₹15,209) and the nearby moving averages (~₹15,500-15,600)
Volume & news: A sharp uptick in volume or a positive corporate/catalyst event could change the short-term dynamic.
Broader market/sector: Since Dixon is in electronics manufacturing, macro sentiment, export incentives, and input cost changes matter.
Unlock India’s Derivatives Power1. The Rise of Derivatives in India
Derivatives—such as futures, options, and swaps—derive their value from underlying assets like stocks, indices, commodities, currencies, and interest rates. India’s derivatives journey began in the early 2000s when SEBI introduced index derivatives to modernize capital markets and reduce speculation in cash segments. Over time, the market matured, attracting domestic retail traders, institutional investors like mutual funds, FPIs, and corporate hedgers.
Today, the Indian derivatives market on the NSE and BSE records billions of dollars worth of contracts daily, with index options (especially Nifty and Bank Nifty) leading global volumes. The democratization of trading platforms, reduction of brokerage costs, and increased financial literacy have further strengthened participation.
2. Why Derivatives Matter for India’s Financial System
Unlocking India’s derivatives power requires recognizing the major roles derivatives play:
a. Risk Management
Derivatives allow traders and businesses to hedge against price volatility in stocks, commodities, interest rates, and currencies.
For example:
A gold importer hedges price movements using MCX gold futures.
A portfolio manager uses Nifty options to guard against market downturns.
This reduces uncertainties in business operations and enhances economic stability.
b. Price Discovery
Futures markets incorporate expectations about future prices, interest rates, demand changes, and macroeconomic events.
For example:
Rising crude oil futures may signal anticipated geopolitical tensions.
Falling index futures may reflect market caution before major policy announcements.
Thus, derivatives become a leading indicator for spot markets.
c. Liquidity Enhancement
The derivatives market trades massive volumes daily, which increases liquidity. High liquidity ensures:
Low transaction costs
Tight bid-ask spreads
Efficient entry and exit
This attracts even more participants, creating a virtuous growth cycle.
d. Leveraged Opportunities
Derivatives allow exposure to large positions with a small margin.
However, leverage is double-edged—working for and against traders. Proper risk discipline is essential.
3. Key Segments Driving India’s Derivatives Strength
a. Equity Derivatives
These dominate India’s markets.
Index Options
Nifty and Bank Nifty options are the backbone of derivatives trading.
Advantages:
Deep liquidity
Lower manipulation risk
Suitable for hedging and speculation
Single Stock Futures and Options
Used heavily by institutional players.
b. Currency Derivatives
India’s growing global trade and foreign investments make currency futures vital for:
Exporters hedging USD/INR or EUR/INR
Importers mitigating forex risk
Traders capturing arbitrage opportunities
c. Commodity Derivatives
MCX, NCDEX, and BEE provide platforms for commodity futures across:
Metals (gold, silver, aluminium)
Energy (crude oil, natural gas)
Agriculture (soybean, cotton, sugar)
This reduces volatility for farmers, industries, and logistics players.
d. Interest Rate Derivatives (IRD)
This segment supports:
Banks
NBFCs
Corporate treasuries
IRD helps stabilize bond markets and strengthen monetary policy transmission.
4. Technological Drivers Unlocking India’s Derivative Power
India’s derivatives boom is heavily powered by technology:
a. High-Speed Trading Platforms
Advanced order-matching engines on NSE and BSE allow microsecond-level execution.
b. Algorithmic and Quant Trading
AI and mathematical models enable:
Auto-trading systems
Statistical arbitrage
Options strategies like iron condors, butterflies, spreads
These bring efficiency and sophistication.
c. Mobile Trading Revolution
Retail participation surged due to:
Zero-commission brokers
Mobile trading apps
Real-time charts and indicators
This democratizes access to derivatives for small investors.
d. Big Data Analytics
Traders now rely on:
Options chain analytics
Market depth
Implied volatility indicators
Open interest interpretation
These help decode market sentiment.
5. How Policy and Regulation Support Derivative Market Growth
a. SEBI’s Robust Regulatory Framework
SEBI ensures transparency, limits manipulation, and protects investors through:
Strict margining systems
Daily settlement
Position limits
Surveillance mechanisms
b. Stock Exchanges’ Risk-Management Systems
NSE and BSE maintain:
Real-time risk monitoring
Market-wide circuit breakers
SPAN and peak margins
These prevent destabilizing events.
c. Government Initiatives
Reforms supporting derivatives growth:
Unified market regulator
Introduction of new derivative products
Increased FPI limits
Commodity market integration with mainstream markets
6. Retail Traders: The New Power in Indian Derivatives
Retail traders now form a major part of index options volume due to:
a. Low Capital Requirements
Options require very low capital at entry compared to futures.
b. Easy-to-use platforms
Everything from charting to algo tools is readily accessible.
c. Increasing financial education
YouTube channels, apps, and online courses fuel interest.
d. Popular intraday strategies
Like:
ATM/OTM straddle-strangle
Trend-following options
Breakout futures trading
Open interest analysis
Retail participation expands market depth and liquidity.
7. Challenges Before India Fully Unlocks Derivatives Power
India must overcome several hurdles:
a. Over-Speculation Risk
Excessive speculation in weekly options can lead to:
High losses for inexperienced traders
Market volatility
b. Low Understanding of Risks
Many traders jump into derivatives without:
Risk management
Position sizing
Stop-loss planning
Education is crucial.
c. Limited Institutional Depth
While retail dominates volume, institutional participation in options is still evolving.
d. Regulatory Overhang
Frequent rule changes (like margin norms) sometimes disrupt traders.
8. The Future: Where India’s Derivatives Market Is Heading
The next decade promises massive growth through:
a. Introduction of New Products
More sectoral index derivatives
Long-term options
Interest rate swaps
Commodity options expansion
b. Retail + Institutional Balance
A healthier mix of FPIs, DIIs, and retail will bring stability.
c. Global Integration
India may become a major derivatives hub like:
Chicago
London
Singapore
d. AI-Driven Derivatives Trading
AI systems will automate:
Strategy generation
Position management
Sentiment analysis
This transforms how derivatives are traded.
Conclusion
Unlocking India’s derivatives power is not just about trading; it is about strengthening the entire financial ecosystem. Derivatives offer tools for hedging, speculation, price discovery, and economic stability. With technological innovation, rising retail participation, strong regulation, and diversified product offerings, India is positioned to become a global leader in derivatives.
For traders, investors, businesses, and policymakers, understanding derivatives is essential for navigating and benefiting from India’s fast-evolving markets. As the country continues to grow economically and digitally, derivatives will play a central role in shaping the next era of financial empowerment.

Trading with Volume1. What is Volume in Trading?
Volume is the total number of shares, contracts, or lots traded in a market during a particular period. Every time a buyer and seller make a transaction, it adds to the volume count.
For example:
If 10,00,000 shares of a stock are bought and sold during a day, that stock’s daily volume is 10 lakh.
If Bitcoin has 50,000 transactions in a 1-hour timeframe, that is its hourly volume.
Volume acts as the pulse of the market. When market participants are active, volume increases. When they lose interest, volume shrinks.
2. Why is Volume Important for Traders?
Volume helps traders answer critical questions:
a. Is the trend strong or weak?
A price trend supported by high volume is considered trustworthy. A trend on low volume is often weak and may collapse.
b. Is the breakout real or fake?
Strong volume during breakouts confirms genuine market interest. Low-volume breakouts often fail.
c. Is a reversal coming?
Volume spikes at tops or bottoms often indicate exhaustion and potential reversal.
d. Where are big players active?
Institutional traders like banks, funds, and smart money leave “footprints” through volume surges.
Thus, volume is a confirmation tool that helps traders avoid traps and make informed decisions.
3. Understanding Volume in Different Market Conditions
a. Volume in Uptrends
When volume rises along with price, the uptrend is considered healthy. Buyers are active and willing to buy at higher levels.
Signs of strong uptrend:
Price ↑ and Volume ↑ → Strong bullish trend
Pullback with low volume → Healthy correction
Signs of weakening uptrend:
Price ↑ but Volume ↓ → Weak trend, risk of reversal
b. Volume in Downtrends
In downtrends, high volume indicates strong selling pressure.
Strong downtrend signals:
Price ↓ and Volume ↑ → Strong bearish trend
Pullback with low volume → Continuation likely
Weak downtrend signals:
Price ↓ but Volume ↓ → Bear trend losing strength
c. Volume in Ranging Markets
In sideways markets, volume generally remains low. A sudden volume spike during range breakout signals trend formation.
4. How to Use Volume for Trading – Practical Techniques
Technique 1: Volume Breakout Trading
Breakouts are powerful signals but also come with fake moves. Volume confirms the authenticity.
Bullish breakout confirmation:
Price breaks resistance
Volume rises above average
Candle closes above breakout level
Bearish breakout confirmation:
Price breaks support
Volume spikes downward
Close is below the support level
Without volume confirmation, breakouts often fail and trap traders.
Technique 2: Volume Divergence
Divergence occurs when price and volume move opposite.
Examples:
Price making higher highs but volume making lower highs → Bullish trend weakening
Price making lower lows but volume decreasing → Bearish trend weakening
Such divergence often signals trend reversal.
Technique 3: Volume Spike Analysis
Sudden large volume spikes can mean:
A big player entering or exiting a position
Market turning point
Start of strong trend
At market bottoms, huge buying volume often appears. At tops, big selling volume may signal reversal.
Technique 4: Using Volume with Indicators
Some popular volume-based indicators:
a. Volume Moving Average (VMA)
Shows average volume to identify when current volume is unusually high or low.
b. On-Balance Volume (OBV)
Adds volume on up days, subtracts on down days to show accumulation/distribution.
c. Volume Weighted Average Price (VWAP)
Used by institutional traders; shows average price weighted by volume.
d. Money Flow Index (MFI)
Combines price and volume to detect overbought/oversold zones.
Using these indicators with price action increases trading accuracy.
5. Volume and Candlestick Patterns
Volume adds strength to candlestick signals.
Examples:
Bullish engulfing with high volume → Strong reversal
Hammer with high volume at support → Buyers entering
Doji with high volume → Indecision among big players
Volume validates candlestick reliability.
6. Volume and Support/Resistance Levels
Support and resistance zones are crucial. Volume helps confirm their strength.
At Support:
Price touches support with low volume → Support likely to hold
Price breaks support with high volume → Strong breakdown
At Resistance:
Price hits resistance with low volume → Resistance holding
Breaks resistance with high volume → Breakout confirmed
Volume acts as the deciding factor in whether levels hold or break.
7. How Smart Money Uses Volume
Institutional traders use volume to accumulate or distribute positions quietly.
Accumulation phase:
Price stays in range
Volume gradually increases
No big price movement
This indicates smart money buying.
Distribution phase:
Price stops rising
Volume spikes at peaks
Smart money selling to retail traders
Recognizing these phases helps traders identify big trends early.
8. Common Mistakes Traders Make with Volume
a. Believing every volume spike means breakout
Volume should be analyzed with price action, not in isolation.
b. Ignoring trend context
High volume in a range is meaningless unless combined with price breakout.
c. Misreading low-volume pullbacks
These are actually healthy for trends, not signs of weakness.
d. Trading without confirming volume
Entering trades based on price alone increases risk.
9. Best Practices for Volume Trading
Compare volume with average volume, not previous candles
Combine volume with trendlines, levels, and patterns
Avoid trading false breakouts without volume confirmation
Watch volume at key supports/resistances
Use volume indicators only as a supplement
Focus on multi-timeframe volume behavior
These practices significantly improve trading accuracy.
Conclusion
Trading with volume gives traders an edge by revealing the hidden strength behind price movements. Volume confirms trends, validates breakouts, identifies reversals, and exposes the actions of big players. When used correctly with price action, support/resistance, and technical indicators, volume becomes one of the most reliable tools in trading. For both beginners and advanced traders, mastering volume analysis is essential for smart, confident, and profitable trading decisions.
Consumption Trends Unveiled1. Digital-First Consumer Behavior
One of the most significant modern trends is the shift toward digital-first consumption. With widespread internet accessibility and smartphone use, consumers increasingly prefer online channels for shopping, content consumption, financial transactions, and communication.
E-commerce has become a dominant retail model. Consumers now expect convenience, instant access to products, and seamless delivery systems. Online marketplaces are expanding rapidly due to personalized recommendations, competitive pricing, and wider product varieties. Additionally, social commerce—shopping directly through social media platforms—is gaining momentum, especially among younger generations who trust peer reviews and influencer endorsements.
Beyond retail, digital consumption includes streaming platforms for entertainment, digital banking, telemedicine, and online education. Every sector is witnessing a digital transformation as consumers adopt technology for efficiency, comfort, and lower costs.
2. Personalization and Customization
Modern consumers crave personalization. They want experiences, products, and services tailored specifically to their preferences. This trend is driven by AI-powered recommendation engines, data-driven marketing, and a deeper understanding of customer behavior.
Companies are using analytics to segment consumers based on browsing patterns, purchase history, lifestyle choices, and social media behavior. Personalized subscription boxes, curated shopping experiences, customized nutrition plans, and smart home devices that learn user habits are prime examples.
Moreover, consumers are increasingly involved in the creation process. Brands that offer customizable options—such as personalized shoes, tailored skincare, or adjustable meal plans—gain a competitive edge. Personalization not only enhances customer satisfaction but also builds strong brand loyalty.
3. Sustainability and Conscious Consumption
Environmental awareness is reshaping global consumption patterns. Today’s consumers, particularly Millennials and Gen Z, are more conscious of climate change, resource scarcity, and environmental impact. This has led to the rise of eco-friendly products, sustainable packaging, and ethical manufacturing.
Consumers prefer brands that adopt green practices, source responsibly, and maintain transparency in their supply chains. The shift toward plant-based foods, renewable energy products, slow fashion, and biodegradable items reflects this growing eco-conscious mindset.
Secondhand marketplaces, recycling initiatives, and circular economy models (where products are reused, refurbished, or recycled) are also becoming mainstream. As sustainability influences purchasing decisions, companies must adapt to remain relevant and trustworthy.
4. Health, Wellness, and Holistic Living
Health and wellness have evolved from niche trends to global consumption drivers. Consumers increasingly prioritize physical fitness, mental well-being, and preventive healthcare. This shift accelerated due to the pandemic, which heightened awareness of health risks.
Demand for nutrition-rich foods, organic products, immunity-boosting supplements, and wellness services has surged. Fitness apps, wearable devices, and virtual workout platforms have gained popularity due to convenience and personalization.
Mental health has also emerged as a key focus, with consumers seeking mindfulness apps, relaxation products, therapy services, and work-life balance solutions. The wellness economy has expanded to include sleep technology, ergonomic home products, and wellness tourism.
5. Experience-Driven Consumption
Another major trend is the shift from product ownership to experience-driven consumption. Consumers now value memorable experiences—travel, entertainment, dining, adventure, and cultural activities—over material possessions.
The “experience economy” is thriving:
Travel and tourism industries focus on curated, immersive experiences.
Restaurants emphasize unique concepts and ambiance.
Events, festivals, and pop-up activities attract large audiences.
Virtual reality and augmented reality are creating new entertainment formats.
Younger consumers especially prioritize experiences that reflect self-expression and social identity. Sharing experiences online amplifies this trend, as people seek activities that are “social media worthy.”
6. Rise of Subscription-Based Models
Subscription services have grown exponentially across various industries. Consumers prefer ongoing access over one-time purchases because subscriptions offer convenience, value, and regular upgrades.
Popular examples include:
Streaming platforms like Netflix and Spotify
Subscription boxes for beauty, fashion, and fitness
Cloud storage and software services
Meal kits and grocery subscriptions
Auto-subscription for household essentials
Businesses benefit from predictable revenue streams, while consumers enjoy flexibility, personalization, and frequent content or product updates.
7. Other Emerging Trends
The Sharing Economy
Consumers increasingly participate in shared consumption models, such as ride-sharing, coworking spaces, community rentals, and shared mobility solutions. This trend reduces ownership costs and supports sustainability.
Localism and Hyper-Localization
Many consumers prefer locally produced goods due to their freshness, authenticity, and community support. Pandemic-driven supply chain disruptions accelerated this trend.
Financial Consciousness
Economic uncertainty has made consumers more value-driven. They seek discounts, compare prices across platforms, and prioritize financial planning tools. Buy Now Pay Later (BNPL) services, digital wallets, and micro-investing platforms are growing.
8. Drivers Behind Changing Consumption Patterns
Several key forces are influencing modern consumption trends:
Technological Advancements
AI, machine learning, IoT, and big data have transformed how businesses understand and target consumers.
Demographic Shifts
A younger, tech-savvy generation is reshaping consumption priorities, while aging populations create demand for healthcare services and age-friendly products.
Globalization
Consumers have access to global brands, ideas, and experiences, leading to diverse preferences.
Socioeconomic Changes
Rising incomes in developing nations and middle-class expansion influence spending power and lifestyle aspirations.
Cultural Evolution
Social media, global trends, and peer influence redefine consumption norms and expectations.
9. Implications for Businesses and Markets
Understanding consumption trends is critical for companies to stay competitive. Businesses must:
Adopt digital-first strategies
Enhance personalization efforts
Focus on sustainability
Innovate new customer experiences
Strengthen e-commerce capabilities
Build trust through transparency
Offer flexible subscription or hybrid models
Companies that fail to recognize these changes risk losing relevance in an economy driven by dynamic consumer expectations.
Conclusion
Consumption trends today are shaped by a combination of technology, demographics, values, and global economic shifts. As consumers evolve, businesses must rethink their strategies, products, and services to meet emerging demands. The future will belong to organizations that understand their customers deeply, innovate continuously, and prioritize sustainability, personalization, and digital transformation.
Part 7 Trading Master Class Basics of Options in India
An option is a derivative contract that gives the holder the right but not the obligation to buy or sell an underlying asset (like Nifty, Bank Nifty, or a stock) at a predetermined price (called the strike price) before or on a specified date (expiry).
Call Option (CE): Gives the right to buy.
Put Option (PE): Gives the right to sell.
Traders use options for:
Hedging (protecting portfolio losses)
Speculation (betting on price movements)
Income generation (using premium decay)
In India, options are traded on exchanges like NSE and BSE, primarily on indices (Nifty, Bank Nifty, FinNifty) and individual stocks.

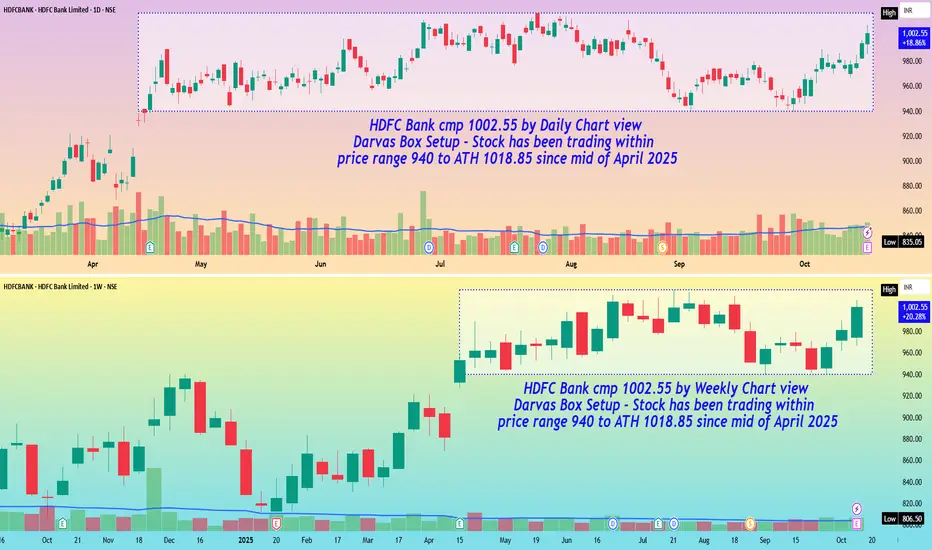
HDFC Bank cmp 1002.55 by Daily and Weekly Chart viewHDFC Bank cmp 1002.55 by Daily and Weekly Chart view
- Darvas Box Setup : Stock has been trading within price range 940 to ATH 1018.85 since mid of April 2025
- Stock chart has made Bullish Rounding Bottoms on both timeframes providing a technically logical upside target of +/- 1100 in the near future
Part 2 Support and ResistanceOption Trading Strategies
This is the most exciting part. Strategies range from simple to complex.
Beginner Strategies
Covered Call: Hold stock + sell call → generates income.
Protective Put: Hold stock + buy put → insurance against fall.
Cash-Secured Put: Sell put with enough cash reserved to buy stock if assigned.
Intermediate Strategies
Vertical Spread: Buy one option, sell another at different strikes.
Straddle: Buy call + put at same strike → profit from volatility.
Strangle: Buy call + put at different strikes.
Advanced Strategies
Iron Condor: Combines spreads to profit in low-volatility markets.
Butterfly Spread: Profit from limited movement near strike.
Calendar Spread: Exploit time decay by buying long-term and selling short-term options.
Risk Management in Options Trading
Options can wipe out capital if not managed properly. Key practices include:
Position Sizing: Never risk more than a fixed % of capital.
Stop Loss & Exit Rules: Define risk before entering.
Diversification: Avoid concentrating all trades on one asset.
Understanding Margin: Selling options requires large margin because risks are unlimited.
Hedging: Use spreads to limit risk.

Financial Markets1. Introduction
Financial markets are the backbone of modern economies, serving as platforms where individuals, companies, and governments can raise capital, trade financial instruments, and manage risks. They facilitate the flow of funds from surplus units (those with excess capital) to deficit units (those in need of funds), enabling economic growth and development.
At their core, financial markets serve three primary functions:
Price Discovery – determining the price of financial assets through supply and demand.
Liquidity Provision – enabling participants to buy and sell assets easily.
Risk Management – allowing participants to hedge against uncertainties like interest rate changes, inflation, or currency fluctuations.
2. Types of Financial Markets
Financial markets are broadly classified into several categories based on the nature of the assets traded and the maturity of the instruments.
2.1 Capital Markets
Capital markets are where long-term securities, such as stocks and bonds, are bought and sold. They are crucial for channeling savings into productive investments. Capital markets are further divided into:
2.1.1 Stock Markets
The stock market is where equity shares of companies are issued and traded. Equity represents ownership in a company, and investors earn returns through dividends and capital appreciation. Stock markets can be divided into:
Primary Market: Where companies issue new shares through Initial Public Offerings (IPOs) or Follow-on Public Offers (FPOs). It allows companies to raise long-term capital directly from investors.
Secondary Market: Where existing shares are traded among investors. This includes major exchanges like the New York Stock Exchange (NYSE), NASDAQ, and Bombay Stock Exchange (BSE).
Key functions of stock markets:
Facilitating capital formation.
Providing liquidity for investors.
Helping in price discovery and valuation of companies.
2.1.2 Bond Markets
Bond markets, or debt markets, involve the issuance and trading of debt securities such as government bonds, corporate bonds, and municipal bonds. Bonds allow governments and corporations to borrow funds from the public with a promise to repay principal and interest. Types of bonds include:
Government Bonds – low-risk, used to fund national projects.
Corporate Bonds – medium to high-risk, issued by companies for expansion.
Municipal Bonds – issued by local governments to fund infrastructure projects.
2.2 Money Markets
Money markets deal with short-term borrowing and lending, typically with maturities of less than one year. They are essential for managing liquidity and short-term funding needs. Common instruments in money markets include:
Treasury Bills (T-Bills) – short-term government securities.
Commercial Paper (CP) – unsecured, short-term debt issued by corporations.
Certificates of Deposit (CDs) – issued by banks for fixed short-term deposits.
Repurchase Agreements (Repos) – short-term borrowing secured against securities.
Money markets are highly liquid and considered low-risk. They play a crucial role in interest rate determination and monetary policy implementation.
2.3 Derivatives Markets
Derivatives are financial instruments whose value depends on an underlying asset, such as stocks, bonds, currencies, commodities, or indices. They are primarily used for hedging risk, speculation, and arbitrage. Common derivatives include:
Futures Contracts – agreements to buy or sell an asset at a predetermined price on a future date.
Options Contracts – giving the right, but not the obligation, to buy or sell an asset.
Swaps – contracts to exchange cash flows, such as interest rate or currency swaps.
Forwards – customized contracts to buy or sell an asset at a future date.
Derivatives markets help stabilize prices, manage risk, and improve market efficiency.
2.4 Foreign Exchange (Forex) Markets
The forex market is the global marketplace for trading currencies. It determines exchange rates and facilitates international trade and investment. Key participants include central banks, commercial banks, hedge funds, multinational corporations, and retail traders. The forex market is the largest financial market in the world, with daily trading exceeding $6 trillion.
Functions:
Facilitates international trade and investment.
Helps hedge against currency risks.
Influences inflation and interest rates globally.
2.5 Commodity Markets
Commodity markets trade physical goods like gold, silver, oil, agricultural products, and industrial metals. They can be classified into:
Spot Markets – trading commodities for immediate delivery.
Futures Markets – trading contracts for future delivery, helping producers and consumers hedge against price fluctuations.
Commodity markets are essential for price discovery, risk management, and economic planning.
3. Functions of Financial Markets
Financial markets perform several key functions that sustain economic growth:
Mobilization of Savings – They convert individual savings into productive investments.
Resource Allocation – Financial markets ensure efficient allocation of funds to projects with the highest potential returns.
Price Discovery – Markets determine prices based on supply and demand.
Liquidity Provision – Investors can convert securities into cash quickly.
Risk Management – Derivatives and insurance instruments help mitigate financial risks.
Reduction in Transaction Costs – Centralized markets reduce costs of buying and selling securities.
Economic Indicator – Financial market trends often signal economic conditions, growth, or recessions.
4. Participants in Financial Markets
Various participants operate in financial markets, each with distinct roles and objectives.
4.1 Individual Investors
Individuals invest in stocks, bonds, mutual funds, and ETFs for wealth creation, retirement planning, and income generation.
4.2 Institutional Investors
Large organizations, such as mutual funds, pension funds, insurance companies, and hedge funds, participate with significant capital, influencing market movements.
4.3 Corporations
Corporations raise capital by issuing equity or debt and may also hedge risks using derivatives.
4.4 Governments
Governments issue bonds to finance deficits, regulate financial markets, and implement monetary policies.
4.5 Intermediaries
Banks, brokers, and investment advisors facilitate transactions, provide liquidity, and offer investment guidance.
5. Instruments Traded in Financial Markets
Financial markets involve a wide variety of instruments:
Equities (Stocks) – ownership in companies.
Debt Instruments (Bonds, Debentures, CPs) – borrowing contracts.
Derivatives (Futures, Options, Swaps) – risk management instruments.
Foreign Exchange (Currency pairs) – global currency trading.
Commodities (Gold, Oil, Wheat, etc.) – physical or derivative-based trade.
Mutual Funds & ETFs – pooled investment vehicles.
Cryptocurrencies (Bitcoin, Ethereum, etc.) – emerging digital assets.
6. Regulatory Framework
Financial markets are heavily regulated to maintain transparency, fairness, and investor protection. Regulatory bodies include:
Securities and Exchange Board of India (SEBI) – regulates Indian securities markets.
U.S. Securities and Exchange Commission (SEC) – oversees American securities markets.
Commodity Futures Trading Commission (CFTC) – regulates derivatives and commodity trading.
Central Banks – control money supply, interest rates, and banking regulations.
Regulation ensures stability, reduces fraud, and maintains investor confidence.
7. Technology and Financial Markets
Technological advancements have transformed financial markets:
Algorithmic Trading – automated trading using mathematical models.
High-Frequency Trading (HFT) – executing large volumes of trades in milliseconds.
Blockchain and Cryptocurrencies – decentralized, secure trading platforms.
Robo-Advisors – AI-based investment advisory services.
Mobile Trading Apps – enabling retail investors to trade seamlessly.
Technology improves efficiency, reduces costs, and increases accessibility.
8. Challenges in Financial Markets
Despite their benefits, financial markets face several challenges:
Market Volatility – prices can fluctuate due to economic, political, or global events.
Fraud and Manipulation – insider trading and market rigging remain risks.
Liquidity Risks – lack of buyers or sellers can affect market stability.
Regulatory Gaps – outdated regulations may fail to address new instruments.
Global Interconnectivity – crises in one market can affect others globally.
9. Recent Trends
Modern financial markets are evolving rapidly:
ESG Investing – focus on environmentally and socially responsible investments.
Digital Assets – growth of cryptocurrencies and tokenized securities.
Sustainable Finance – promoting green bonds and renewable energy projects.
Globalization of Markets – increased cross-border investments.
Financial Inclusion – mobile and digital platforms enabling wider participation.
10. Conclusion
Financial markets are the lifeblood of the global economy. They channel funds efficiently, provide investment opportunities, allow risk management, and drive economic growth. With technological advancements, regulatory oversight, and innovative instruments, financial markets continue to evolve, shaping the modern financial landscape.
Understanding these markets is crucial for investors, policymakers, and corporations to make informed decisions and navigate the complexities of the financial world.

Mastering the Art of Risk Management in Trading 1. Introduction: Why Risk Management is the Heart of Trading
Trading is not about making big profits quickly — it’s about staying in the game long enough to let your edge work for you.
Think of trading like a professional sport. Skill matters, but survival matters more. Even the world’s best traders lose trades; what separates them from amateurs is how they manage those losses.
In simple terms:
Good trading without risk management = gambling.
Average trading with strong risk management = long-term success.
Warren Buffett’s famous rules apply perfectly here:
Don’t lose money.
Never forget rule #1.
2. Core Principles of Risk Management
Before we go deep into strategies, let’s lock in the foundation.
2.1 Risk is Inevitable
Every trade carries risk. The goal is not to avoid it but to control its size and impact.
2.2 Asymmetry in Trading
A 50% loss requires a 100% gain to break even. This means avoiding large drawdowns is far more important than chasing big wins.
Loss % Required Gain to Recover
10% 11.1%
25% 33.3%
50% 100%
75% 300%
2.3 Risk per Trade
Most professional traders risk 0.5%–2% of their account per trade.
This ensures no single bad trade can destroy the account.
3. The Psychology of Risk
Risk management is not just math — it’s deeply psychological.
Loss Aversion Bias: Humans feel losses twice as strongly as gains. This can push traders into revenge trading.
Overconfidence Bias: Winning streaks can lead to oversized positions.
Fear of Missing Out (FOMO): Chasing trades without proper entry rules increases risk.
A great risk management system removes emotional decision-making by setting clear, mechanical rules.
4. Position Sizing: The Risk Control Lever
Position sizing determines how much capital to put into a trade. Even if your strategy is perfect, bad sizing can blow up your account.
4.1 Fixed Fractional Method
Risk a fixed % of capital per trade.
Example: If account = ₹10,00,000 and risk = 1% → Risk per trade = ₹10,000.
If Stop Loss = ₹50 away from entry, position size = ₹10,000 ÷ ₹50 = 200 shares.
4.2 Volatility-Based Position Sizing
Adjust position size according to the volatility of the asset (ATR – Average True Range).
If ATR = ₹25 and your risk budget = ₹5,000, position size = ₹5,000 ÷ ₹25 = 200 shares.
4.3 Kelly Criterion (Advanced)
Maximizes capital growth based on win rate & reward/risk ratio.
Formula: K% = W – (1 – W) / R
Where:
W = Win probability
R = Reward/Risk ratio
Caution: Kelly is aggressive; use fractional Kelly for real trading.
5. Stop Loss Strategies: Your Safety Net
A stop loss is not a sign of weakness — it’s a shield.
5.1 Fixed Stop Loss
Predefined point in price where you exit.
5.2 Volatility Stop Loss
Adjust stop distance using ATR to account for market noise.
5.3 Time-Based Stop
Exit after a fixed time if the trade hasn’t moved in your favor.
5.4 Trailing Stop
Moves with price in your favor to lock in profits.
Golden Rule: Place stops based on market structure, not emotions.
6. Reward-to-Risk Ratio (RRR)
The RRR tells you how much you stand to gain for every unit you risk.
Example:
Risk: ₹1000
Reward: ₹3000
RRR = 3:1 → Even a 40% win rate is profitable.
High RRR trades allow more losers than winners while staying profitable.
7. Diversification & Correlation Risk
7.1 Asset Diversification
Avoid putting all capital into one asset or sector.
7.2 Correlation Risk
If you buy Nifty futures and Bank Nifty futures, you’re effectively doubling your risk because they move together.
8. Risk Management for Different Trading Styles
8.1 Day Trading
Keep daily loss limits (e.g., 3% of capital).
Avoid revenge trading after a loss.
8.2 Swing Trading
Use wider stops to allow for multi-day fluctuations.
Position sizing becomes even more critical.
8.3 Options Trading
Risk can be higher due to leverage.
Always calculate max loss before entering.
9. Risk Management Tools
ATR Indicator – For volatility-based stops.
Position Size Calculators – To control exposure.
Heat Maps & Correlation Tools – To avoid overexposure.
Journaling Software – To track mistakes.
10. Risk-Adjusted Performance Metrics
Professional traders measure performance relative to risk taken.
Sharpe Ratio – Risk-adjusted returns.
Sortino Ratio – Focuses on downside volatility.
Max Drawdown – Largest account drop during a period.
11. Building a Personal Risk Management Plan
Your plan should cover:
Max % of capital risked per trade.
Max daily/weekly loss limit.
Position sizing rules.
Stop loss & target placement method.
Diversification guidelines.
Rules for scaling in/out.
Plan for handling drawdowns.
12. Advanced Concepts
12.1 Portfolio Heat
Sum of all open trade risks; keep it below a set % of account.
12.2 Value at Risk (VaR)
Estimates the max expected loss over a time frame.
12.3 Stress Testing
Simulate worst-case scenarios (e.g., gap downs, black swans).
Conclusion: Risk Management is Your Superpower
In trading, capital is ammunition. Risk management ensures you never run out of bullets before the big opportunities arrive.
Mastering it is not optional — it’s the difference between a short-lived hobby and a long-term career.
Part7 Trading Master ClassPractical Tips for Success
Backtest strategies on historical data.
Start with paper trading before using real money.
Track your trades in a journal.
Combine technical analysis with options knowledge.
Trade liquid options with tight bid-ask spreads.
Final Thoughts
Options are like a Swiss Army knife in trading — versatile, powerful, and potentially dangerous if misused. The right strategy depends on:
Market view (up, down, sideways, volatile, stable)
Risk tolerance
Timeframe
Experience level
By starting with basic strategies like covered calls or protective puts, then moving into spreads, straddles, and condors, you can build a strong foundation. With practice, risk management, and discipline, options trading can be a valuable tool in your investment journey.

Hdfc Bank: Go Short till 1940.50 stop 2053Hdfc Bank consolidation is happening and it may retrace down to it's trend support line Near 1940. Keep an eye towards rejection 2030 where it may get hurdle and nay fall to take a support.
It's a regular pattern for this script.. Ut recently made anew high on the charts.
Hurdle 2035-2050
Support 1940.50

HDFCBANK – Bullish Potential Post Results, But OI Shows Bearish________________________________________________________________________________📈 HDFCBANK – Bullish Potential Post Results, But OI Shows Bearish Overhang
📅 Setup Date: 17.07.2025 | ⏱ Timeframe: Daily
📍 Strategy: Post-Earnings Reaction Play with Mixed Sentiment in Options
________________________________________________________________________________
🔍 Overall View
Spot Price: ₹1957.4
Trend: Mixed – Strong Q1 results (profit ↑12%, bonus/dividend declared), but price action weak
Volatility: High IVs — Calls ~23–25%, Puts ~29–32% → post-result event premium still elevated
Ideal Strategy Mix: Neutral-to-bullish spreads with defined risk or post-IV crush contrarian longs
________________________________________________________________________________
1️⃣ Bullish Trade (Contrarian Setup with Fundamental Trigger)
Best CE: Buy 1980 CE @ ₹24.2
Why:
• Strong earnings + corporate action (bonus/dividend) → triggers potential sentiment reversal
• CE 1980 saw Short Build-Up (+144% OI), premium ↓25% → ideal for short-covering setup
• Delta ~0.41 with high IV (~24.3%) → moderate leverage & gamma in case of price breakout
• Use only if price breaks and sustains above ₹1975 with strong candle + volume
________________________________________________________________________________
2️⃣ Bearish Trade (Trend Following)
Best PE: Sell 1900 PE @ ₹16.65
Why:
• PE 1900 saw massive Long Build-Up (+70%) but IV surged → may now face decay pressure
• Selling this deep OTM PE gives ~₹57 buffer from spot (≈3% downside cushion)
• Post-results, downside may be limited → good candidate to play post-IV crush
• Spot stability around 1950–1960 invalidates aggressive downside
________________________________________________________________________________
3️⃣ Strategy Trade (Defined Risk Based on Mixed Setup)
Strategy: Bull Call Spread → Buy 1980 CE / Sell 2020 CE
→ ₹24.2 / ₹10.7
Net Debit: ₹13.50
Max Profit: ₹40 (spread width) – ₹13.5 = ₹26.5
Max Loss: ₹13.50
Risk:Reward: ≈ 1 : 1.96 ✅
Lot Size: 550
Total Risk: ₹7,425
Max Profit: ₹14,575
📊 Breakeven Point: ₹1993.5
📉 Reversal Exit Level: Exit if Spot < ₹1940 (invalidates breakout + earnings move fade)
________________________________________________________________________________
Why:
• Bullish news (Q1 beat, bonus/dividend) could trigger CE short covering if price moves above 1980
• Limited risk strategy — works well if post-result rally is moderate
• High IVs favour spread over naked options (caps loss from premium crush)
• CE OI from 1960–2060 mostly short → if momentum picks up, rally could be fast
________________________________________________________________________________
📘 My Trading Setup Rules
Avoid Gap Plays
→ Check pre-open price action to avoid trades influenced by gap-ups/gap-downs.
Breakout Entry Only
→ Enter trades only if price breaks previous day’s High (for bullish trades) or Low (for bearish trades).
Watch Volume for Confirmation
→ Monitor volume closely. No volume = No trade.
Enter on Strong Candle + Volume
→ Execute the trade only if a strong candle appears with increasing volume in the direction of the trade.
Defined Risk:Reward Only
→ Take trades only if R:R is favourable (ideally ≥ 1:2).
Premium Disclaimer
→ Option premiums shown are based on EOD prices — real-time premiums may vary during execution.
Time Frame Preference
→ Trade with your preferred time frame — this strategy works across intraday or positional setups.
________________________________________________________________________________
⚠ Disclaimer (Please Read):
• These Trades are shared for educational purposes only and is not investment advice.
• I am not a SEBI-registered advisor.
• The information provided here is based on personal market observation.
• No buy/sell recommendations are being made.
• Please do your own research or consult a registered financial advisor before making any trading decisions.
• Trading involves risk. Always use proper risk management.
I am not responsible for trading decisions based on this post.
________________________________________________________________________________

HDFCBANK – Stepping Into Bullish Territory?📈 HDFCBANK – Stepping Into Bullish Territory?
🔍 Strong Long Build-Up | Option Chain + Price Action Alignment
Chart Type: 15-min / 1H / Daily
Indicators: STWP Zones, Demand-Supply, Volume, OI Trends
🔹 What’s Catching Our Eye?
✅ Consistent Long Build-Up seen from 2000 CE to 2100 CE
✅ Massive OI Addition on 2040 CE (+6.33 lakh contracts = +50%)
✅ 2060 CE OI jumped +8.57 lakh = +82% – Serious bullish interest building up
✅ Put Writers exiting 2000 PE = Strong base forming around ₹2000
✅ Spot Price at ₹2012, sitting above psychological level
📊 What We’re Watching for:
📍 Breakout Zone: 2020–2040
📍 Targets: 2060 → 2080 → 2100
📍 Invalidation Below: 1985
📍 Momentum Confirmation: Strong close above 2040 with volume surge
📍 Option Chain Support: Heavy unwinding on 2000 PE confirms strength
📌 Trade Plan (Educational Purpose Only):
🔹 Bullish Idea: Buy above 2025 breakout with SL below 1985
🔹 Options: Look at 2040 or 2060 CE for directional exposure
🔹 BTST/Positional: If price closes above 2040 with rising OI and IV
⚠️ Disclaimer:
This post is for educational and learning purposes only.
It does not constitute buy/sell advice or investment recommendation.
Always consult your financial advisor before taking any positions.
STWP is not liable for any financial decisions based on this content.
📚 “Price is the headline, but data is the real story.”
💬 Will HDFCBANK reclaim its momentum zone, or is this just noise before the next move?
Institutional Option Trading Institutional Option Trading
Institutional option trading involves using options as part of sophisticated strategies to hedge risk, enhance returns, or speculate.
Objectives of Institutional Option Trading
Hedging: Protecting large portfolios against market downturns.
Income Generation: Selling options to collect premiums.
Speculation: Taking directional bets with options.
Arbitrage: Exploiting price inefficiencies across markets.
Common Institutional Option Strategies
Covered Call Writing: Selling call options against stock holdings to generate income.
Protective Puts: Buying puts to insure portfolios against downside risk.
Spreads (Vertical, Horizontal, Diagonal): Limiting risk while aiming for a defined profit range.
Straddles and Strangles: Betting on volatility, regardless of market direction.
Iron Condors: Selling out-of-the-money calls and puts to profit from low volatility.

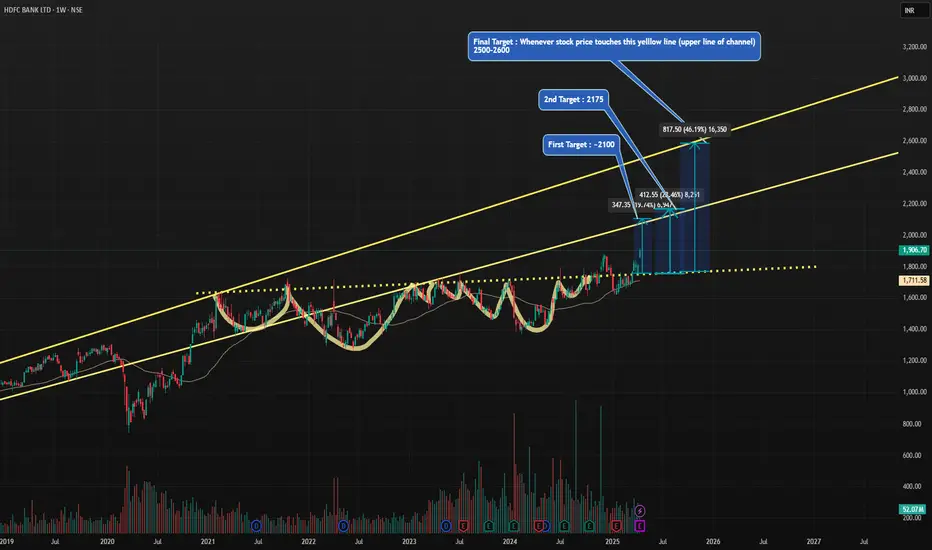
HDFC BANK : 45-50% upside possible in 1.5 Years. BODHi friends,
Targets are mentioned in the self explanatory chart .
HDFC Bank is the largest private sector bank having all time high profitability & sells .
It has well controlled gross and net NPA compared to its peers .
There is a very good probability for the stock to reward its investors with ~50% return .
Its a BOD (BUY ON DIPS) as per my analysis .
Please feel free to comment or share your views on my analysis .
Note : I am not SEBI registered advisor . Please consider my analysis for education purpose only .
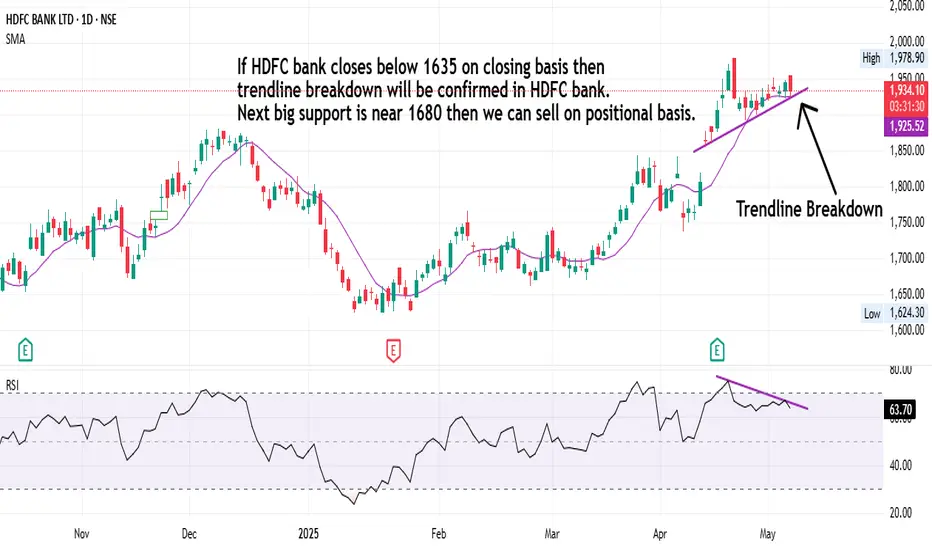
HDFC Bank Swing Trading Strategies!If HDFC bank closes below 1635 on closing basis then trendline breakdown will be confirmed in HDFC bank. Next big support is near 1680 then we can sell on positional basis.
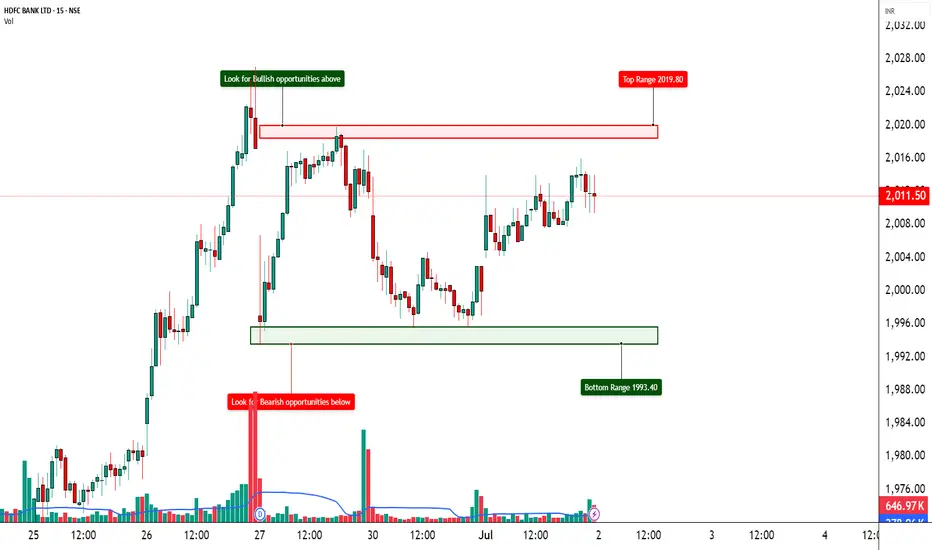
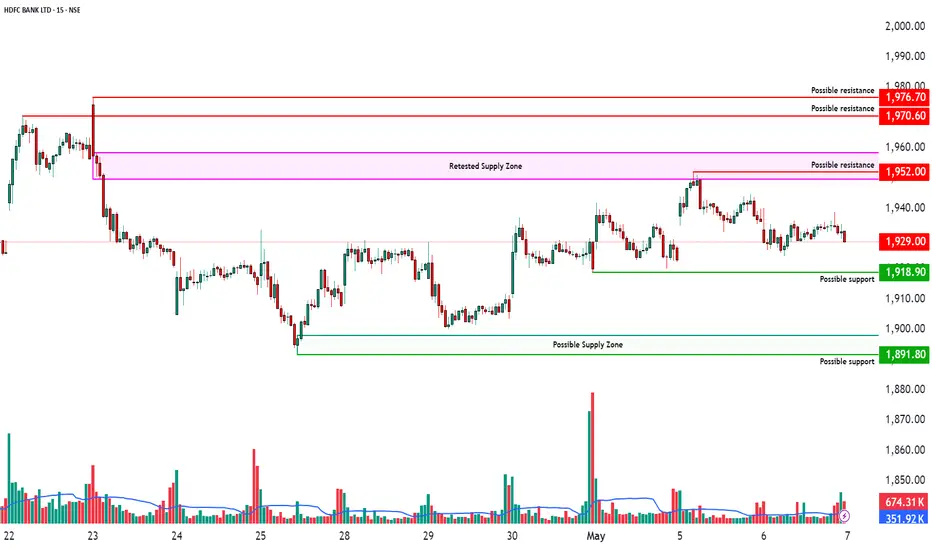
Range-Bound Between Key Supply & Demand Zones🏦 HDFC Bank Ltd – Range-Bound Between Key Supply & Demand Zones 📊
Timeframe: 15-Minute | Exchange: NSE | Date: May 6, 2025
CMP: 1,929.00
🔴 Retested Supply Zone: 1949.60 - 1958.40
This zone previously acted as resistance after a sharp fall.
Price revisited the zone but was rejected, indicating potential selling pressure.
A breakout above this level could trigger bullish continuation.
🟢 Possible Demand Zone: 1898 - 1891.80
Price rebounded from this zone earlier, showing possible accumulation by buyers.
Not confirmed yet with multiple tests, but worth watching for potential support.
Breakdown below this may open the door to further downside.
📌 Current Price Action
HDFC Bank is currently consolidating between these two zones.
No clear trend yet; price is oscillating sideways.
Volume is decreasing, indicating lack of momentum in either direction.
📈 Levels to Watch
Breakout Zone: 1,959+
Breakdown Zone: 1,890-
🔍 Observational Bias
Bearish Bias: If price revisits 1949.60 - 1958.40 zone and shows rejection, potential short setups may emerge.
Bullish Bias: If price retests 1898 - 1891.80 with bullish confirmation, long trades may be considered.
Falling Wedge Breakout with Bullish Structure | 15-Min Chart🏦 HDFC BANK LTD – Falling Wedge Breakout with Bullish Structure | 15-Min Chart
📅 Date: April 25, 2025
📈 Timeframe: 15-Minute
🔍 Stock: HDFC Bank Ltd (NSE)
📌 Technical Overview:
HDFC Bank is showing signs of a potential bullish reversal on the 15-minute chart, forming a falling wedge pattern, which is typically known for reversal setups. Price action suggests a breakout from the wedge structure, with strong volume support.
🧩 Chart Pattern:
A clear Falling Wedge is identified using two converging trendlines (red).
Within the wedge, price completed a potential AB=CD harmonic structure, bottoming out near ₹1,891.
The breakout candle has closed above the upper trendline, signaling early strength.
🔍 Key Price Levels:
Support Zone: ₹1,891.80 (marked in red)
Immediate Resistance: ₹1,933.00 (green horizontal line)
CMP: ₹1,917.70
A sustained move above ₹1,933 may open room for further upside, potentially towards the ₹1,960–₹1,980 range as per the chart projection.
📊 Volume Analysis:
Noticeable pickup in green volume bars on the breakout candle.
This confirms growing interest and participation from the bulls.
🧠 Observational Bias:
As long as the price holds above ₹1,891 and sustains the breakout, the short-term trend appears to be tilting in favor of buyers. A retracement or retest of the wedge breakout zone may offer additional confirmation.

HDFC BANK LIMITED set to move upHDFC bank limited is having support at multiple timeframe and consolidating for some time.
looks good to buy cmp with sl below 1600.

Hdfc Bank cmp 1656.75 by Weekly Chart viewHdfc Bank cmp 1656.75 by Weekly Chart view
- Price Band 1725 to 1775 Resistance Zone
- Stock has been trading majorly in a price range of 1360 to 1725
- The Stock made an ATH 1880 in December 2024 to sustain just briefly
- The stock has once again broken down to be back within the trading range
- Volumes are gradually falling post the ATH and below average traded quantity

HDFC Bank Positional Short Trade Setup!HDFC Bank daily candle closed below 10 and 50 MA. If HDFCbank break downtrending channel create fresh shorts positions around 1740, 1745, with stop - 1770, for target - 1680. (Time Frame 5-6 Day's)
