HDFCBANK - Extended Retracement Phase
📊 HDFC Bank – Daily Chart Update | Extended Retracement Phase
Timeframe: 1D
Trend Context: Medium-term correction within a broader structure
Current Price: ~₹925
🔍 What Changed from Previous Analysis? (Important Update)
Earlier, we discussed an ABC correction nearing completion around the ₹960–965 zone.
📉 Price failed to hold that zone, leading to a deeper, extended retracement.
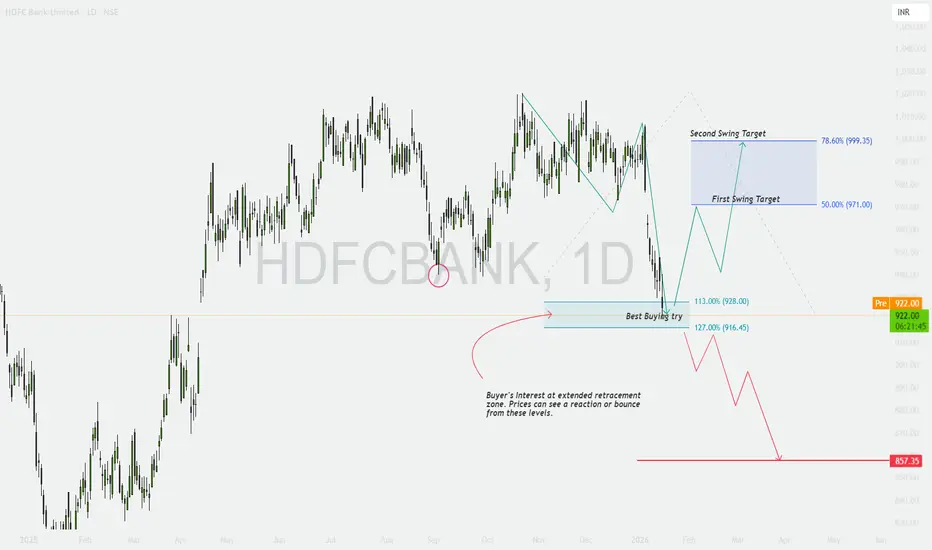
Now the structure has evolved into an extended Fibonacci retracement, where buyers may re-emerge, but with higher risk.
📐 Fibonacci-Based Structure (Educational)
From the prior swing low → swing high:
113% Retracement: ~₹928
127% Retracement: ~₹916
➡️ This ₹916–928 zone is now marked as a “Best Buying Try” area, not blind buying.
📘 Extended retracements often invite short-covering + value buying, but confirmation is mandatory.
📌 Key Levels to Watch (Updated)
🟢 Support / Demand Zones
Primary Demand: ₹916–928
Major Breakdown Level: ₹857
🔴 Resistance / Recovery Zones
First Swing Target: ₹971 (50% retracement)
Second Swing Target: ₹999 (78.6% retracement)
Major Supply: ₹1,018–1,020
🟢 Bullish Scenario (Conditional Recovery)
If price:
Holds ₹916–928
Forms a base / reversal structure (daily close improvement, higher low)
Then:
First bounce toward ₹960–971
Sustained strength can extend toward ₹995–1,000
📈 This would be a relief rally, not trend reversal yet.
🔴 Bearish Scenario (Risk Case)
If price:
Breaks below ₹916 with daily close
Then:
Extended correction likely
Downside opens toward ₹880 → ₹857
📉 Below ₹916, buyers lose positional control.
🎓 Educational Insights
Extended retracements = high reward but high patience trades
Buying zones ≠ buying signals
Daily timeframe requires confirmation, not anticipation
Strong trends correct deeper before resuming
🧠 Options Trading View (Educational Only)
🟢 Near ₹916–928 (Only After Confirmation)
Bull Call Spread (ATM + OTM)
Put Credit Spread for range-bound recovery
🔴 If ₹916 Breaks
Bear Put Spread
Call Credit Spread near ₹960–980
⚠️ Avoid naked option selling in falling markets.
✅ DOs
✔ Wait for daily confirmation
✔ Trade zones, not emotions
✔ Use defined risk strategies
✔ Reduce position size during deep corrections
❌ DON’Ts
❌ Don’t average blindly
❌ Don’t assume every dip is the bottom
❌ Don’t ignore Fibonacci extensions
❌ Don’t overtrade volatility
🧾 Conclusion
HDFC Bank is now in an extended corrective phase.
The ₹916–928 zone is a potential demand area, but only confirmation will decide whether this becomes a base or a breakdown.
📌 Patience here is more profitable than prediction.
⚠️ Disclaimer
This analysis is for educational purposes only. I am not a SEBI registered analyst. Markets are risky, and I may be wrong. Please consult your financial advisor before trading.
Hdfcbankidea
HDFCBANK — 1H Technical Analysis
Timeframe: 1 Hour
Structure: Intermediate ABC correction within a broader uptrend
Current Price Zone: ~₹963
Trend Context: Higher-timeframe trend remains positive, short-term corrective phase in progress
🔍 Market Structure & Price Action (Educational View)
Price is currently forming an Intermediate corrective ABC structure after facing rejection near the ₹1,018–1,020 resistance band.
Wave (a): Sharp impulsive decline from the top
Wave (b): Retracement toward resistance, failed to make a new high
Wave (c): Ongoing decline, approaching a high-probability demand zone
This is a classic corrective pause, not a trend reversal unless key supports fail.
📌 Key Levels to Track
Major Resistance: ₹1,018–1,020
Reclaim Level (Trend Continuation): ₹975–980
ABC Completion / Demand Zone: ₹961–965
Critical Invalidation Level: ₹957
Breakdown Support (Risk Zone): ₹916
💡 Corrections often end where institutions previously accumulated — zones matter more than candles.
🟢 Bullish Scenario (Primary Plan)
If price holds above ₹961–965 and shows stabilization:
Confirmation signals to watch:
Bullish engulfing / strong rejection wick
Higher low on 15m–1h
Volume expansion on green candles
Upside Roadmap:
₹975 → ₹990 → ₹1,010
Sustained move above ₹980 opens doors for fresh highs over time
📘 This would confirm ABC completion and resumption of the larger uptrend.
🔴 Bearish Scenario (Risk Case)
If price breaks and sustains below ₹957:
ABC structure fails
Selling pressure may accelerate
Downside opens toward ₹930 → ₹916
📉 Below ₹957, probabilities shift from “buy-the-dip” to “protect capital”.
🎓 Educational Takeaways
Corrections are healthy pauses, not immediate sell signals
Always trade levels + confirmation, not hope
Bigger trend remains intact above ₹957
Sideways + choppy price = option sellers’ playground
🧠 Options Trading Strategies (Educational Only)
🟢 Bullish (Support Holds)
Strategy 1: Bull Call Spread
Buy ATM Call
Sell OTM Call (₹980/₹1000 zone)
Defined risk, lower theta decay
Strategy 2: Cash-secured Put (Aggressive)
Sell ₹960 PE only if price stabilizes
Suitable for experienced traders
🔴 Bearish (Support Breaks)
Strategy 1: Bear Put Spread
Buy ₹960 PE
Sell ₹920 PE
Risk-defined downside play
Strategy 2: Call Credit Spread
Sell ₹980 CE
Buy ₹1020 CE
Works best in breakdown + consolidation
⚠️ Avoid naked options near support zones.
✅ DOs
✔ Trade near key levels, not in the middle
✔ Use defined SL (₹957)
✔ Reduce position size during corrections
✔ Wait for price confirmation
❌ DON’Ts
❌ Don’t panic sell near demand zones
❌ Don’t over-leverage options during volatility
❌ Don’t assume every dip is a buying opportunity
❌ Don’t ignore higher-timeframe trend context
🧾 Summary & Conclusion
HDFC Bank is undergoing a controlled intermediate correction within a broader bullish structure.
The ₹961–965 zone is crucial — holding above this keeps the bullish roadmap intact, while a breakdown below ₹957 increases downside risk.
📌 Patience + confirmation = edge.
⚠️ Disclaimer
This analysis is for educational purposes only. I am not a SEBI registered analyst. Markets are risky, and I may be wrong. Please consult your financial advisor before taking any trade.

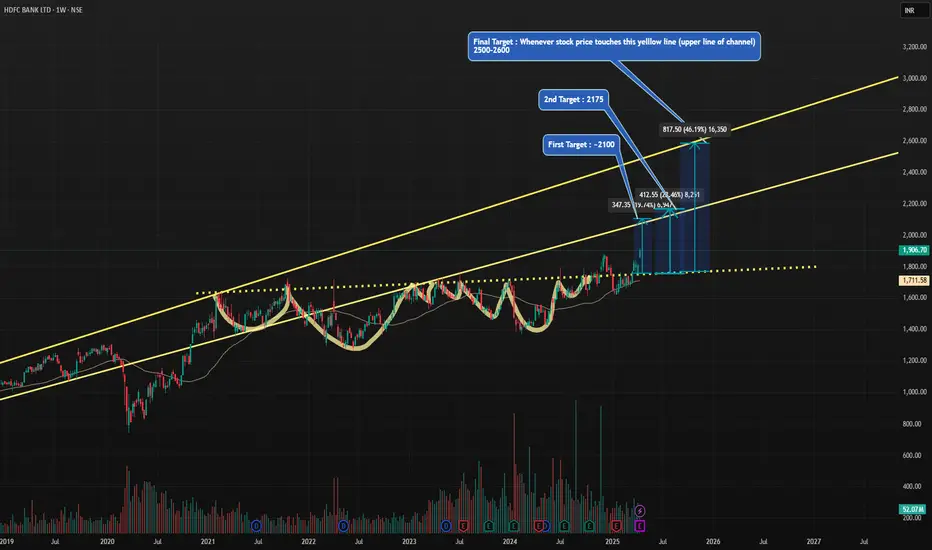
HDFC BANK : 45-50% upside possible in 1.5 Years. BODHi friends,
Targets are mentioned in the self explanatory chart .
HDFC Bank is the largest private sector bank having all time high profitability & sells .
It has well controlled gross and net NPA compared to its peers .
There is a very good probability for the stock to reward its investors with ~50% return .
Its a BOD (BUY ON DIPS) as per my analysis .
Please feel free to comment or share your views on my analysis .
Note : I am not SEBI registered advisor . Please consider my analysis for education purpose only .
HDFC Bank Positional Short Trade Setup!HDFC Bank daily candle closed below 10 and 50 MA. If HDFCbank break downtrending channel create fresh shorts positions around 1740, 1745, with stop - 1770, for target - 1680. (Time Frame 5-6 Day's)

HDFC Bank Cup & handle Breakout RetestHdfc bank retesting from its breakout of cup and handle chart pattern and also taking ema 200 as support and rsi oversold with trading upward channel hdfc bank is good for swing as per this set up

HDFC Bank cmp 1766.30 by Weekly Chart viewHDFC Bank cmp 1766.30 by Weekly Chart view
- Weekly Support at 1705 > 1622 > 1550 with the Resistance only at ATH 1794
- Stock seems trying to sustain above trading price range 1270 to 1735 since September 2024 by breakout attempts
- Stock attempted New ATH 1788 on 26-Sept-2024 yet again failed to sustain and broke down within trading range
- Stock attempted the New ATH 1794 in the 1st week of July 2024 but again failed to sustain and price broke down
- Stock attempted to cross ATH 1757.50 in the 1st week of July 2023 and failed to sustain, came back in price range
- Stock was trading within the price range 1270 to 1735 mostly since November 2020 with some breakout attempts seen

HDFC Bank will Breakout from 1722-1800 Range??HDFC bank trading in its upper range 1722-1800 which always acted as resistance.
In Weekly charts Cup & Handle Pattern is complete & also given breakout above 1722-1744 levels but as this range always acted as resistance so will wait for any correction or will buy after breakout of 1722-1800 range. Target will be 2222-2333 range. Trade with proper Risk Management & Happy Trading Thank You.

HDFC BANK Swing Long Update- HDFC Bank is currently trading at 1742
- HDFC bank followed my plan exactly the way I had predicted and anticipated it to play out
- HDFC Bank is now approaching a decent supply zone where we can possibly see a reaction from 1764
- HDFC Bank has printed and pulled Indexes too once this starts to cool off market might give a sudden downturn move watch out

HDFC Bank Ltd - Breakout OpportunityDate : 2-Aug-2024
LTP : Rs. 1,659.15
Next Resistances: (1) Rs. 1,721 --> (2) Rs. 1,794 --> (3) Rs. 1,921
SL : Rs. 1,532 on daily close basis
Technical View:
• NSE:HDFCBANK is in it's primary uptrend and was recently going through it's secondary downtrend.
• After touching the high of 1,794 on 3-Jul-2024, it has retraced 11% to 1,588.05 level.
• Post retracement NSE:HDFCBANK was going through accumulation phase and in last few sessions has given indication of starting a participation phase.
• On 26-Jul-2024, NSE:HDFCBANK has broke out from its secondary down trend with high volume.
• On 1-Aug-2024, NSE:HDFCBANK has closed above 21 DEMA and 20 DMA. Currently NSE:HDFCBANK is trading above 21 DEMA, 20 DMA and 50 DMA.
• RSI has entered buy zone on 1-Aug-2024 and currently trading at 58.16.
• MACD has given bullish cross over on 2-Aug-2024 and is trading at 1.09.
• Looking good to start a new swing from here.
Disclaimer : I am not a SEBI registered analyst/consultant and not recommending anyone to take any BUY or SELL position in stock market. Investing in stock market is risky and one should do a self analysis and validation before investing in stock market. My ideas are published for learning purpose only and are available to everyone at no cost/charge.

HDFC Bank retesting the break out zone, looks bullish.
The stock looks bullish as per the price action. There was a consolidation and a break out after a gap up opening creating a gap.
It has retest the break out zone and the gap is filled.
HDFC Bank has taken a good support from 1480-90 zone as there is a confluence of 200 ema, retest and fib retracement levels.
Entry :- Above 1528
Possible Targets :- 1556, 1588
Swing/positional targets in the stock are even more. As the entry in the stock will be created the targets will be revised with trailing the SL/.
Wait for the price action on the bullish side for the entry.

HDFC BANK Trade Setup Idea - HDFC BANK is currently trading 6.8% from my previous short analysis
- HDFC Bank can soon present a bullish scenario grab some orders and then flush out all the FOMO buyers
- IMO 1100-1250 is a very strong demand zone for HDFC bank
- HDFC bank can soon present an opportunity to bag it at cheap price
- I am still heavily bearish on HDFC
- Demand - 1180-1260, 700-850
- Supply - 1500-1600

HDFC BANK make or break !!!HDFC BANK near resistance !!
major resistance at 1670-1690 this is 7th attempt to break it !!
if good volume break then rally continues or else
previous support at 1450 levels
waiting for a clean break to enter

HDFC LIFE !Trend is neutral
Net Sales of 46,513cr has grown at 56.23%
Pat has grown at 20.84%
PE is too hot and high at 93.43%
mutual fund stake has increased from 4% to 4.66%past quarter
stock is a good buy at 520-560
Wait for the dip

HDFC Bank trendline support & triangle patternHDFC Bank taking support at same trendline from last 1 year & making triangle pattern if give close above 1620 in coming days then can see some move in HDFC BANK.
But HDFC Bank & HDFC merger will be there in next month around 20 July if some negative news comes or selling from funds then HDFC Bank will not move in upward direction at all

Hdfc Bank Monthly ChartThe stock is trading within a triangle pattern on monthly chart.
The high is tasted multiple time and chances are high to breakout near future.
Immediate resistance is placed at 1733.
I have mentioned all the important levels in the chart.
Like, Follow and Share.

HDFC BANK TARGETS based on current and fresh S/R LEVELSNSE:HDFCBANK can short hdfc bank till fresh support level and wait for it to be broken for further fall, best to book at fresh support and re enter short position once it gets retested as resistance , target can be last tested support area, avoid short if current resistance is broken.

HDFC Bank forming flag and pole pattern.HDFC Bank has been halting on the higher levels and is consolidating in a 3% range.
The stock has been forming a flag and pole pattern on weekly time frame.
The stock has closed near the resistance zone and is trading above the 20 DMA.
Banknifty has been forming new highs and HDFC has the high percentage in the index.
Trade can be carried in this stock for either side.
Bullish Target :- 1710
Bearish Target :- 1540
Stop loss should be less than 5-7 points.
Wait for the price to crosses and close outside the consolidation zone i.e. 1592-1638.
Swing, intraday and positional trade can be carried in this stock.

HDFCBANK 1D Breakout1. High chances of breakout after Multiple testing of level and 20 days consolidated in range.
2. Higher high and higher low last 5 days.
3. Possible long with 1st 1670 and 2nd 1720 with support at 1590.

HDFCBANK Daily AnalysisPennant Pattern observed in HDFCBANK
Can breakout go towards resistance tomorrow.
Target 1630.
Expecting breakout of pattern above 1630.

HDFC BANK RANGE Hdfc bank is moving within a parallel channel between 1590 and 1640 , Buy HDFCBANK above 1640 or Sell HDFCBANK below 1590 , both on daily closing basis . Same with stoploss , if buying then SL 1630 on daily closing basis , if selling then SL 1600 on daily closing basis . Currently wait for breakout or breakdown

HDFC BANKHDFC BANK
Gaps are areas on a chart where the price of a stock (or another financial instrument) moves sharply up or down, with little or no trading in between. As a result, the asset's chart shows a gap in the normal price pattern. The enterprising trader can interpret and exploit these gaps for profit.

HDFC BANK Important Trendline Breached & Gap has been filled today, Volume wise I can see strength,
Important day for tomorrow. I Will wait for the follow-up candle Then then take action...
Volume & OI is important as always...

HDFC BANKWait And Watch ??
Look for Low risk, High reward, and High Probability setups-
Things to Remember while Trading with the Trend
1. Know what the trend is.
2. The best trades are made in the direction of the trend.
3. Assume that the main trendline or moving average will hold.
4. The longer the moving average is, the better it defines the trend.
5. Wait for the pullback.
6. Don’t chase the market.
7. Don’t fight the market.
8. Even in the strongest trends there should be some retracement.
9. The closer the market is to the trendline, the better the risk/reward ratio is.
10. Use ADX to determine the strength of the trend.
11. Higher the level of ADX , the stronger the trend, below 20 consider the market to be choppy
12. Hold trades longer in a strong trend.
13. Wait for confirmation of a trendline breaking before reversing position.
14. Know where the Support levels are.
15. Place stops outside the Support levels.
Thank You..
