HDFCBANK - Extended Retracement Phase
📊 HDFC Bank – Daily Chart Update | Extended Retracement Phase
Timeframe: 1D
Trend Context: Medium-term correction within a broader structure
Current Price: ~₹925
🔍 What Changed from Previous Analysis? (Important Update)
Earlier, we discussed an ABC correction nearing completion around the ₹960–965 zone.
📉 Price failed to hold that zone, leading to a deeper, extended retracement.
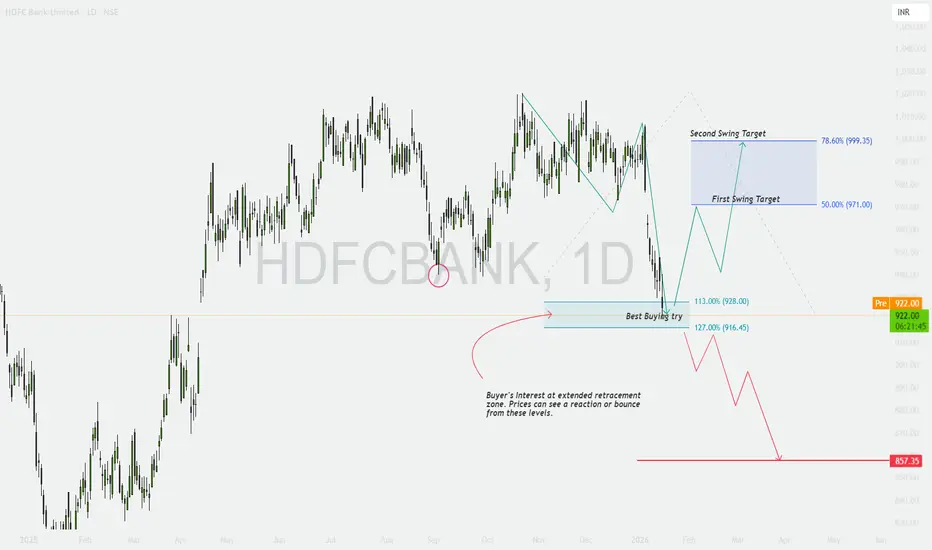
Now the structure has evolved into an extended Fibonacci retracement, where buyers may re-emerge, but with higher risk.
📐 Fibonacci-Based Structure (Educational)
From the prior swing low → swing high:
113% Retracement: ~₹928
127% Retracement: ~₹916
➡️ This ₹916–928 zone is now marked as a “Best Buying Try” area, not blind buying.
📘 Extended retracements often invite short-covering + value buying, but confirmation is mandatory.
📌 Key Levels to Watch (Updated)
🟢 Support / Demand Zones
Primary Demand: ₹916–928
Major Breakdown Level: ₹857
🔴 Resistance / Recovery Zones
First Swing Target: ₹971 (50% retracement)
Second Swing Target: ₹999 (78.6% retracement)
Major Supply: ₹1,018–1,020
🟢 Bullish Scenario (Conditional Recovery)
If price:
Holds ₹916–928
Forms a base / reversal structure (daily close improvement, higher low)
Then:
First bounce toward ₹960–971
Sustained strength can extend toward ₹995–1,000
📈 This would be a relief rally, not trend reversal yet.
🔴 Bearish Scenario (Risk Case)
If price:
Breaks below ₹916 with daily close
Then:
Extended correction likely
Downside opens toward ₹880 → ₹857
📉 Below ₹916, buyers lose positional control.
🎓 Educational Insights
Extended retracements = high reward but high patience trades
Buying zones ≠ buying signals
Daily timeframe requires confirmation, not anticipation
Strong trends correct deeper before resuming
🧠 Options Trading View (Educational Only)
🟢 Near ₹916–928 (Only After Confirmation)
Bull Call Spread (ATM + OTM)
Put Credit Spread for range-bound recovery
🔴 If ₹916 Breaks
Bear Put Spread
Call Credit Spread near ₹960–980
⚠️ Avoid naked option selling in falling markets.
✅ DOs
✔ Wait for daily confirmation
✔ Trade zones, not emotions
✔ Use defined risk strategies
✔ Reduce position size during deep corrections
❌ DON’Ts
❌ Don’t average blindly
❌ Don’t assume every dip is the bottom
❌ Don’t ignore Fibonacci extensions
❌ Don’t overtrade volatility
🧾 Conclusion
HDFC Bank is now in an extended corrective phase.
The ₹916–928 zone is a potential demand area, but only confirmation will decide whether this becomes a base or a breakdown.
📌 Patience here is more profitable than prediction.
⚠️ Disclaimer
This analysis is for educational purposes only. I am not a SEBI registered analyst. Markets are risky, and I may be wrong. Please consult your financial advisor before trading.
Hdfcbanklong
HDFCBANK — 1H Technical Analysis
Timeframe: 1 Hour
Structure: Intermediate ABC correction within a broader uptrend
Current Price Zone: ~₹963
Trend Context: Higher-timeframe trend remains positive, short-term corrective phase in progress
🔍 Market Structure & Price Action (Educational View)
Price is currently forming an Intermediate corrective ABC structure after facing rejection near the ₹1,018–1,020 resistance band.
Wave (a): Sharp impulsive decline from the top
Wave (b): Retracement toward resistance, failed to make a new high
Wave (c): Ongoing decline, approaching a high-probability demand zone
This is a classic corrective pause, not a trend reversal unless key supports fail.
📌 Key Levels to Track
Major Resistance: ₹1,018–1,020
Reclaim Level (Trend Continuation): ₹975–980
ABC Completion / Demand Zone: ₹961–965
Critical Invalidation Level: ₹957
Breakdown Support (Risk Zone): ₹916
💡 Corrections often end where institutions previously accumulated — zones matter more than candles.
🟢 Bullish Scenario (Primary Plan)
If price holds above ₹961–965 and shows stabilization:
Confirmation signals to watch:
Bullish engulfing / strong rejection wick
Higher low on 15m–1h
Volume expansion on green candles
Upside Roadmap:
₹975 → ₹990 → ₹1,010
Sustained move above ₹980 opens doors for fresh highs over time
📘 This would confirm ABC completion and resumption of the larger uptrend.
🔴 Bearish Scenario (Risk Case)
If price breaks and sustains below ₹957:
ABC structure fails
Selling pressure may accelerate
Downside opens toward ₹930 → ₹916
📉 Below ₹957, probabilities shift from “buy-the-dip” to “protect capital”.
🎓 Educational Takeaways
Corrections are healthy pauses, not immediate sell signals
Always trade levels + confirmation, not hope
Bigger trend remains intact above ₹957
Sideways + choppy price = option sellers’ playground
🧠 Options Trading Strategies (Educational Only)
🟢 Bullish (Support Holds)
Strategy 1: Bull Call Spread
Buy ATM Call
Sell OTM Call (₹980/₹1000 zone)
Defined risk, lower theta decay
Strategy 2: Cash-secured Put (Aggressive)
Sell ₹960 PE only if price stabilizes
Suitable for experienced traders
🔴 Bearish (Support Breaks)
Strategy 1: Bear Put Spread
Buy ₹960 PE
Sell ₹920 PE
Risk-defined downside play
Strategy 2: Call Credit Spread
Sell ₹980 CE
Buy ₹1020 CE
Works best in breakdown + consolidation
⚠️ Avoid naked options near support zones.
✅ DOs
✔ Trade near key levels, not in the middle
✔ Use defined SL (₹957)
✔ Reduce position size during corrections
✔ Wait for price confirmation
❌ DON’Ts
❌ Don’t panic sell near demand zones
❌ Don’t over-leverage options during volatility
❌ Don’t assume every dip is a buying opportunity
❌ Don’t ignore higher-timeframe trend context
🧾 Summary & Conclusion
HDFC Bank is undergoing a controlled intermediate correction within a broader bullish structure.
The ₹961–965 zone is crucial — holding above this keeps the bullish roadmap intact, while a breakdown below ₹957 increases downside risk.
📌 Patience + confirmation = edge.
⚠️ Disclaimer
This analysis is for educational purposes only. I am not a SEBI registered analyst. Markets are risky, and I may be wrong. Please consult your financial advisor before taking any trade.

Trading Master Class With ExpertsDirectional Strategies
These are for traders with a clear market view.
Long Call (Bullish)
When to Use: Expecting significant upward movement.
Setup: Buy a call option.
Risk: Limited to premium paid.
Reward: Unlimited.
Example: NIFTY at 20,000, you buy 20,100 CE for ₹100 premium. If NIFTY closes at 20,500, your profit = ₹400 - ₹100 = ₹300.
Long Put (Bearish)
When to Use: Expecting price drop.
Setup: Buy a put option.
Risk: Limited to premium.
Reward: Large if the asset falls.
Example: Stock at ₹500, buy 480 PE for ₹10. If stock drops to ₹450, profit = ₹30 - ₹10 = ₹20.
Covered Call (Mildly Bullish)
When to Use: Own the stock but expect limited upside.
Setup: Hold stock + Sell call option.
Risk: Stock downside risk.
Reward: Premium income + stock gains until strike price.
Example: Own Reliance at ₹2,500, sell 2,600 CE for ₹20 premium.

Intraday vs Swing1. Introduction
In the world of trading, there are various styles and timeframes that traders use to profit from market movements. Two of the most popular methods are Intraday Trading and Swing Trading. Each has its unique characteristics, advantages, disadvantages, and psychological demands. Understanding the difference between these two styles is essential for new and experienced traders alike.
2. What is Intraday Trading?
Intraday Trading, also known as Day Trading, involves buying and selling financial instruments within the same trading day. Traders do not carry positions overnight. The goal is to capitalize on small price movements during the trading session.
Key Characteristics:
Positions are opened and closed on the same day.
High frequency of trades.
Focus on liquidity and volatility.
Typically uses 1-minute to 15-minute charts.
Heavy reliance on technical analysis.
3. What is Swing Trading?
Swing Trading is a medium-term trading strategy where traders hold positions for several days to weeks. The aim is to capture “swings” or trends in the market.
Key Characteristics:
Trades last from a few days to several weeks.
Lower frequency of trades.
Emphasizes trend and pattern analysis.
Uses 4-hour to daily or weekly charts.
Combination of technical and fundamental analysis.
4. Tools and Indicators Used
Intraday Trading Tools:
Timeframes: 1-min, 5-min, 15-min, 30-min.
Indicators:
Moving Averages (9, 20, 50 EMA)
VWAP (Volume Weighted Average Price)
RSI, MACD, Stochastic Oscillator
Bollinger Bands
Pivot Points
Scanners: For volume spikes, breakouts.
Level 2 Data, Order Flow, Volume Profile
Swing Trading Tools:
Timeframes: 4-hour, Daily, Weekly
Indicators:
Moving Averages (50, 100, 200 SMA)
RSI, MACD
Fibonacci Retracement
Trendlines and Channels
Candlestick Patterns
News & Fundamentals: Earnings, macro data, interest rates, etc.
5. Strategy Types
Intraday Trading Strategies:
Scalping: Dozens of trades for small profits.
Momentum Trading: Riding strong intraday moves.
Breakout Trading: Entering when price breaks key levels.
Reversal Trading: Betting on pullbacks or trend reversals.
VWAP Strategy: Buying near VWAP on bullish days.
Swing Trading Strategies:
Trend Following: Entering in the direction of the main trend.
Pullback Trading: Buying dips in an uptrend.
Breakout Swing: Holding after breakout of key levels.
Range Trading: Buying at support, selling at resistance.
Fibonacci or EMA Bounce: Waiting for retracements.
6. Time Commitment
Intraday Trading:
Requires full-time focus.
Traders monitor markets from open to close.
Not suitable for people with day jobs or time constraints.
Swing Trading:
Requires less screen time.
Can be done part-time.
Suitable for people with other commitments.
7. Risk and Reward
Intraday Trading:
High potential reward but also high risk.
Requires tight stop-loss.
Leverage often used, magnifying gains/losses.
Small profits per trade, but frequent trades.
Swing Trading:
Lower stress, less noise.
Wider stop-loss but higher per-trade reward.
Leverage optional.
Focus on bigger market moves.
8. Capital Requirements
Intraday Trading:
In India, brokers often require minimum margin for intraday trades.
High leverage is common, increasing capital efficiency.
But strict SEBI regulations limit retail leverage.
Swing Trading:
Requires full margin or delivery-based capital.
No leverage or overnight positions allowed for small traders without risk.
9. Psychological Factors
Intraday Trading:
Emotionally intense.
Traders need to make split-second decisions.
Stressful due to fast movements and high stakes.
Risk of overtrading, revenge trading, and burnout.
Swing Trading:
Less stress, more time to think and plan.
Can handle drawdowns and fluctuations better.
Still requires discipline and emotional control.
10. Pros and Cons
Intraday Trading:
Pros:
No overnight risk (gap-up or gap-down).
Daily income potential.
Rapid compounding for skilled traders.
More trading opportunities.
Cons:
Requires constant attention.
High emotional and mental pressure.
Brokerage, slippage, and taxes eat into profit.
Difficult for beginners.
Swing Trading:
Pros:
Less time-consuming.
Allows thorough analysis.
Potential for higher risk-reward trades.
Suitable for people with jobs or businesses.
Cons:
Overnight risk.
Slower capital turnover.
Requires patience.
May miss out on short-term opportunities.
Conclusion
The choice between Intraday Trading and Swing Trading depends on your:
Time availability
Risk appetite
Capital
Psychological strength
Market experience
Neither is "better"—each has its pros and cons. The best traders understand their own personality and choose (or combine) styles that fit their strengths.
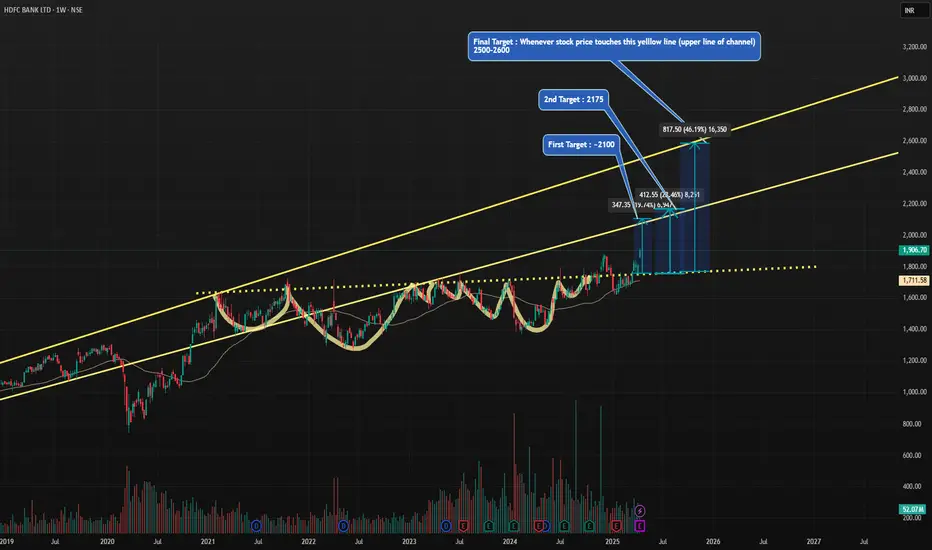
HDFC BANK : 45-50% upside possible in 1.5 Years. BODHi friends,
Targets are mentioned in the self explanatory chart .
HDFC Bank is the largest private sector bank having all time high profitability & sells .
It has well controlled gross and net NPA compared to its peers .
There is a very good probability for the stock to reward its investors with ~50% return .
Its a BOD (BUY ON DIPS) as per my analysis .
Please feel free to comment or share your views on my analysis .
Note : I am not SEBI registered advisor . Please consider my analysis for education purpose only .
HDFC BANK LIMITED set to move upHDFC bank limited is having support at multiple timeframe and consolidating for some time.
looks good to buy cmp with sl below 1600.

HDFC Bank Cup & handle Breakout RetestHdfc bank retesting from its breakout of cup and handle chart pattern and also taking ema 200 as support and rsi oversold with trading upward channel hdfc bank is good for swing as per this set up

HDFC Bank cmp 1766.30 by Weekly Chart viewHDFC Bank cmp 1766.30 by Weekly Chart view
- Weekly Support at 1705 > 1622 > 1550 with the Resistance only at ATH 1794
- Stock seems trying to sustain above trading price range 1270 to 1735 since September 2024 by breakout attempts
- Stock attempted New ATH 1788 on 26-Sept-2024 yet again failed to sustain and broke down within trading range
- Stock attempted the New ATH 1794 in the 1st week of July 2024 but again failed to sustain and price broke down
- Stock attempted to cross ATH 1757.50 in the 1st week of July 2023 and failed to sustain, came back in price range
- Stock was trading within the price range 1270 to 1735 mostly since November 2020 with some breakout attempts seen

HDFC Bank Swing Long Setup- HDFC is currently trading at 1636
- HDFC is setting up and trying to build a base on a 4h TF
- HDFC is setting up a fair range for buyers and sellers according to this base that's what it signifies
- HDFC can take out Sell Side Liquidity before moving up to trap breakout buyers and fomo longs
- Manage risk total risk on this setup is 2% so just manage risk and look to shave 3-4% minimum

HDFC Monthly | LONG TERM INVESTMENTHi Traders,
This is HDFC Monthly Chart.
This is Best Time to Invest for Long Term
with Small SL.
Note - This is only for education Purpose.

HDFC Bank retesting the break out zone, looks bullish.
The stock looks bullish as per the price action. There was a consolidation and a break out after a gap up opening creating a gap.
It has retest the break out zone and the gap is filled.
HDFC Bank has taken a good support from 1480-90 zone as there is a confluence of 200 ema, retest and fib retracement levels.
Entry :- Above 1528
Possible Targets :- 1556, 1588
Swing/positional targets in the stock are even more. As the entry in the stock will be created the targets will be revised with trailing the SL/.
Wait for the price action on the bullish side for the entry.

HDFCBANK Update Here, is the chart or projection of HDFC BANK for the future as usual as a part of update on our earlier projection....
I hope this will definitely help you a lot so we just expect your love by boosting our ideas to strengthen and energize to post such a valuable content for you guyz ..
use this as educational purpose...

HDFC LIFE !Trend is neutral
Net Sales of 46,513cr has grown at 56.23%
Pat has grown at 20.84%
PE is too hot and high at 93.43%
mutual fund stake has increased from 4% to 4.66%past quarter
stock is a good buy at 520-560
Wait for the dip

21st Dec ’23 - BankNifty leads from the front, stance is NEUTRALBankNifty Analysis
I initially thought the wolf in the sheep’s costume was NiftyIT today spoiling the fun of the Bears. The real culprit was BankNifty - the way it defended its turf today was more than amazing. Even though we had a lower opening, HDFCBANK was staying strong at one end. You know pretty well that HDFCBK alone can drive up/down the index as its weight on the index is manipulatively sizeable.
4mts chart link - click here
Just like a Tug-of-War, HDFCBK was at the rear end acting as the anchor. It bolted itself to the ground and ensured BN was not slipping. Somehow it worked. The first thing BN did was to retest the lower end of the ascending channel i.e. between 10.07 to 10.55. Once it broke out - it retested the same line from a support perspective i.e. b/w 13.55 to 14.11. The 2nd test was rejected which gave it massive momentum to break free (upside). The next stop was right at the top end of the channel i.e. b/w 14.47 to 15.19. You might have to see the encircled portion in the chart to know what I am referring to.
63mts chart link - click here
Can you believe - All the candles today were GREEN. We started at the lower end of the channel and ended at the top boundary stopped only by the bell. Today’s price action almost nullified yesterday’s move and seeing the way BN fought back, I wish to change my stance to neutral for tomorrow. Will go bearish once 47400 gives away and will go bullish if the ATM is taken out. The options premium did not have any excesses today indicating that a big move may not be expected - will update you via TV minds if I see something interesting tomorrow.

HDFCBANK should complete it's time correctionNSE:HDFCBANK is looking good from financial perspective but technically it's in a range for the last 3 years. Hope it breaks this range soon on the upper side.

HDFCBANK at the verge of a short term break outIn the 3 hour Time Frame HDFCbank is about to give a short term break out, Target 1586
CMP 1548

HDFC Bank - Final supportHello Investors,
All these two years HDFC bank share had tough time for investors. Now I did a monthly time frame analysis with the trend line and horizontal price engagement area meeting the trend line.
Hope this could be the final swing to come low for HDFC bank.
What are the support levels ?
1505, 1500, 1498, 1480
From any of these price point it will bounce and will have a pleasant rally, why ? FII buying in HDFC Bank has increased from the june quarter and the DII as well showing interest.
Thanks

HDFC Bank: A Good Stock for the Long TermHDFC Bank is the largest private sector bank in India and is expected to report strong earnings tomorrow. The stock is currently trading at a premium to its fair value, but it is still a good stock to own for the long term.
Here are some of the reasons why HDFC Bank is a good stock to own for the long term:
Strong financials: HDFC Bank has strong financials with a high capital adequacy ratio and low non-performing assets.
Good growth prospects: HDFC Bank is well-positioned to benefit from the growth of the Indian economy.
Dividend yield: HDFC Bank has a good dividend yield, which provides investors with a steady income stream.
Here are some of the risks to consider before investing in HDFC Bank:
High valuation: HDFC Bank is currently trading at a premium to its fair value.
Regulatory risks: The Indian banking sector is facing some regulatory risks, which could impact HDFC Bank's performance.
Interest rate risks: HDFC Bank is exposed to interest rate risks, which could impact its profitability.
Overall, HDFC Bank is a good stock for the long term. However, investors should be aware of the risks before investing in the stock.
Trading Strategy
The following is a trading strategy for HDFC Bank:
Entry: Buy the stock at 1640.25.
Stoploss: Sell the stock if it falls below 1610.40.
Target 1: Sell the stock if it reaches 1670.10.
Target 2: Sell the stock if it reaches 1703.
This is just a suggestion and you should always do your own research before making any trading decisions.

HDFCBANK 1780 Targets coming in next 5-8 daysHDFCBANK 1780 Targets coming in next 5-8 days.
HDFC Hourly Chart shows Bullish pattern with 4% upside in next 5/8 days time frame.
Expecting Gap up opening on Wednesday 26th July & uptrend to continue.
LTP - 1696
SL - 1675
Targets - 1780
Timeframe - 5-8 Days.
Happy Investing.

HDFCBANK Hourly chart CUP-Handle Pattern Formation - 10% upsideHDFCBANK Hourly chart CUP-Handle Pattern Formation - 10% upside possible in next 15 trading sessions.
LTP - 1675
SL - 1640
Targets - 1840+
Timeframe - 15-20 Trading session
Risk Reward Ratio - 1:5
Happy Investing.

HDFCBANK Hourly Chart shows Target of 1900 in 2/3 MonthsHDFCBANK Hourly Chart shows Target of 1900 in 2/3 Months
LTP - 1678
SL - 1620
Targets - 1740 / 1810 / 1900
Timeframe - 2/3 Months

HDFCBank Weekly Chart Suggest 20% upmove in next 6-8 MonthsHDFCBank Weekly Chart Suggest 20% upmove in next 6-8 Months.
CUP Pattern Breakout in progress on Weekly charts.
LTP - 1640
SL - 1540
Targets - 2000+
Timeframe - 6/8 Months
Every Dips can be used to accumulate the stock for Medium Term investment.

HDFC BANK Long entry- PositionalHDFC BANK has taken support at 1600
Levels marked Trend line BO.
Use at your own discretion. Analysis is only for educational purpose
