HDFCLIFE - BUY - Technical AnalysisHDFC Life Insurance - 4-Year Breakout Setup
HDFCLIFE (NSE) Current Price: 787.55
Date: November 27, 2025
Key Highlight: 4-YEAR BREAKOUT CONFIRMED
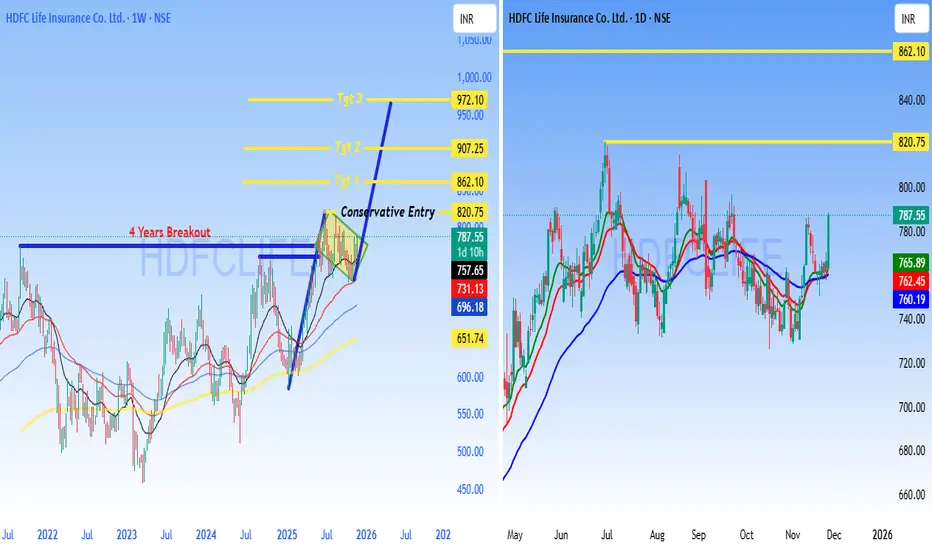
HDFC Life has broken out from a **4-year consolidation zone** around 787, signaling a major technical development with significant upside potential.
Technical Setup
4-Year Resistance Breakout - Stock cleared multi-year hurdle
Strong Volume Confirmation - Breakout supported by buying interest
Higher Highs Pattern - Bullish structure on daily chart
Moving Averages Aligned - Trending above key EMAs
Price Targets
Target 1: 862.10
Target 2: 907.25
Target 3: 972.10
Conservative Entry: 820.75 (post-retest confirmation)
Trading Plan
Entry Zone: 787-820
Stop Loss: Below 757 (breakout invalidation)
Risk:Reward: 1:3+ favorable setup
Strategy: Long-term breakout traders can accumulate; conservative traders wait for pullback to ₹820 zone.
- 4-year resistance breakouts often lead to sustained rallies
- Insurance sector showing strength
- Strong institutional interest in HDFC Life
- Technical + fundamental alignment
Risk Management
- Use stop loss below 757
- Position size: Risk only 1-2% capital
- Trail stop loss as targets are achieved
- Monitor broader market conditions
DISCLAIMER
**NOT investment advice. For educational purposes only.** I am NOT a SEBI registered analyst. This is technical analysis based on chart patterns. Trading involves substantial risk. Do your own research (DYOR). Consult a financial advisor before investing. Trade at your own risk.
**#HDFCLIFE #Breakout #StockMarket #NSE #TechnicalAnalysis #Insurance #Trading #IndianStocks #ChartAnalysis #SwingTrading #BreakoutTrading #TradingView #StockAlert #BullishSetup #PriceAction**
HDFCLIFE
Cup & Handle Breakout in HDFCLIFEThe chart idea posted shows a classic Cup & Handle breakout in HDFC Life Insurance Co. Ltd.
, signaling a bullish opportunity. The cup features a rounded bottom, followed by a handle—the short consolidation before price surges above resistance. This breakout is confirmed by strong buying volume and an 18% move in the option price, indicating momentum. Traders commonly enter above the handle’s high, set stop-loss below the handle, and target gains equivalent to the cup’s depth projected upward. The Cup & Handle pattern is reliable and widely used for trend continuation trades
H

HDFCLifeHDFCLife has a very long consolidation and going up and down in the range.
Previous wave has a downfall and not it is started with uptrend. So some uptrend it has small correction and ready to move up side.
So, above 770 we can see upside movement till the 800-820.
So, as per technical it's good to accumulate for the long time and wait for the target.
Above 850 we can see a big rally and better return for the next few years.

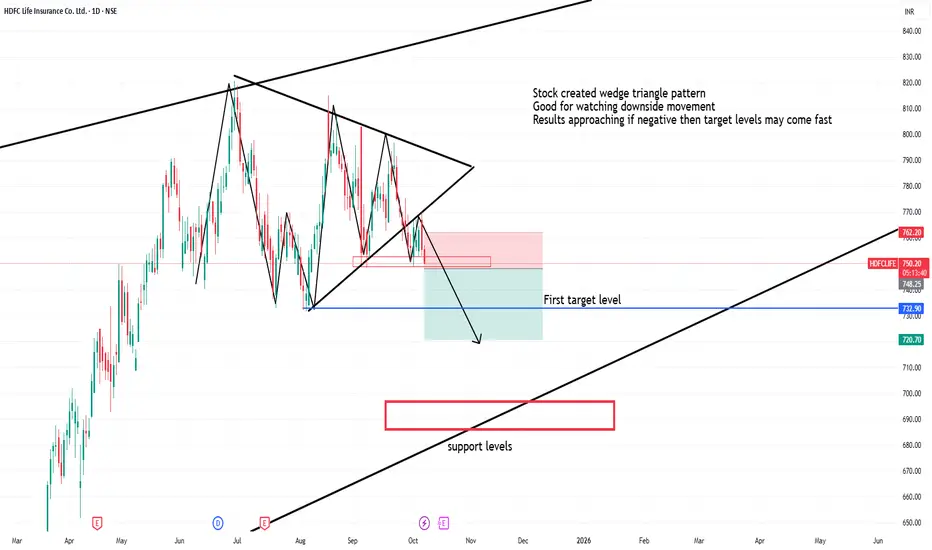
Hdfclife created bearish wedge triangle patternStock created wedge triangle pattern
Good for watching downside movement
Results approaching if negative then target levels may come fast
GIFT Nifty & Global Market LinkageIntroduction
The Indian stock market has undergone a remarkable transformation in the past two decades. From being a largely domestic-focused equity market, India has steadily moved into the global financial arena. A very important step in this journey was the creation of GIFT City (Gujarat International Finance Tec-City) and the launch of GIFT Nifty, which has become India’s bridge to global markets.
GIFT Nifty is not just a derivative product; it is a symbolic step that integrates India’s financial markets more closely with global capital flows. At the same time, it creates a transparent and efficient platform for international investors to participate in India’s growth story.
But to fully understand its importance, one needs to see how GIFT Nifty is linked to global markets. Markets today are interconnected like never before—movements in Wall Street, European bourses, or Asian markets ripple across Indian indices. GIFT Nifty acts as a mirror and predictor of India’s domestic market sentiment while being shaped by international factors such as U.S. Fed policy, global interest rates, oil prices, and geopolitical risks.
This detailed explanation will cover:
What is GIFT Nifty?
The journey from SGX Nifty to GIFT Nifty.
The significance of GIFT City as India’s international financial hub.
GIFT Nifty’s role in India’s global financial integration.
Global market linkages – how global events influence GIFT Nifty.
Correlations with U.S., Europe, and Asia-Pacific markets.
Opportunities and challenges ahead.
The future of GIFT Nifty in shaping India’s financial markets.
1. What is GIFT Nifty?
GIFT Nifty is a derivative contract (futures and options) based on the Nifty 50 index, but traded on the NSE International Exchange (NSE IX) located in GIFT City, Gujarat.
It allows foreign investors to participate in India’s benchmark index without going through complex registration processes like FPI (Foreign Portfolio Investor) rules in the domestic market.
The contracts are USD-denominated, meaning global traders can easily buy and sell without worrying about INR conversion.
GIFT Nifty runs for almost 21 hours a day, covering Asian, European, and U.S. trading hours—making it one of the most globally accessible contracts linked to India.
In short, GIFT Nifty provides a real-time pulse of how global investors view India, almost around the clock.
2. From SGX Nifty to GIFT Nifty
Earlier, India’s Nifty futures were traded heavily on the Singapore Exchange (SGX), called SGX Nifty.
For nearly two decades, SGX Nifty was the main offshore gateway for international investors to take exposure to Indian equities.
Traders around the world would look at SGX Nifty quotes to predict the opening direction of the Indian stock market.
In fact, SGX Nifty became so popular that even Indian retail traders tracked it overnight to guess how the domestic Nifty would open.
However, in 2018, NSE and SGX had a legal tussle over licensing rights. Finally, in 2022, both parties agreed to shift all SGX Nifty contracts to GIFT City under a “Connect” model.
Now, SGX Nifty is history, and GIFT Nifty is the only official offshore Nifty derivative product. This transition brought trading volumes back under Indian jurisdiction, strengthening India’s position as a global financial hub.
3. GIFT City: India’s International Financial Hub
GIFT City is a special economic zone (SEZ) located in Gandhinagar, Gujarat. Its vision is to create a global financial and IT services hub on par with Singapore, Dubai, and London.
GIFT City offers tax incentives, world-class infrastructure, and a favorable regulatory environment.
The NSE International Exchange (NSE IX) operates here, hosting products like GIFT Nifty.
Banks, insurers, brokers, and global funds are setting up units in GIFT City to tap both Indian and global opportunities.
For India, GIFT City represents a strategic move: instead of foreign investors trading Indian products overseas, they now trade in India itself. This not only boosts financial flows but also gives regulators more oversight.
4. GIFT Nifty’s Role in Global Financial Integration
GIFT Nifty is more than just a futures contract—it symbolizes India’s growing integration with global markets.
Here’s how:
International Accessibility: Investors in New York, London, Hong Kong, or Dubai can trade GIFT Nifty almost anytime, making India’s equity market more globally visible.
Price Discovery: Since trading happens across time zones, GIFT Nifty reflects both global and domestic investor sentiment in near real time.
Hedging Tool: Foreign portfolio investors (FPIs) can hedge their India equity exposure more efficiently.
Liquidity & Volumes: Global participation in GIFT Nifty brings higher liquidity, tighter spreads, and deeper markets.
5. Global Market Linkages – How World Events Affect GIFT Nifty
The beauty (and complexity) of GIFT Nifty lies in its sensitivity to global developments. Because it trades almost continuously, it reacts instantly to global news.
Some of the most important global factors influencing GIFT Nifty are:
U.S. Federal Reserve Policy
Interest rate hikes or cuts in the U.S. directly impact global equity flows.
A hawkish Fed (raising rates) usually hurts risk assets like Indian equities.
GIFT Nifty futures often fall sharply after Fed announcements.
Global Economic Data
U.S. inflation, jobs data, GDP growth, and corporate earnings set the tone for global risk appetite.
Similarly, China’s growth numbers and Europe’s economic indicators affect global sentiment.
Oil Prices
India imports more than 80% of its crude oil needs. A rise in global oil prices usually weakens Indian equities.
GIFT Nifty reacts immediately to Brent crude movements.
Currency Fluctuations
A strong U.S. dollar and weak rupee reduce foreign investor returns.
GIFT Nifty often mirrors INR-USD volatility.
Geopolitical Risks
Wars, conflicts, sanctions, or supply-chain disruptions cause risk-off sentiment globally.
GIFT Nifty, like other emerging market indices, tends to fall under such conditions.
Global Equity Trends
If Wall Street has a strong rally, GIFT Nifty usually trades higher in the U.S. session.
If Asian markets crash early morning, GIFT Nifty shows weakness in the Asian session.
6. Correlation with Global Markets
Let us break down the interconnectedness between GIFT Nifty and major global markets.
a. Link with U.S. Markets (Wall Street)
The U.S. markets (Dow Jones, S&P 500, Nasdaq) are the most influential for GIFT Nifty.
After U.S. closing, GIFT Nifty in the U.S. time zone reacts sharply to tech earnings, Fed speeches, or macro data.
Example: If Nasdaq falls 2% overnight, GIFT Nifty usually opens lower in the Asian session.
b. Link with European Markets
During European hours, GIFT Nifty trades alongside FTSE (UK), DAX (Germany), and CAC (France).
Eurozone recession fears or ECB rate moves affect GIFT Nifty sentiment.
c. Link with Asian Markets
In the morning, GIFT Nifty trades in sync with Nikkei (Japan), Hang Seng (Hong Kong), and Shanghai Composite (China).
A sell-off in China often triggers weakness in GIFT Nifty.
Conversely, optimism in Asian markets boosts Indian sentiment.
7. Opportunities Created by GIFT Nifty
Better Price Discovery for India’s Market
Instead of relying on SGX Nifty, Indian markets now have their own offshore derivative hub.
Boost to GIFT City Ecosystem
Trading volumes, jobs, and financial services activity in GIFT City have surged.
Global Participation in India’s Growth
India is one of the fastest-growing economies. GIFT Nifty allows global funds to participate directly.
Hedging Benefits for FPIs
Foreign investors can protect themselves against Indian market volatility.
Strengthening Rupee’s Global Role
Even though contracts are in USD, India gains visibility as a financial center.
8. Challenges Ahead
Despite its success, GIFT Nifty faces challenges:
Liquidity Migration: Ensuring that volumes remain strong compared to global exchanges.
Awareness: Many global traders still see SGX Nifty as their reference, though it no longer exists.
Competition: Other financial hubs like Singapore and Dubai remain strong competitors.
Volatility Risk: High global interconnectedness means sudden shocks (like COVID-19 or geopolitical events) affect GIFT Nifty instantly.
9. The Future of GIFT Nifty
Looking forward, GIFT Nifty is set to become a cornerstone of India’s financial globalization.
Volumes are rising every month as more global institutions migrate to GIFT City.
New products (like GIFT Bank Nifty, sectoral derivatives, ETFs) may be introduced.
India’s inclusion in global bond and equity indices will further increase offshore demand.
Over the next decade, GIFT City could evolve into a mini-Singapore for Asia.
Conclusion
GIFT Nifty is more than just a trading contract—it is a symbol of India’s financial maturity. By shifting from SGX to GIFT City, India ensured that its financial products are traded on its own soil, strengthening sovereignty and transparency.
At the same time, GIFT Nifty remains deeply connected with global markets. Whether it’s the U.S. Fed, crude oil prices, China’s slowdown, or geopolitical tensions, GIFT Nifty reflects the pulse of global investor sentiment toward India in real time.
In a world where capital moves at the speed of light, GIFT Nifty serves as India’s window to the world and the world’s window to India. Its success will not only strengthen India’s equity markets but also position GIFT City as a major international financial hub in the decades to come.

Futures & Derivatives TradingIntroduction
The financial world is full of instruments designed to manage risk, improve returns, or speculate on price movements. Among these, derivatives stand out as some of the most powerful yet complex tools. They have been both praised for providing risk management solutions and criticized for their misuse in speculative bubbles.
At the heart of derivative trading lies futures contracts, which are widely used in stock markets, commodities, currencies, and even cryptocurrencies today. For beginners, the idea of betting on future prices might seem abstract, but in practice, derivatives are an essential pillar of modern finance.
In this guide, we’ll break down what derivatives are, how futures work, their role in trading, strategies, advantages, risks, and real-world examples. By the end, you’ll have a strong grasp of this exciting domain.
1. What Are Derivatives?
A derivative is a financial contract whose value is derived from the price of an underlying asset.
Underlying assets can be stocks, bonds, commodities (gold, oil, wheat), currencies, indices (Nifty 50, S&P 500), or even interest rates.
The derivative itself has no intrinsic value—its worth comes purely from the asset it tracks.
Key Types of Derivatives:
Futures – Standardized contracts to buy/sell an asset at a predetermined future date and price.
Options – Contracts that give the buyer the right, but not the obligation, to buy/sell at a specific price within a certain period.
Forwards – Similar to futures but customized and traded over-the-counter (OTC).
Swaps – Agreements to exchange cash flows (e.g., fixed vs. floating interest rates).
Futures are the most actively traded derivatives worldwide, making them the cornerstone of modern derivative trading.
2. Understanding Futures Contracts
A futures contract is an agreement between two parties to buy or sell an asset at a future date for a price decided today.
Features of Futures:
Standardized: Contracts are uniform in terms of size, expiration date, and rules (unlike forwards).
Exchange-traded: Futures trade on regulated exchanges (like NSE in India, CME in the US).
Margin & Leverage: Traders don’t pay the full contract value upfront. Instead, they deposit a small margin, which allows them to control large positions with less capital.
Settlement: Contracts may be settled physically (actual delivery of the asset) or in cash (profit/loss paid without delivery).
Example:
Suppose you buy a Nifty 50 Futures contract at 22,000. If at expiry, Nifty is at 22,500:
You gain = 500 × lot size (say 50) = ₹25,000.
If Nifty falls to 21,800:
You lose = 200 × 50 = ₹10,000.
This leverage magnifies both profits and losses.
3. Why Futures & Derivatives Exist
Derivatives serve three main purposes:
Hedging (Risk Management)
Farmers use commodity futures to lock in crop prices.
Importers hedge currency risk using forex futures.
Stock investors hedge downside risk with index futures.
Speculation
Traders bet on the price direction of oil, stocks, or indices without owning them.
Speculators provide liquidity to the market.
Arbitrage
Traders exploit price differences between spot and futures markets for risk-free profit.
Without derivatives, markets would be less liquid, riskier, and less efficient.
4. Futures Market Structure
Futures trading involves multiple participants:
Hedgers – Reduce risk (e.g., a farmer locking wheat prices).
Speculators – Take risk to profit from price changes.
Arbitrageurs – Exploit mispricing between markets.
Exchanges – NSE, CME, ICE, etc., which standardize and regulate contracts.
Clearing Houses – Guarantee contract performance and manage counterparty risk.
This structure ensures trust, transparency, and liquidity.
5. Key Terminologies in Futures & Derivatives
Spot Price – Current market price of the underlying asset.
Futures Price – Price agreed for future delivery.
Margin – Initial deposit (usually 5-15% of contract value) to trade futures.
Mark-to-Market (MTM) – Daily settlement of profits/losses.
Lot Size – Minimum quantity per contract (e.g., Nifty Futures = 50 units).
Expiry Date – Last date on which the contract is valid.
Open Interest – Total outstanding contracts in the market.
6. Trading Futures: Step-by-Step
Let’s walk through how a futures trade happens:
Decide Asset: Choose whether to trade index, stock, commodity, or currency futures.
Select Contract: Pick expiry month (near-month, mid-month, far-month).
Check Margin: Ensure sufficient capital for margin requirements.
Place Order: Buy (long) if expecting rise, Sell (short) if expecting fall.
MTM Adjustments: Profits/losses credited daily to trading account.
Exit or Hold: Close position before expiry or hold till expiry for settlement.
This cycle repeats every expiry, creating continuous opportunities for traders.
7. Strategies in Futures Trading
(A) Hedging Strategies
Long Hedge: A company buying raw material futures to guard against price rise.
Short Hedge: A farmer selling wheat futures to protect against price fall.
(B) Speculative Strategies
Long Futures: Buy futures anticipating price increase.
Short Futures: Sell futures anticipating price decline.
(C) Spread Trading
Calendar Spread: Buy near-month futures, sell far-month futures.
Inter-Commodity Spread: Trade two related commodities (e.g., crude oil vs. heating oil).
(D) Arbitrage Strategies
Cash & Carry Arbitrage: Buy asset in spot, sell futures if futures are overpriced.
Reverse Arbitrage: Sell asset in spot, buy futures if futures are underpriced.
8. Futures in Different Markets
(i) Stock Index Futures
Most popular in India (Nifty, Bank Nifty).
Allow trading market direction without stock picking.
(ii) Single Stock Futures
Futures on individual stocks (e.g., Reliance, TCS).
Higher risk as volatility is stock-specific.
(iii) Commodity Futures
Gold, silver, crude oil, wheat, copper.
Essential for farmers, producers, and speculators.
(iv) Currency Futures
USD/INR, EUR/USD, GBP/INR.
Help businesses hedge forex risk.
(v) Interest Rate Futures
Bonds and Treasury futures.
Used by banks and institutions to manage interest rate risk.
(vi) Crypto Futures
Bitcoin, Ethereum futures on exchanges like CME and Binance.
Extremely volatile, attracting speculative traders.
9. Advantages of Futures & Derivatives
Leverage: Control large positions with small margin.
Liquidity: Futures markets are highly liquid.
Transparency: Exchange-traded and regulated.
Hedging: Protection against adverse price movements.
Arbitrage Opportunities: Ensure fair pricing between spot and futures.
10. Risks in Futures & Derivatives
Leverage Risk: Small price moves can cause huge losses.
Liquidity Risk: Some contracts may lack liquidity.
Market Risk: Prices may move unpredictably.
Margin Calls: Traders must add funds if losses reduce margin balance.
Speculative Excess: Misuse of leverage can lead to financial crises (e.g., 2008).
Conclusion
Futures & derivatives are double-edged swords. Used wisely, they provide powerful tools for hedging, speculation, and arbitrage. Misused, they can cause devastating losses.
For traders, understanding market structure, margin system, risk management, and strategies is key before jumping in. Futures are not just about predicting the market—they’re about managing uncertainty.
Whether you’re a farmer protecting crop prices, a company managing forex risk, or a trader chasing short-term profits, derivatives are central to modern finance. With discipline and knowledge, they can open doors to immense opportunities.
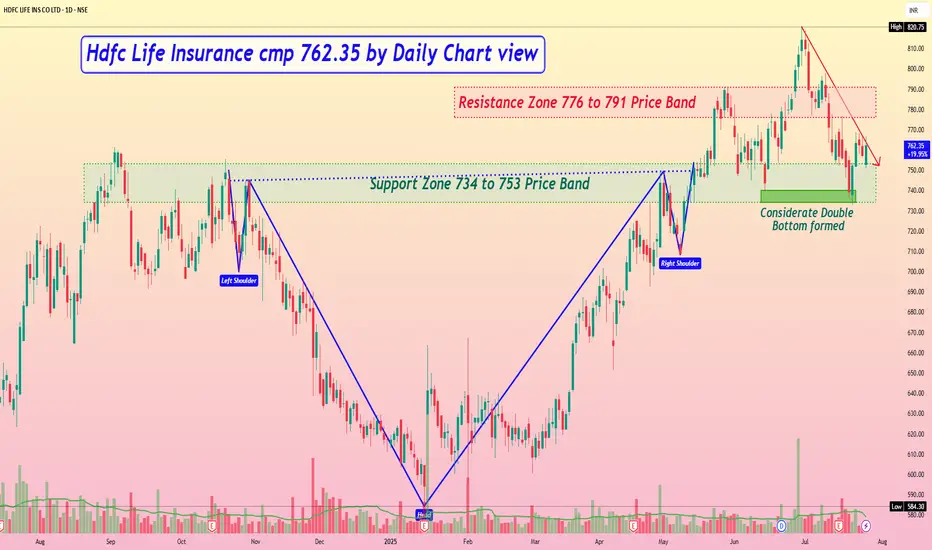
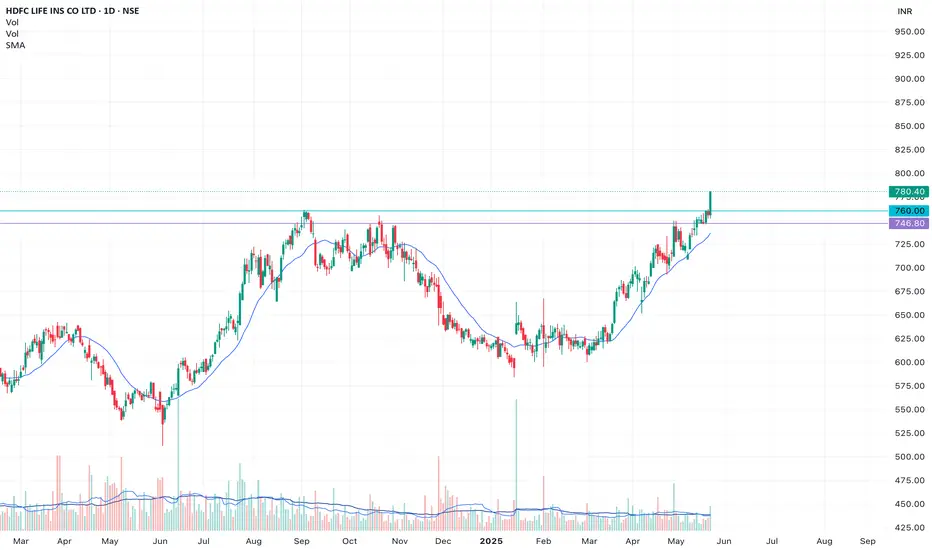
Hdfc Life Insurance cmp 762.35 by Daily Chart viewHdfc Life Insurance cmp 762.35 by Daily Chart view
- Support Zone 734 to 753 Price Band
- Resistance Zone 776 to 791 Price Band
- Bullish Head & Shoulders done at Support Zone neckline
- Considerate Double Bottom formed at the Support Zone price band
- Falling Resistance Trendline acting as hurdle for upside Price movement
HDFCLIFE : Swing PickNSE:HDFCLIFE #SwingTrading #swingtrade #trendingstock #breakoutstock
HDFCLIFE : Breakout Soon
>> Trending Setup
>> Volumes Dried up
>> Good Strength in Stock
Swing Traders can lock profit at 10% and keep Trailing
Please Boost, comment and follow us for more Learnings.
Disc : Charts shared are for learning purpose only, not a Trade recommendation. Do your own research and consult your financial advisor before taking any position.

HDFCLIFE positional trading ideasThe trend is bullish.
Breakout already done. Breakout candle is a large candle with high volume.
Price is above 20SMA.
Disclaimer: All information provided here is for educational purposes and not a recommendation, advice, research report, or stock tip of any nature. Analysis Posted here is just our view/personal study method on the stocks, commodities or other instruments and assets. Do your own analysis or consult your financial advisor before making any investment decision.
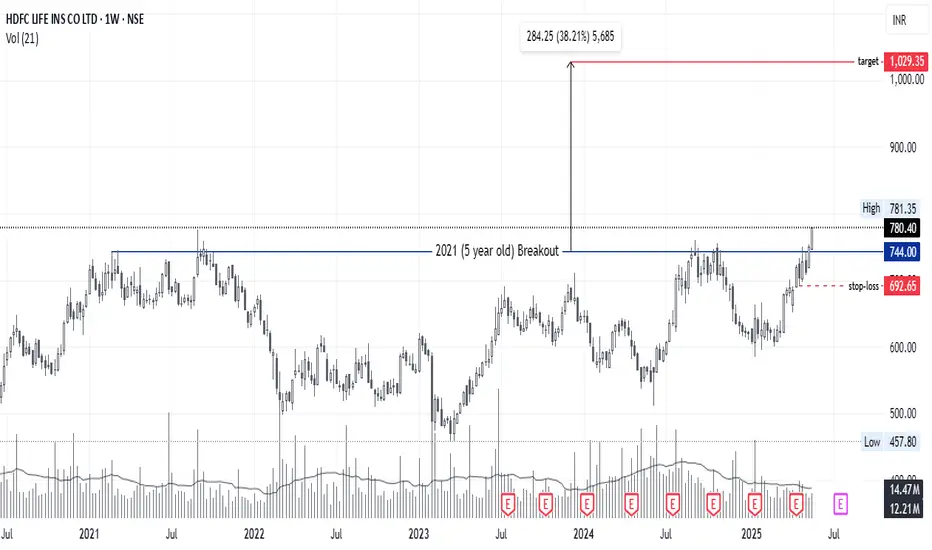
HDFCLIFE : 5 year old Breakout...HDFCLIFE is showing 2021 Breakout. It has a good potential..
CMP : 780
TG : 1030
SL : as per your apatite
Stock's selection based on 5 Point Analysis:
1: Idea : Breakout.
2: Support : Volume, Delivery .
3: Technical : 21/55/200-EMA, Super trend up, RS>0 RSI.
4: Fundamental : PE, PAT, Industry & peer PE and sector performance.
5: Timing : Entry Timing on Daily chart.
Disclaimer : It is my personal view as a trader and for educational purpose only. Equity market involves risk .
Please consult your financial adviser before taking any decision.
Disclosure : might be Hold
HDFCLIFE COMING OUT FROM 4 YRS RESISTANCEHDFCLife breaking 4 yrs resistance zone
hitting new ATH after August 2021
good volume, good RSI
if breaking 780 with good volume,will be more upside
NO BUY/SELL RECOMENDATION
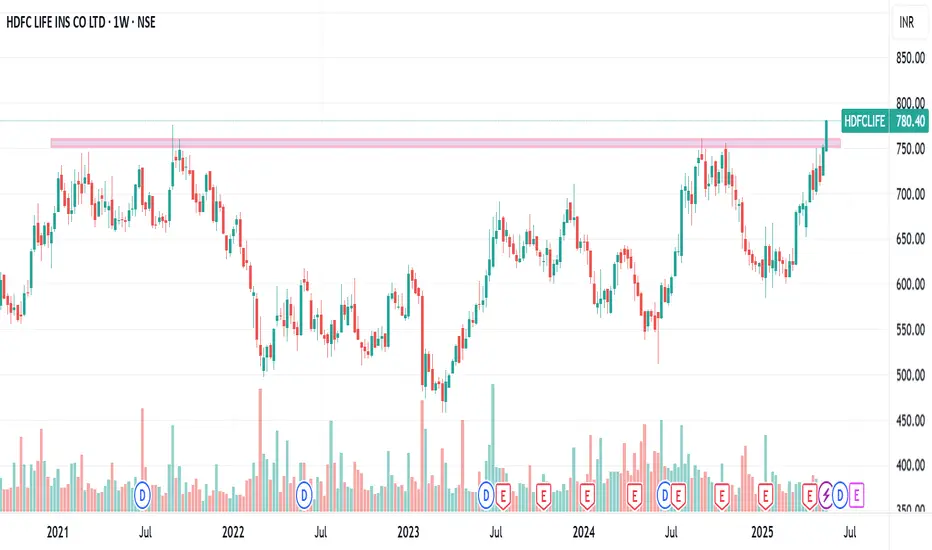
HDFCLife: Resistance & Channel Breakout Above 760Details:
Asset: HDFC Life Insurance Company Ltd (HDFCLIFE)
Breakout Level: 760
Potential Targets: 800, 840
Stop Loss: Below 745 or as per risk strategy
Timeframe: Short to medium-term
Rationale: HDFCLIFE has broken a key resistance and confirmed a channel breakout above 760. The move signals bullish momentum, supported by improving sentiment in the insurance sector.
Market Analysis:
Technical Setup: Breakout from horizontal resistance zone and channel formation adds strength to the bullish case.
Sector Outlook: Positive outlook for life insurance industry driven by rising awareness and penetration.
Risk Management:
Place a stop loss below 745 to avoid trap from false breakout.
Timeframe:
Short to medium-term move toward 800–840 anticipated.
Risk-Reward Ratio:
Attractive, with strong technical backing and sectoral support.
Watch for continuation with strong volume confirmation above 770 for follow-through.

HDFC LIFE 1 DayHDFC life insurance in 1 day time frame
It shows that :
the stock comes in golden zone and make bullish anglefing pattern
also it reaches the 400 EMA
it's also reached the previous resistance to retest it
there is a trend line and it touches
RSI is below 40
there is five confirmations also it is a good opportunity to trade in HDFC life insurance

HDFC Life Swing+positional Breakout Retest EMA supportHello Everyone,
HDFC life spot rate 688-90 taking suport of tredline breakout retest also EMA200. RSI is around 35 volume also support for bulls with fibbo reatrce 38% so good swing+positional long set up formed buy on dips setup in hdfc life.

LIC for 30%+ gainsDate: 5 Oct’24
Stock: Life Insurance Corp of India
Timeframe: Daily
LIC seems to be forming a complex diagonal in Wave V which could end at a minimum level of 1270+ (>30% from current price of 970) as seen in the chart. It could even go higher to around 1400 levels which will be confirmed only as the trend develops.
It seems to have completed Wave B on 4th Oct or may form another lower low to complete it and then move higher in Wave C of V.
This is not a trade recommendation. Please do your own analysis. And I have the right to be wrong.
Aida lagata hai ki LIC Wave V mein ek jatil vikarn bana raha hai jo minimum 1270+ ke star (970 kee maujooda keemat se>30%) par samaapt ho sakta hai, jaisa ki chart mein dekh sakte hain. Yeh lagabhag 1400 ke star tak bhee ja sakta hai jiski pushti trend vikasit hone par hi hogi.
Aisa lagata hai ki 4 Oct ko Wave B poora ho gaya hai ya ise poora karane ke lie ek aur nichala nimn bana sakata hai aur phir V ke Wave C mein oopar ja sakata hai.
Yeh koi trade karne ki salah nahin hai. Kripya apna vishleshan khud karein. Aur mujhe galat hone ka adhikaar hai.

Rounding Bottom Breakout Possible with Heavy Vol.NSE:HDFCLIFE Making a Good Rounding Bottom, Breakout Possible on Hourly Time Frame Keep a Check.

HDFCLIFE -Symmetrical Triangle -Breakout-wkly HDFCLIFE -Symmetrical Triangle -Breakout-wkly
Name - HDFCLIFE
Pattern - symmetrical triangle
Timeframe - Wkly
Status - Breakout
Volume - Good
Cmp - 745
Target - 1032
SL - 664
Pattern:
A symmetrical triangle pattern is a common chart pattern in technical analysis that indicates a period of consolidation before the price breaks out.
Fundamental ratios:
Here are some key fundamental ratios for HDFC Life Insurance Company Ltd. (HDFCLIFE):
Profitability Ratios:
Return on Equity (ROE): 8.5%
Return on Capital Employed (ROCE): 0.64%
Net Profit Margin: 6%
Valuation Ratios:
Price to Earnings (P/E) Ratio: 80.5
Price to Book (P/B) Ratio: 6.5
Solvency Ratios:
Debt to Equity Ratio: 0.04
Current Ratio: 0.9
Interest Coverage Ratio: 58.91
Efficiency Ratios:
Asset Turnover Ratio: 0.1
Expense Ratio: 11.1%

HDFC Life Uptrend to ContinueHDFC Life Insurance: Uptrend Continues with Parallel Channel Formation, More Upside Expected
HDFC Life Insurance is currently exhibiting a strong uptrend, with its price action moving within a well-defined parallel channel. This technical formation typically indicates a sustained trend, where the price oscillates between two parallel lines. The lower boundary of the channel acts as a support level, while the upper boundary serves as resistance.
The current market sentiment and technical indicators suggest that there is room for further upside. The stock has shown resilience at the lower boundary, consistently bouncing back, which is a positive sign for the continuation of the uptrend. As long as the price remains within this channel, the momentum is likely to carry HDFC Life higher.

HDFCLifeThis has been a tough IPO stock but we are able to hold it because it was offline account.
It has formed parallel channel since listing. hopefully it may test upper edge of the channel

HDFC LIFE - APPROACHING DEMAND ZONESymbol - HDFCLIFE
HDFC Life Insurance Company is engaged in carrying on the business of life insurance. The Company offers a range of individual and group insurance solutions. The portfolio comprises of various insurance and investment products such as Protection, Pension, Savings.
HDFC Life is approaching demand zones on charts. 500 - 540 is a major support zone for HDFC Life. Stock is currently trading at a good valuation.
I'm seeing a positional trade opportunity on buy side. I usually trade in futures but this time I'm taking this trade in cash as general elections are due in June which is a major event for market makers.
I'm investing 50% allocation today at CMP 540. I'll invest 50% more at 510 level & will hold this position with 495 as SL. Targets I'm expecting on long side will be 580 - 615 - 640 - 675. I'm ready to hold this trade for 3 - 6 months.
Disclaimer - Do not consider this as a buy/sell recommendation. I'm sharing my analysis & my trading position. You can track it for educational purposes. Thanks!

HDFCLIFE TRENDLINE BREAKOUT WCBHDFCLife breaking trendline resistance
with good volume and rsi
macd crossover done
#target1 690,#target2 750
EDUCATIONAL IDEA

Hdfc life ReadyReady to break the Zone
Can go For Long Target
....Get Ready Bulls are Back with Low PE

HDFC Life Insurance Company Ltd - Break Out OpportunityDate : 14-Mar-2024
Rating : Buy - Positional Trade
LTP : Rs. 622.25
Targets: (1) Rs. 648 --> (2) Rs. 710 --> (3) Rs. 746 --> (4) Rs. 775
SL : Rs. 600
Technical View:
• NSE:HDFCLIFE is in its primary uptrend since Mar-2023.
• From Dec-2023 to Feb-2024, It was going through secondary down trend within primary uptrend.
• NSE:HDFCLIFE has broke out from its secondary down trend on 1-Mar-2024.
• RSI is at 61.67 which is in buy zone and supporting bullish sentiment.
• MACD is at 6.71 which is giving bullish signal.
• NSE:HDFCLIFE is looking strong from here onwards to achieve the historical levels mentioned as targets above.
Disclaimer : I am not a SEBI registered analyst/consultant and not recommending anyone to take any BUY or SELL position in stock market. Investing in stock market is risky and one should do a self analysis and validation before investing in stock market.
