for short term and long term..!!hdfc life is a great stock in it's sector it has huge potenials ..!!
happy trading
HDFCLIFE

HDFC LIFE uptrendHDFC Life can continue its uptrend with recent swing low as stop loss for intraday.


HDFCLife#hdfclife followup... from 560 to now 623.. was confident about move but Volumes were not impressive, next is 650.

Is It Right Time To Go With HFDC Life Insurance Ltd.?Technical Overview (Weekly Chart): On a weekly chart picture is clear, the stock price has made a lifetime high around 650 and fallen from the same levels trice. However, if we see a sequence of falls and rise, then it is clearly showing 85% completion of Inverted Head and Shoulder. Right now the second shoulder is not completed, but it is indicating rally till lifetime high. Major bullish chart pattern on a large time frame, it is a good sign of long term.
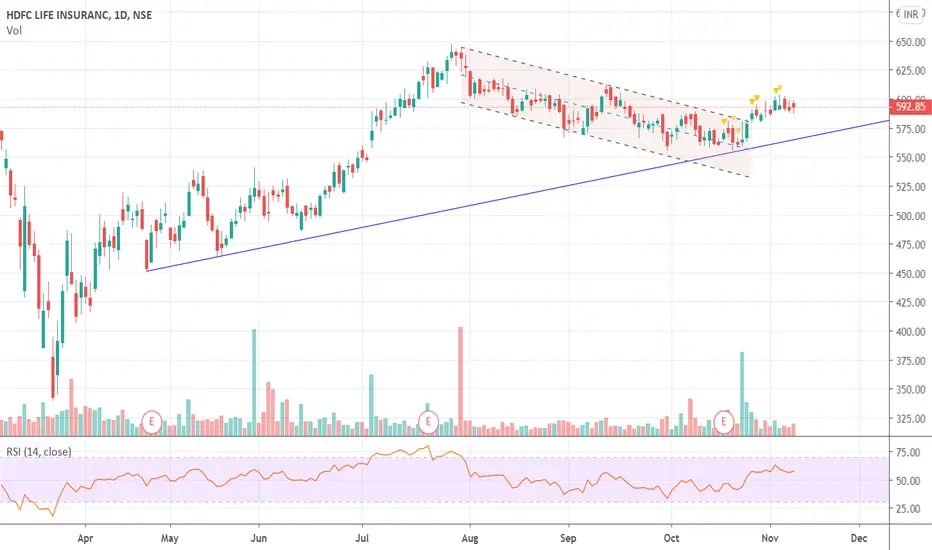
Daily Chart: Now come to the small picture and price is trading in a down channel. It is trading below the 20 & 50 DMA and many times resisted from the same levels. Today price has crossed and closed above both DMA, and volume is good. If we see the line chart then the stock has made Double Bottom and now ready for a breakout. Once it breaks the previous Lower High, then the trend will change and there is one small hurdle around 610 between lifetime high.
Fundamentals:
The company is providing life insurance and due to COVID-19 demand has increased. The company is virtually debt-free and expecting good quarterly results. The return on equity is around 20%.

HDFC LIFE super breakout!NSE:HDFCLIFE
I am starting a new telegram channel. To join my telegram channel, leave a comment with "interested."

HDFC LIFE POSITIONAL BUY ABOVE 589HDFC LIFE BUY ABOVE 589 CLOSING BASIS
SL 560
TARGET: 594, 605, 611, 618, 625, 632
RISKY ENTRY BETWEEN 550-560
SL 540
Posting for Educational purpose only
Closing Basis means stock need to trade above 589 between 3:20 ~ 3.30 PM
If my analysis appears OK then please LIKE, FOLLOW and SHARE to get more future ideas

HDFCLIFEIm not an expert im just sharing my views on HDFCLIFE for tomorrow
Im not responsible for any profit or loss this is not a recommendation
HDFCLife#hdfclife followup... Bull run does not seem to be survived... Volumes are too low..lets see...

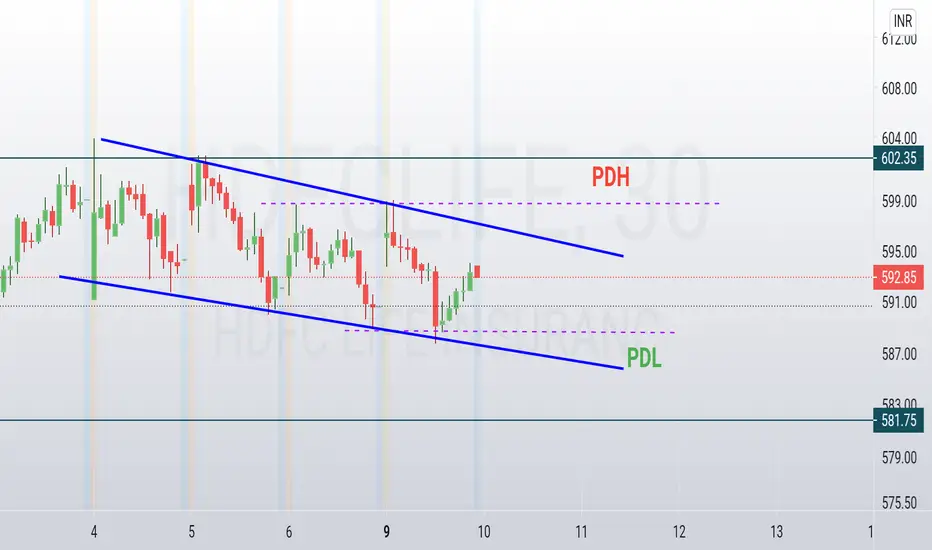
HDFCLIFEHDFCLIFE Break and sustain above parallel line .if break this small consolidation level then you can add in Buy watch list.

Stock Analysis of HDFC LifePrice - ₹587.50 Dt. - 03-11-2020
The price is near the support line placed at ₹584.15. 21DEMA is ready to cross the 50DEMA from below within 2-3 trading sessions. If opens in green then it will be the buy signal. If the stock fell then it can try to touch the 21DEMA. RSI is neutral and MACD has given the buy signal.


HDFC LIFE has reversed trend and broken a trendline with volHDFC LIFE has reversed trend and broken a trendline with above avg volume.

HDFCLife#hdfclife Follow up... Bullish here from 560, patience pays off...Gave a breakout as expected... first target too...


HDFCLife#hdfclife Followup... what a move from 560 to 578. Reached channel upper TL. Next is to breakout.


HDFC LIFE H&S and Triple Bottom pattern in 15TFIm not an expert im just sharing my views on HDFC LIFE for tomorrow
Im not responsible for any profit or loss this is not a recommendation
