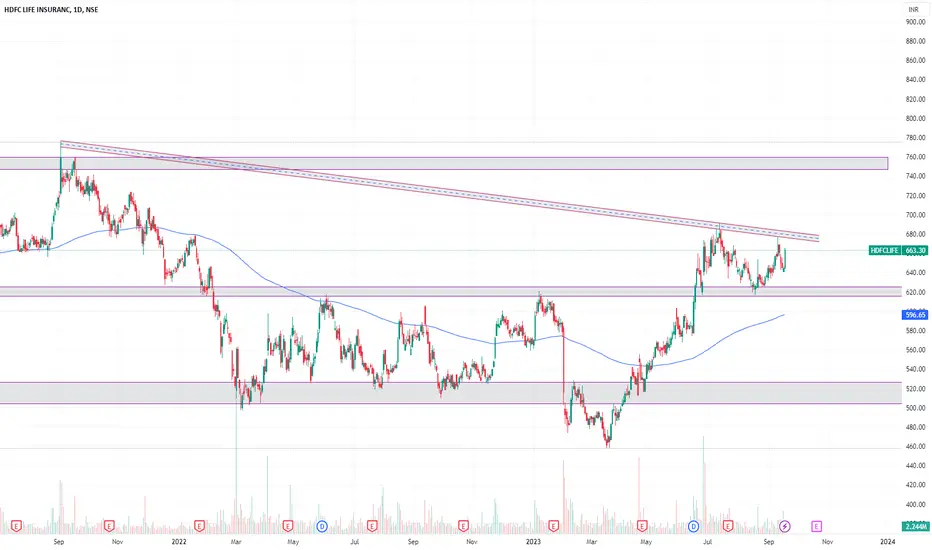
HDFCLIFEStock made a higher high and at higher low.
currently in a consolidation phase. buy in parts in current levels and also at levels below it.
Buy in parts for better Money management
HDFCLIFE

HDFCLIFE | GOOD BUY CANDIDATEHDFCLife formed a double bottom and created a bullish engulfing candle on daily time frame on 4th Jan. The stock is trading near demand zone and if holds these levels, we expect to see a good upside.
To motivate us, Please like the idea If you agree with the analysis.
Happy Trading!
InvestPro India

HDFC LIFE !Trend is neutral
Net Sales of 46,513cr has grown at 56.23%
Pat has grown at 20.84%
PE is too hot and high at 93.43%
mutual fund stake has increased from 4% to 4.66%past quarter
stock is a good buy at 520-560
Wait for the dip

HDFCLIFE | Swing Trade📊 DETAILS
Sector: Life & Health Insurance
Mkt Cap: 143,675 cr
HDFC Life Insurance Company is engaged in carrying on the business of life insurance. The Company offers a range of individual and group insurance solutions. The portfolio comprises of various insurance and investment products such as Protection, Pension, Savings,(Source : 202003 Annual Report Page No: 175)
TTM PE : 97.50 (Average PE)
Sector PE : 18.74
Beta : 1.00
📚 INSIGHTS
Mid range performer
Stock with medium financial performance with average price momentum and valuation. These stocks may be affordable and are showing some investors interest.
3.40% away from 52 week high
Outperformer - HDFC Life Insurance Company up by 6.88% v/s NIFTY 50 up by 2.57% in last 1 month
📈 FINANCIALS
Piotroski Score of 3/9 indicates Weak Financials
Disclaimer: This analysis is for educational purposes only, and I'm not a SEBI registered analyst.
If you found this analysis helpful, I encourage you to like and share it. Your observations and comments are also welcomed below. Your support, likes, follows, and comments motivate me to consistently share valuable insights with you.
🔍 More Analysis & Trade Setups 🔍
For more technical analysis and trade setups, make sure to follow me on TradingView: www.tradingview.com

HDFC LIFE : Multibagger Investing Idea Exciting Bullish Pattern Alert! 🐂
📊 Pattern: Broadening Pattern
📌 Symbol/Asset: HDFCLIFE
🔍 Description: Stock is making broadening pattern. We can see huge upisde in the stock.
Its a Buy on dip stock.
👉 Disclosure: We are not SEBI registered analysts, this is not a buy or sell recommendation.

HDFCLIFE C&H BREAKOUTHdfclife c&h pattern breakout
with huge volume and good rsi
MACD crossover done
near #target can be 760
educational idea only

HDFC Life: Charting a Breakout Journey to New Highs!Witness the journey of HDFC Life Insurance through its complete history. Study the chart attentively, and you might glean valuable insights.
From a technical perspective , HDFC Life Insurance is signaling another breakout after a substantial consolidation phase. Anticipating a move towards, and potentially beyond, its all-time high.
Consider a swing low around 667 , set a stop-loss just below, and set your sights high. This is my analysis for you.
Stay tuned for further updates as the story unfolds. 📈✨ #HDFCLife #TechnicalAnalysis

HDFCLIFE: Impulsive riseStock is rising in an impulsive manner from Oct'23 low of INR 600.75 of which 3rd wave is already concluded at INR 695 and currently stock is correcting lower in wave-4. As per the current price action stock has taken a support on the upper boundary of the Impulse channel 1-2 and is hovering above 38.2% Fibbonacci retracement zone which is likely to hold in the coming days. Once the price cross above 685 , that will be the final confirmation that prices have started it's 5th wave which shall take the prices towards INR 720 zone.

LevelsHere, is the analysis for HDFCLIFE ....
This is will definitely help you to decide your investment or trading...

HDFCLIFE, 15min Falling Wedge BOFalling wedge BO in 15 min TF
Entry : 625
Target : 631/637
SL : 619
RR : 1 /. 2

HDFClifeparallel channel in progress. however this is overbought. retracement towards 600 would be good for fresh entry. Moving forwards as well it may remain slow of a year may be

HDFC LIfe Insurance Short Term Long Trade IdeaHDFC LIfe Insurance Short Term Long Trade Idea
Buying levels: Best Buying/Accumulation Zone between 644 to 655
Stop loss below 639
1st Target 677 t0 685
2nd Target 700 Plus
Disclaimer:
I do not give any tips or buy sell recommendation I only teach trading strategies.
These levels are purely based on Price action/demand and supply zones & and consumed only for educational purpose & should not be taken as buy/sell recommendation. I will not be responsible for any loss/profit incurred if anyone takes trades based on my view.
Please consult your Financial Advisor before making any trading decision

HDFC Bank Daily chart analysis || Long term BuyHDFC and Reliance are charting distinct paths compared to the broader Indian market, exerting a direct influence on the Nifty and Sensex indices. The recent drop of almost 10% from their all-time highs, coupled with the breach of key support levels, raises significant concerns for these indices.
The absence of immediate support levels suggests that the upcoming month could witness heightened volatility and increased difficulty for stocks in identifying robust support zones for a rebound. For those considering long-term investment, the present moment presents an opportune time to buy, as the downside risk is limited to less than 5%


HDFCLife ChartHere, is the chart of HDFCLIFE, Hope the levels will help you a lot to trade or invest...
HDFC Life - Keep on RadarThe stock has come down to the support area as shown on the charts. May reverse from here itself or may come down to even 600 levels. Keep tracking for a comfortable entry so that your stop-loss should be humble.
We should learn to hunt like a tiger. Show extreme patience. Take time to identify the trade to make a perfect entry. So that our target may not miss.
Only for learning and sharing purposes, not a piece of trading advice in any form.
All the best for your trading journeys.

HDFCAMC Fall expectedI am not holding HDFCAMC. You may book profits here
Disclaimer: This analysis is solely for educational purposes and does not make me a SEBI registered analyst.
If you found this analysis helpful, I encourage you to like and share it. Your observations and comments are also welcomed below. Your support, likes, follows, and comments motivate me to consistently share valuable insights with you.
🔍 More Analysis & Trade Setups 🔍
For more technical analysis and trade setups, make sure to follow me on TradingView: www.tradingview.com


#HDFCLIFE Analysis with support and resistance zones.All details in chart.
This includes RSI strategy, Futures OI strategy, EMA strategy, Support and Resistance Zones.

Seems HDFCLIFE can rally towards 715 levels this.NSE:HDFCLIFE had been stuck in 670-685 range for so long time. It has been testing 690 levels every other day and this time (hopefully) it breaks 690 and goes towards 715.

HDFC Bank LtdMajor points of HDFC Bank.
Disclaimer: Only for eductaion purpose, do own research before investing in stock market.

HDFCLIFE has made a negative candle todayNSE:HDFCLIFE has been showing good strength for quite sometime but today it has created a negative candle. A small retracement can be seen.

HDFCLIFE respected 645 levelsNSE:HDFCLIFE again getting ready for 675 provided no institutions are exiting from it.
