NSE:HDFCBANK LongNSE:HDFCBANK
#NSE:HDFCBANK bouncing from the same support and created new support and resistance, Both marked on chart.
Trade accordingly, Still got any doubts can ping me.
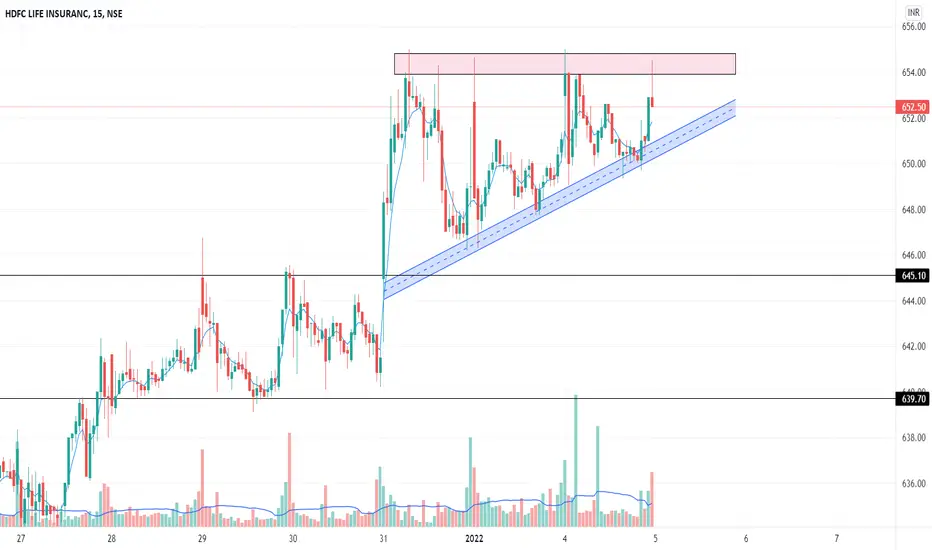
HDFCLIFE

HDFC lifeHDFC life :
Reasons/Traits :
* Bullish Bat formation can be seen
* It can also be called as Bear Pattern 1-2-3 (Entry stop loss marked); 1:2/3/4 can used as risk reward if it follows
* Price took support @ 0.786 fib retracements levels
* Price also took support @ 200 EMA while 20 EMA cuts 50 EMA from top
* Falling RSI, Stoch and MACD
What can happen next :
Scenario 1 : Price sustaining above 694 level can take it to 700/710/720/740/760/775 levels
Scenario 2 : Price break down below 682 levels can take it 670/656/644 levels
Disclaimer : This analysis is only for educational purpose and not be considered as any trading idea/tip. Please consult your financial advisor before you take any trade and we are no way responsible for your profits/losses. Thank you!
Please do like and share this idea. Thanks


HDFC life insu UPSIDE Pot - Jan-Feb-MarExpected trend for HDFC Life Insurance. 10% upside potential in 20 days.

BUY hdfc life above 675 !!!!!! Target : 900
stoploss : 650
GO really long after crossing 675
you can invest but be careful and have some advisory !

HDFC LIFE INTRADAY ANALYSISDESCENDING TRIANGLE formation in HDFC LIFE.We can short after breaking 50ema and 668 levels .and make 200ema as target 1.For long entry it should break the trendline. Targets are mentioned in the chart itself.

TRENDLINE BREAKOUT It is advisable to take conservative entry .
HDFC Life trendline breakout. Breakout push is huge so after some consolidation you can expect great move.

ICICI Prudential Life Insurance ready for the uptrend!🤩💸🔥Both TECHNICALLY and FUNDAMENTALLY strong stock.💪💪
The company recently posted the best QOQ & YOY result and will very likely post a similarly strong result in Q3 too.
.
The stock had given a multi-year breakout in May last year after that from September it was in a retracement phase. With the recent breakout of the last Lower High in the daily timeframe, we can see a strong uptrend from the present level.
.
💎@technofunda_trader
Few Important rules from my Trading Philosophy:
1. Buy QUALITY stock.
2. Buy RIGHT, Sit TIGHT- Only sell in loss if the fundamentals deteriorate, problems arise in management or any other similar fundamental issues.
3. Don't invest more than 5-10% in any stock & more than 25% in any particular or related sector.
4. Build position GRADUALLY as the stock RISES.
5. Trade in the DIRECTION of the BIGGER trend.
6. RIDE the TREND. Don't sell your WINNERS early.
.
LIKE, COMMENT & SHARE 😄😄😄

Long HDFC LifeDetails as updated in the Charts.
Go Long with strict Stop Loss for a specified Targets.

HDFC LIFEHi guys, this chart is for educational purpose only not for sale... plz do your own analysis too.. Thank Q

Simple Trade Setup | HDFCLIFE | 16-12-2021 [ INTRADAY ]NSE:HDFCLIFE
Observations:
1) On 1hr time frame, we can see it has major suppor range of 660-665 level range.
If it sustain above it then we can see an good upmove.
Also we can see the resistance Trendline.
Please refer below chart : 1hr Time Frame.
-------------------------------------
Trade Setup for Date: 16-12-2021
1) Don't Jump in to trade at the beginning of the market. Let it get settle for 15-20min first and judge the price action.
2) Everything is mentioned on the chart. I hope it is easy to understand.
3) All the levels will work as support, resistance, entry and exit w.r.t price action near that level.
4) Avoid gap up or gap down chase. Wait and trade between levels.
Please refer below chart for levels.
Hope I made it easy to understand it.
Do comment your doubt or suggestion.
Note: Trade with Strict SL. It may or may not hit all the levels. So one can book profit / loss at respective level considering how price action works near that level.

HDFC LifeGood time to buy HDFC Life, hasn't moved in this bull market.
"Apna Tym Ayga"
Has minimum 36% upside, look to add till 638. Below that SL.

Buy Hdfc Life InsuranceBuy Hdfc life only above 715 for the Target of 740
715 will be the Breakout Level of Cup & Handle Pattern

HDFCLIFE important levels for long term investmentHDFCLIFE important levels for long term investment
Disclaimer: All charts are purely for educational and information purpose only. Invest or Trade at your own risk.

HDFC Life Insurance Company Ltd - 05.12.2021HDFC Life Insurance Company Ltd - 05.12.2021
The stock is trading @ 691 levels
There is an Engulfing Bear in daily chart
The prices are below ema
Stochastic overbought in daily chart
The stock is trading under a Channel Range
Let the prices go below 687
watch out for the price action

NSE:HDFC BONSE:HDFC
#NSE:HDFC trading bullish and reached resistance level, high chances to BO
Post confirmation may try 2800 CE
Good above 2826.

HDFCLIFEprice above 20 ema
closed above upper Bollinger band
Macd buy signal
RSI > 60
ADX is rasing
other insurance companies also in rally

HDFC Life Trend AnalysisRating: Positive
Level: Rangebound but can breakout soon if level of 740 can be taken out with high volume which is missing so far.
Business Outlook: Very good
HDFC Life in in talk to acquire Exide Life Insurance business which will have a positive impact on his business. Target of 850-900 is possible in medium term

HDFC LIFE BUYvery important setup. script was range bound (Yellow Lines) since Nov 20. after an year........it took support from the area OF DEMAND made just above the support (denoted by white dashed line) and reached the resistance level. If scricpt BO above 721 and sustain it. that will be a signal of fresh buying for the target 758 in short term with Stop loss 720. NSE:HDFCLIFE

Hdfclife breakout After a long time and Weekly and daily breakout .Targets and Sl on the charts ! IF there is a dip can add too ! FUNDAMENTALLY good stock .Short term 745 760 775 850 .. long term 1k .

Good pattern in making, can go Long in HDFCLIFEGo long in #HDFCLIFE above 710, with SL 678.
If the price closes above the Red line go long, with the SL just below 678.

Long HDFC LifeHDFCLife: (CMP: 703)
Fundamentally Sound : Score 7.5/10
Demand Zone : 655 to 677.
Strong Support : 690 to 695 for Short Term
RSI Taking support around 35-40 Levels everytime.
Ideal Trade: Selling 700 PE may be Dec for generating 4% of return on Margin blocked.
